| Tissue | Expression Dynamics | Abbreviation |
| Cervix | 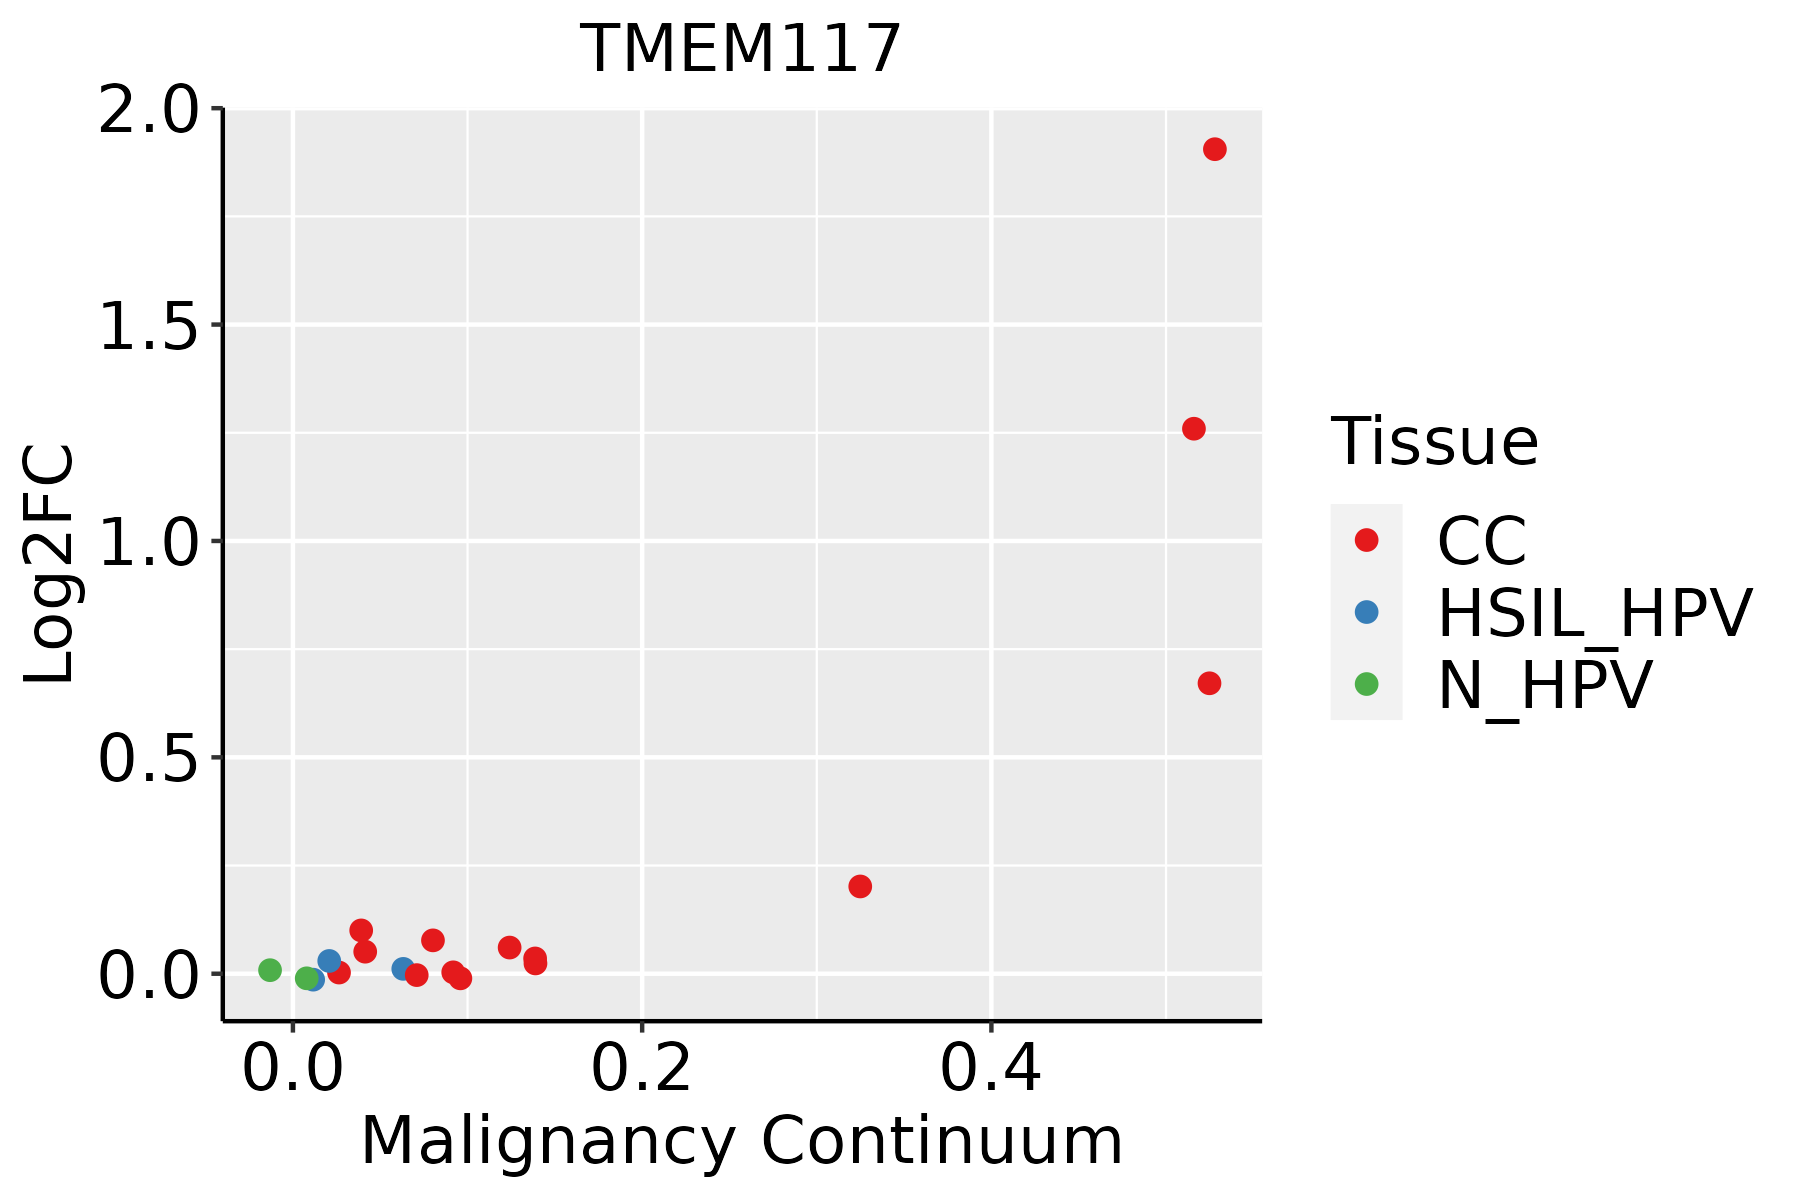 | CC: Cervix cancer |
| HSIL_HPV: HPV-infected high-grade squamous intraepithelial lesions |
| N_HPV: HPV-infected normal cervix |
| Colorectum (GSE201348) |  | FAP: Familial adenomatous polyposis |
| CRC: Colorectal cancer |
| Colorectum (HTA11) |  | AD: Adenomas |
| SER: Sessile serrated lesions |
| MSI-H: Microsatellite-high colorectal cancer |
| MSS: Microsatellite stable colorectal cancer |
| Endometrium | 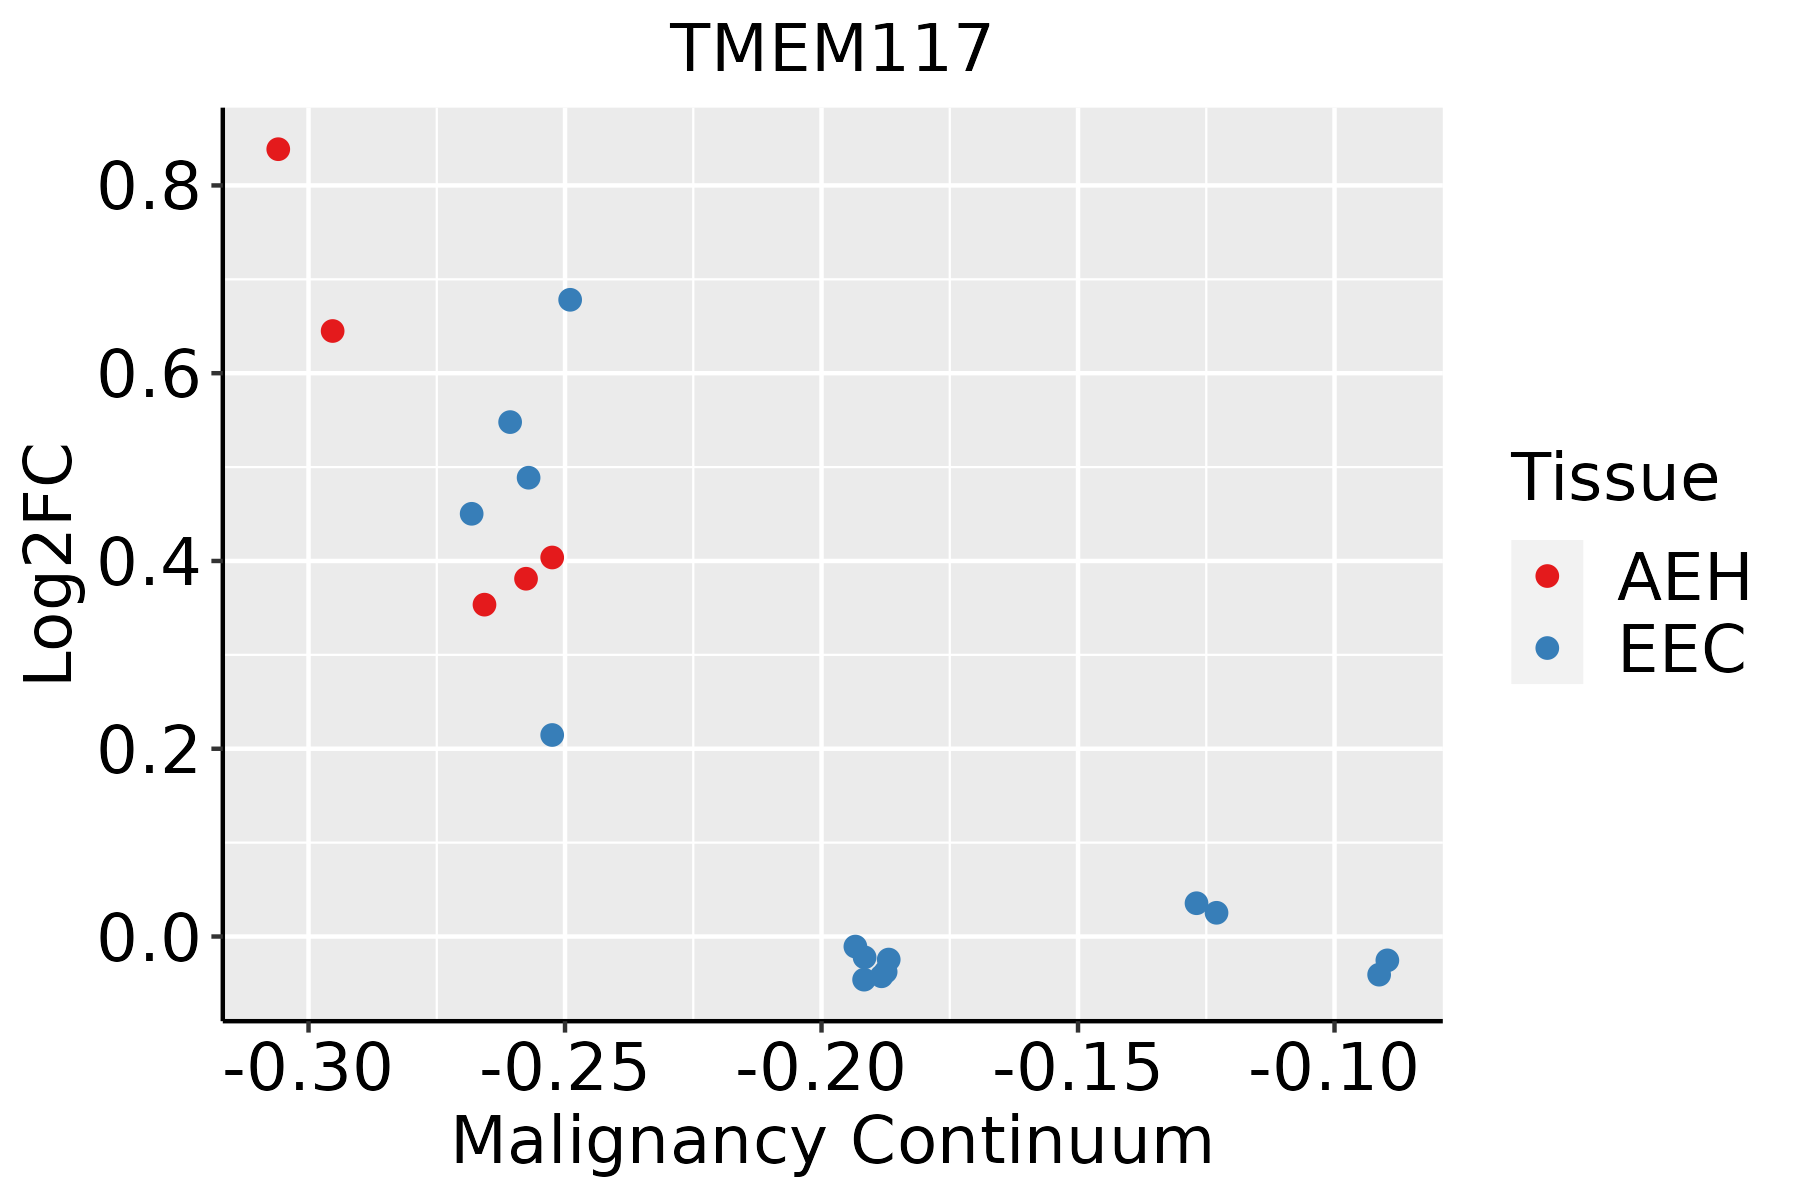 | AEH: Atypical endometrial hyperplasia |
| EEC: Endometrioid Cancer |
| Esophagus | 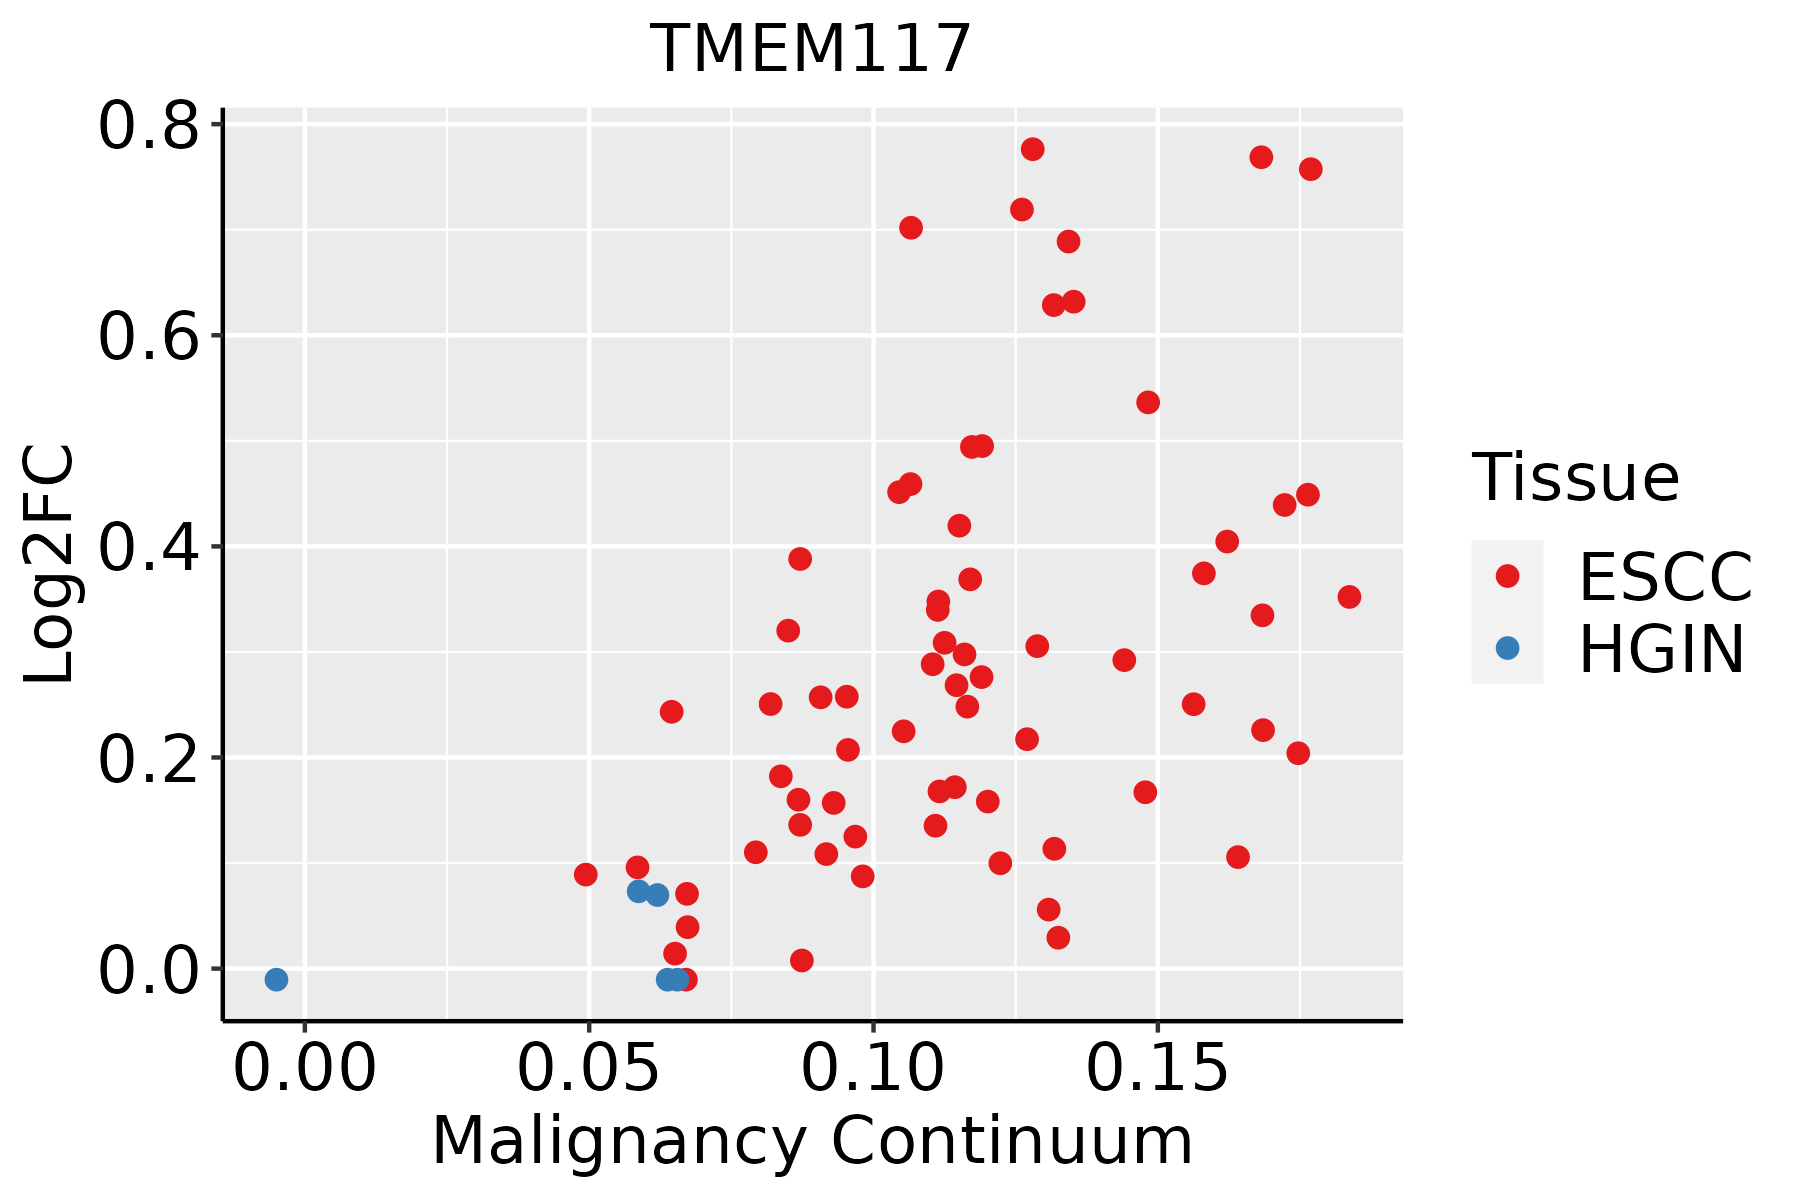 | ESCC: Esophageal squamous cell carcinoma |
| HGIN: High-grade intraepithelial neoplasias |
| LGIN: Low-grade intraepithelial neoplasias |
| Skin | 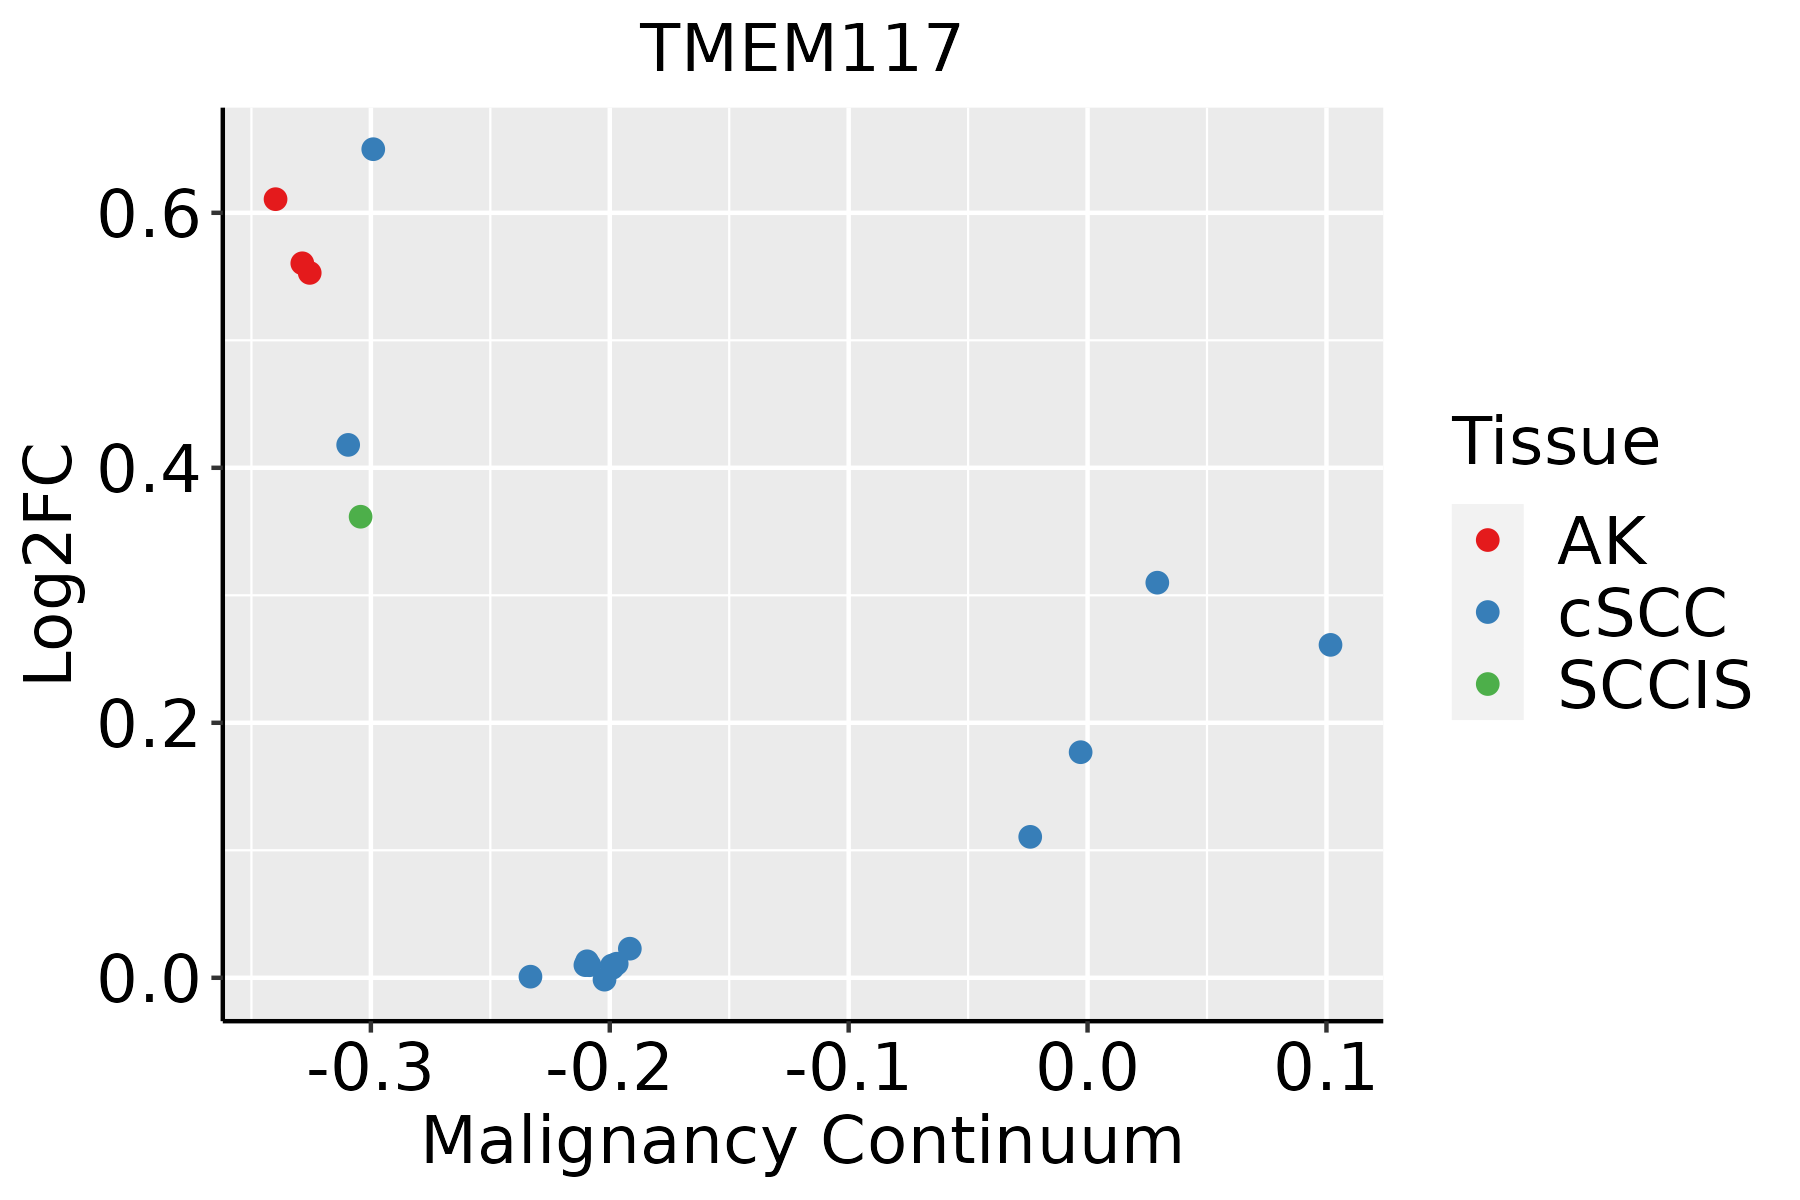 | AK: Actinic keratosis |
| cSCC: Cutaneous squamous cell carcinoma |
| SCCIS:squamous cell carcinoma in situ |
| Thyroid | 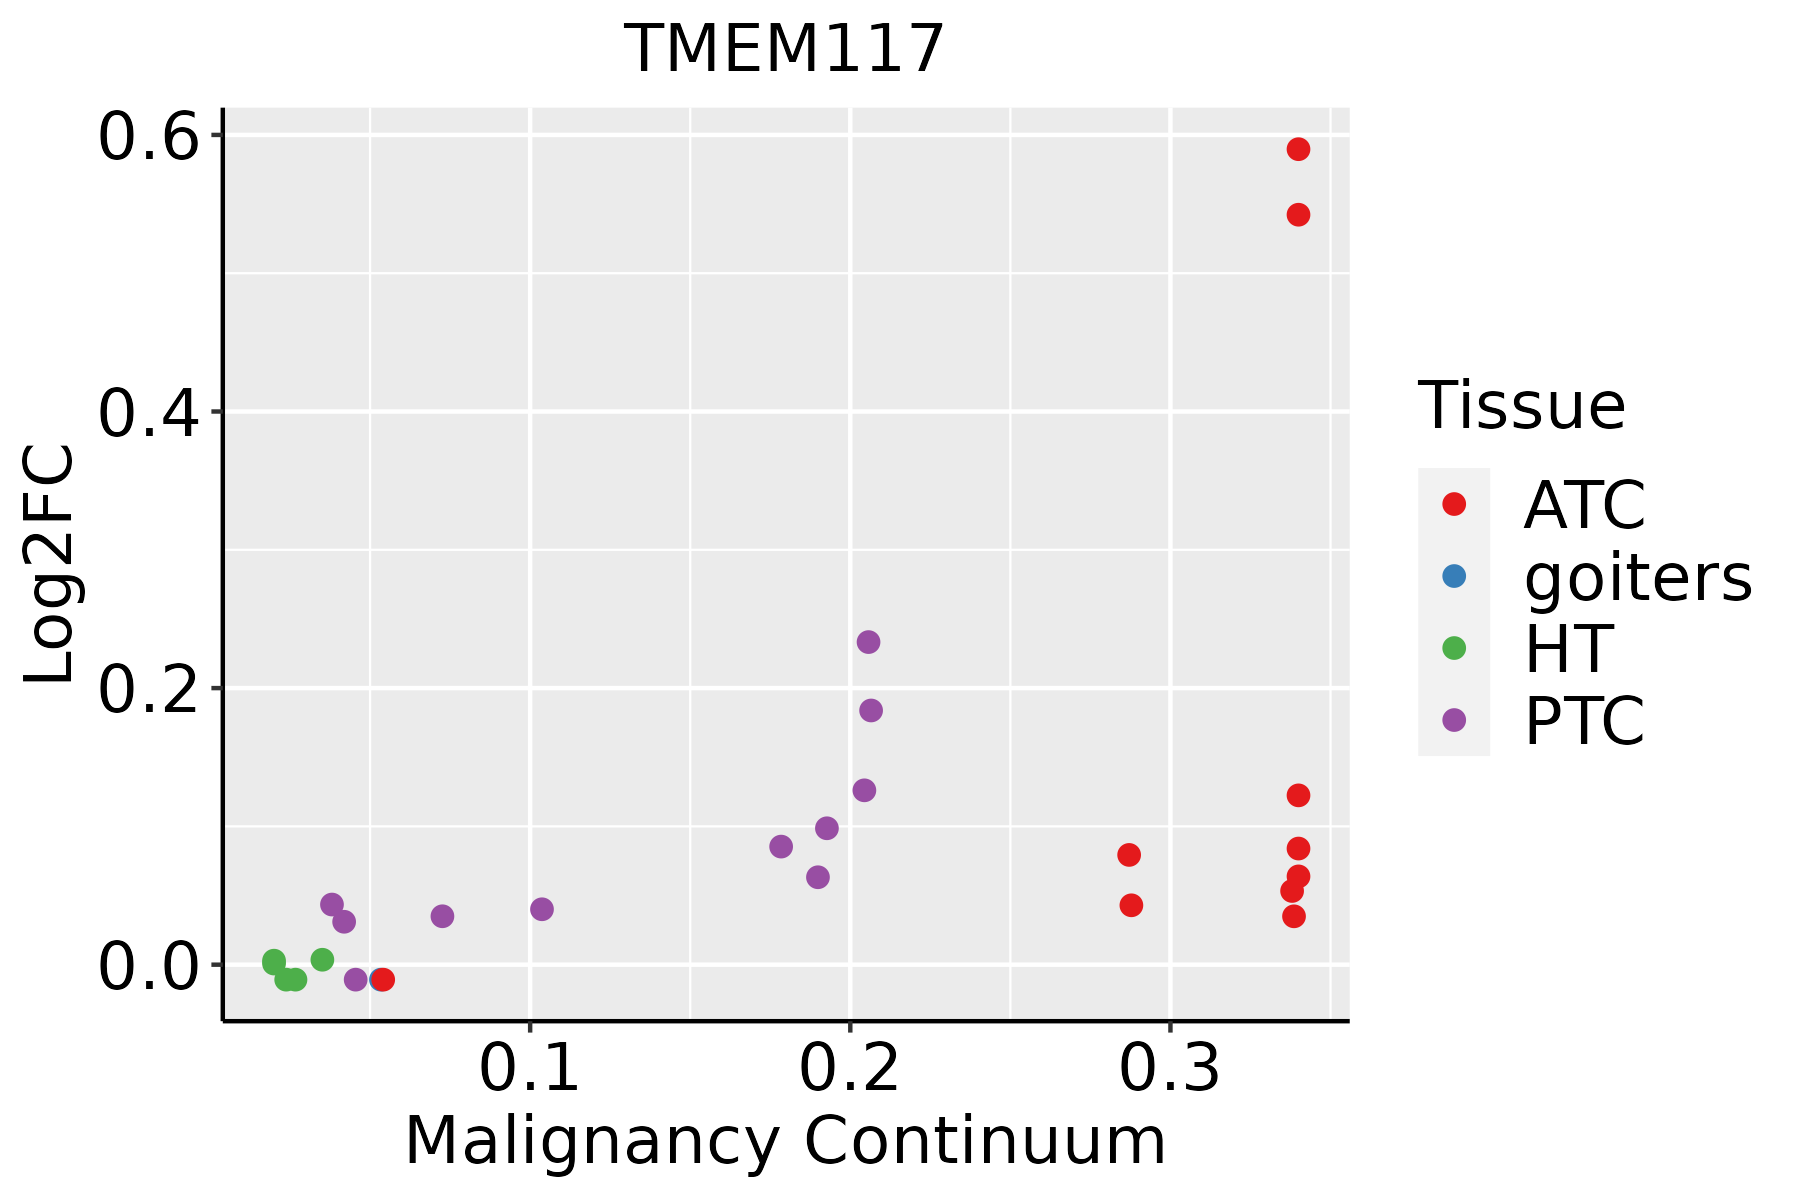 | ATC: Anaplastic thyroid cancer |
| HT: Hashimoto's thyroiditis |
| PTC: Papillary thyroid cancer |
| GO ID | Tissue | Disease Stage | Description | Gene Ratio | Bg Ratio | pvalue | p.adjust | Count |
| GO:009719310 | Cervix | CC | intrinsic apoptotic signaling pathway | 85/2311 | 288/18723 | 4.56e-15 | 6.46e-12 | 85 |
| GO:003497610 | Cervix | CC | response to endoplasmic reticulum stress | 57/2311 | 256/18723 | 5.81e-06 | 1.42e-04 | 57 |
| GO:00700599 | Cervix | CC | intrinsic apoptotic signaling pathway in response to endoplasmic reticulum stress | 21/2311 | 63/18723 | 1.18e-05 | 2.51e-04 | 21 |
| GO:0097193 | Colorectum | AD | intrinsic apoptotic signaling pathway | 108/3918 | 288/18723 | 6.25e-11 | 6.41e-09 | 108 |
| GO:0034976 | Colorectum | AD | response to endoplasmic reticulum stress | 90/3918 | 256/18723 | 8.48e-08 | 4.28e-06 | 90 |
| GO:0070059 | Colorectum | AD | intrinsic apoptotic signaling pathway in response to endoplasmic reticulum stress | 29/3918 | 63/18723 | 7.03e-06 | 1.73e-04 | 29 |
| GO:00971931 | Colorectum | SER | intrinsic apoptotic signaling pathway | 87/2897 | 288/18723 | 1.67e-10 | 2.32e-08 | 87 |
| GO:00349761 | Colorectum | SER | response to endoplasmic reticulum stress | 74/2897 | 256/18723 | 3.01e-08 | 2.05e-06 | 74 |
| GO:00700591 | Colorectum | SER | intrinsic apoptotic signaling pathway in response to endoplasmic reticulum stress | 25/2897 | 63/18723 | 2.92e-06 | 1.18e-04 | 25 |
| GO:00971932 | Colorectum | MSS | intrinsic apoptotic signaling pathway | 102/3467 | 288/18723 | 6.06e-12 | 9.82e-10 | 102 |
| GO:00349762 | Colorectum | MSS | response to endoplasmic reticulum stress | 81/3467 | 256/18723 | 2.65e-07 | 1.10e-05 | 81 |
| GO:00700592 | Colorectum | MSS | intrinsic apoptotic signaling pathway in response to endoplasmic reticulum stress | 27/3467 | 63/18723 | 6.93e-06 | 1.79e-04 | 27 |
| GO:00349764 | Colorectum | FAP | response to endoplasmic reticulum stress | 61/2622 | 256/18723 | 1.58e-05 | 4.10e-04 | 61 |
| GO:00971934 | Colorectum | FAP | intrinsic apoptotic signaling pathway | 66/2622 | 288/18723 | 2.76e-05 | 6.33e-04 | 66 |
| GO:00700593 | Colorectum | FAP | intrinsic apoptotic signaling pathway in response to endoplasmic reticulum stress | 18/2622 | 63/18723 | 1.95e-03 | 1.65e-02 | 18 |
| GO:00971935 | Colorectum | CRC | intrinsic apoptotic signaling pathway | 57/2078 | 288/18723 | 9.77e-06 | 3.31e-04 | 57 |
| GO:009719316 | Endometrium | AEH | intrinsic apoptotic signaling pathway | 75/2100 | 288/18723 | 1.46e-12 | 2.83e-10 | 75 |
| GO:003497616 | Endometrium | AEH | response to endoplasmic reticulum stress | 62/2100 | 256/18723 | 2.88e-09 | 2.13e-07 | 62 |
| GO:007005910 | Endometrium | AEH | intrinsic apoptotic signaling pathway in response to endoplasmic reticulum stress | 18/2100 | 63/18723 | 1.32e-04 | 1.80e-03 | 18 |
| GO:009719317 | Endometrium | EEC | intrinsic apoptotic signaling pathway | 80/2168 | 288/18723 | 3.35e-14 | 9.13e-12 | 80 |
| Hugo Symbol | Variant Class | Variant Classification | dbSNP RS | HGVSc | HGVSp | HGVSp Short | SWISSPROT | BIOTYPE | SIFT | PolyPhen | Tumor Sample Barcode | Tissue | Histology | Sex | Age | Stage | Therapy Types | Drugs | Outcome |
| TMEM117 | SNV | Missense_Mutation | rs769011235 | c.92C>T | p.Ala31Val | p.A31V | Q9H0C3 | protein_coding | tolerated(0.14) | probably_damaging(0.987) | TCGA-A7-A26H-01 | Breast | breast invasive carcinoma | Female | >=65 | I/II | Hormone Therapy | anastrozole | PD |
| TMEM117 | SNV | Missense_Mutation | | c.256C>A | p.Leu86Met | p.L86M | Q9H0C3 | protein_coding | deleterious(0.04) | possibly_damaging(0.571) | TCGA-AO-A0JC-01 | Breast | breast invasive carcinoma | Female | <65 | I/II | Chemotherapy | fluorouracil | SD |
| TMEM117 | SNV | Missense_Mutation | | c.719C>T | p.Ala240Val | p.A240V | Q9H0C3 | protein_coding | deleterious(0) | benign(0.084) | TCGA-C8-A12V-01 | Breast | breast invasive carcinoma | Female | <65 | I/II | Unknown | Unknown | SD |
| TMEM117 | SNV | Missense_Mutation | rs772555669 | c.1429N>A | p.Val477Ile | p.V477I | Q9H0C3 | protein_coding | tolerated_low_confidence(0.16) | benign(0.003) | TCGA-D8-A1XK-01 | Breast | breast invasive carcinoma | Female | <65 | I/II | Chemotherapy | doxorubicine+cyclophosphamide | SD |
| TMEM117 | deletion | In_Frame_Del | | c.371_397delNNNNNNNNNNNNNNNNNNNNNNNNNNN | p.Ile125_Asp133del | p.I125_D133del | Q9H0C3 | protein_coding | | | TCGA-A8-A08L-01 | Breast | breast invasive carcinoma | Female | >=65 | III/IV | Unknown | Unknown | SD |
| TMEM117 | insertion | In_Frame_Ins | novel | c.1425_1426insGTTTATAAA | p.Glu475_Ile476insValTyrLys | p.E475_I476insVYK | Q9H0C3 | protein_coding | | | TCGA-AR-A0U0-01 | Breast | breast invasive carcinoma | Female | >=65 | I/II | Unknown | Unknown | SD |
| TMEM117 | SNV | Missense_Mutation | novel | c.617N>C | p.Leu206Pro | p.L206P | Q9H0C3 | protein_coding | deleterious(0.02) | probably_damaging(0.98) | TCGA-2W-A8YY-01 | Cervix | cervical & endocervical cancer | Female | <65 | I/II | Chemotherapy | cisplatin | CR |
| TMEM117 | SNV | Missense_Mutation | novel | c.573C>G | p.Phe191Leu | p.F191L | Q9H0C3 | protein_coding | tolerated(0.6) | benign(0.006) | TCGA-JW-A5VL-01 | Cervix | cervical & endocervical cancer | Female | <65 | I/II | Unknown | Unknown | SD |
| TMEM117 | SNV | Missense_Mutation | | c.700A>G | p.Ser234Gly | p.S234G | Q9H0C3 | protein_coding | deleterious(0.01) | probably_damaging(0.953) | TCGA-JX-A3PZ-01 | Cervix | cervical & endocervical cancer | Female | <65 | I/II | Unknown | Unknown | PD |
| TMEM117 | SNV | Missense_Mutation | rs145821678 | c.443N>A | p.Arg148Gln | p.R148Q | Q9H0C3 | protein_coding | tolerated(0.11) | probably_damaging(0.979) | TCGA-AA-3510-01 | Colorectum | colon adenocarcinoma | Male | >=65 | I/II | Unknown | Unknown | SD |


