
|
|||||
|
 | |
| |
| |
| |
| |
| |
|
Gene: TMEM115 |
Gene summary for TMEM115 |
| Gene information | Species | Human | Gene symbol | TMEM115 | Gene ID | 11070 |
| Gene name | transmembrane protein 115 | |
| Gene Alias | PL6 | |
| Cytomap | 3p21.31 | |
| Gene Type | protein-coding | GO ID | GO:0006810 | UniProtAcc | A0A024R2Y2 |
Top |
Malignant transformation analysis |
| Identification of the aberrant gene expression in precancerous and cancerous lesions by comparing the gene expression of stem-like cells in diseased tissues with normal stem cells |
| Entrez ID | Symbol | Replicates | Species | Organ | Tissue | Adj P-value | Log2FC | Malignancy |
| 11070 | TMEM115 | LZE4T | Human | Esophagus | ESCC | 3.54e-02 | 3.19e-02 | 0.0811 |
| 11070 | TMEM115 | LZE7T | Human | Esophagus | ESCC | 3.91e-06 | 1.94e-01 | 0.0667 |
| 11070 | TMEM115 | LZE8T | Human | Esophagus | ESCC | 1.50e-04 | 6.00e-02 | 0.067 |
| 11070 | TMEM115 | LZE24T | Human | Esophagus | ESCC | 2.02e-17 | 4.68e-01 | 0.0596 |
| 11070 | TMEM115 | P2T-E | Human | Esophagus | ESCC | 1.24e-14 | 2.45e-01 | 0.1177 |
| 11070 | TMEM115 | P4T-E | Human | Esophagus | ESCC | 4.71e-17 | 2.80e-01 | 0.1323 |
| 11070 | TMEM115 | P5T-E | Human | Esophagus | ESCC | 1.56e-11 | 4.72e-02 | 0.1327 |
| 11070 | TMEM115 | P8T-E | Human | Esophagus | ESCC | 9.19e-18 | 1.45e-01 | 0.0889 |
| 11070 | TMEM115 | P9T-E | Human | Esophagus | ESCC | 3.19e-11 | 1.98e-01 | 0.1131 |
| 11070 | TMEM115 | P10T-E | Human | Esophagus | ESCC | 3.47e-24 | 2.93e-01 | 0.116 |
| 11070 | TMEM115 | P11T-E | Human | Esophagus | ESCC | 1.21e-12 | 5.55e-01 | 0.1426 |
| 11070 | TMEM115 | P12T-E | Human | Esophagus | ESCC | 7.46e-28 | 4.63e-01 | 0.1122 |
| 11070 | TMEM115 | P15T-E | Human | Esophagus | ESCC | 2.47e-09 | 2.26e-01 | 0.1149 |
| 11070 | TMEM115 | P16T-E | Human | Esophagus | ESCC | 5.12e-13 | 2.81e-01 | 0.1153 |
| 11070 | TMEM115 | P17T-E | Human | Esophagus | ESCC | 1.00e-03 | 2.61e-01 | 0.1278 |
| 11070 | TMEM115 | P19T-E | Human | Esophagus | ESCC | 2.27e-07 | 5.57e-01 | 0.1662 |
| 11070 | TMEM115 | P20T-E | Human | Esophagus | ESCC | 3.64e-20 | 3.78e-01 | 0.1124 |
| 11070 | TMEM115 | P21T-E | Human | Esophagus | ESCC | 1.43e-20 | 3.89e-01 | 0.1617 |
| 11070 | TMEM115 | P22T-E | Human | Esophagus | ESCC | 6.02e-27 | 3.77e-01 | 0.1236 |
| 11070 | TMEM115 | P23T-E | Human | Esophagus | ESCC | 2.98e-29 | 6.37e-01 | 0.108 |
| Page: 1 2 3 4 5 6 |
| Tissue | Expression Dynamics | Abbreviation |
| Esophagus | 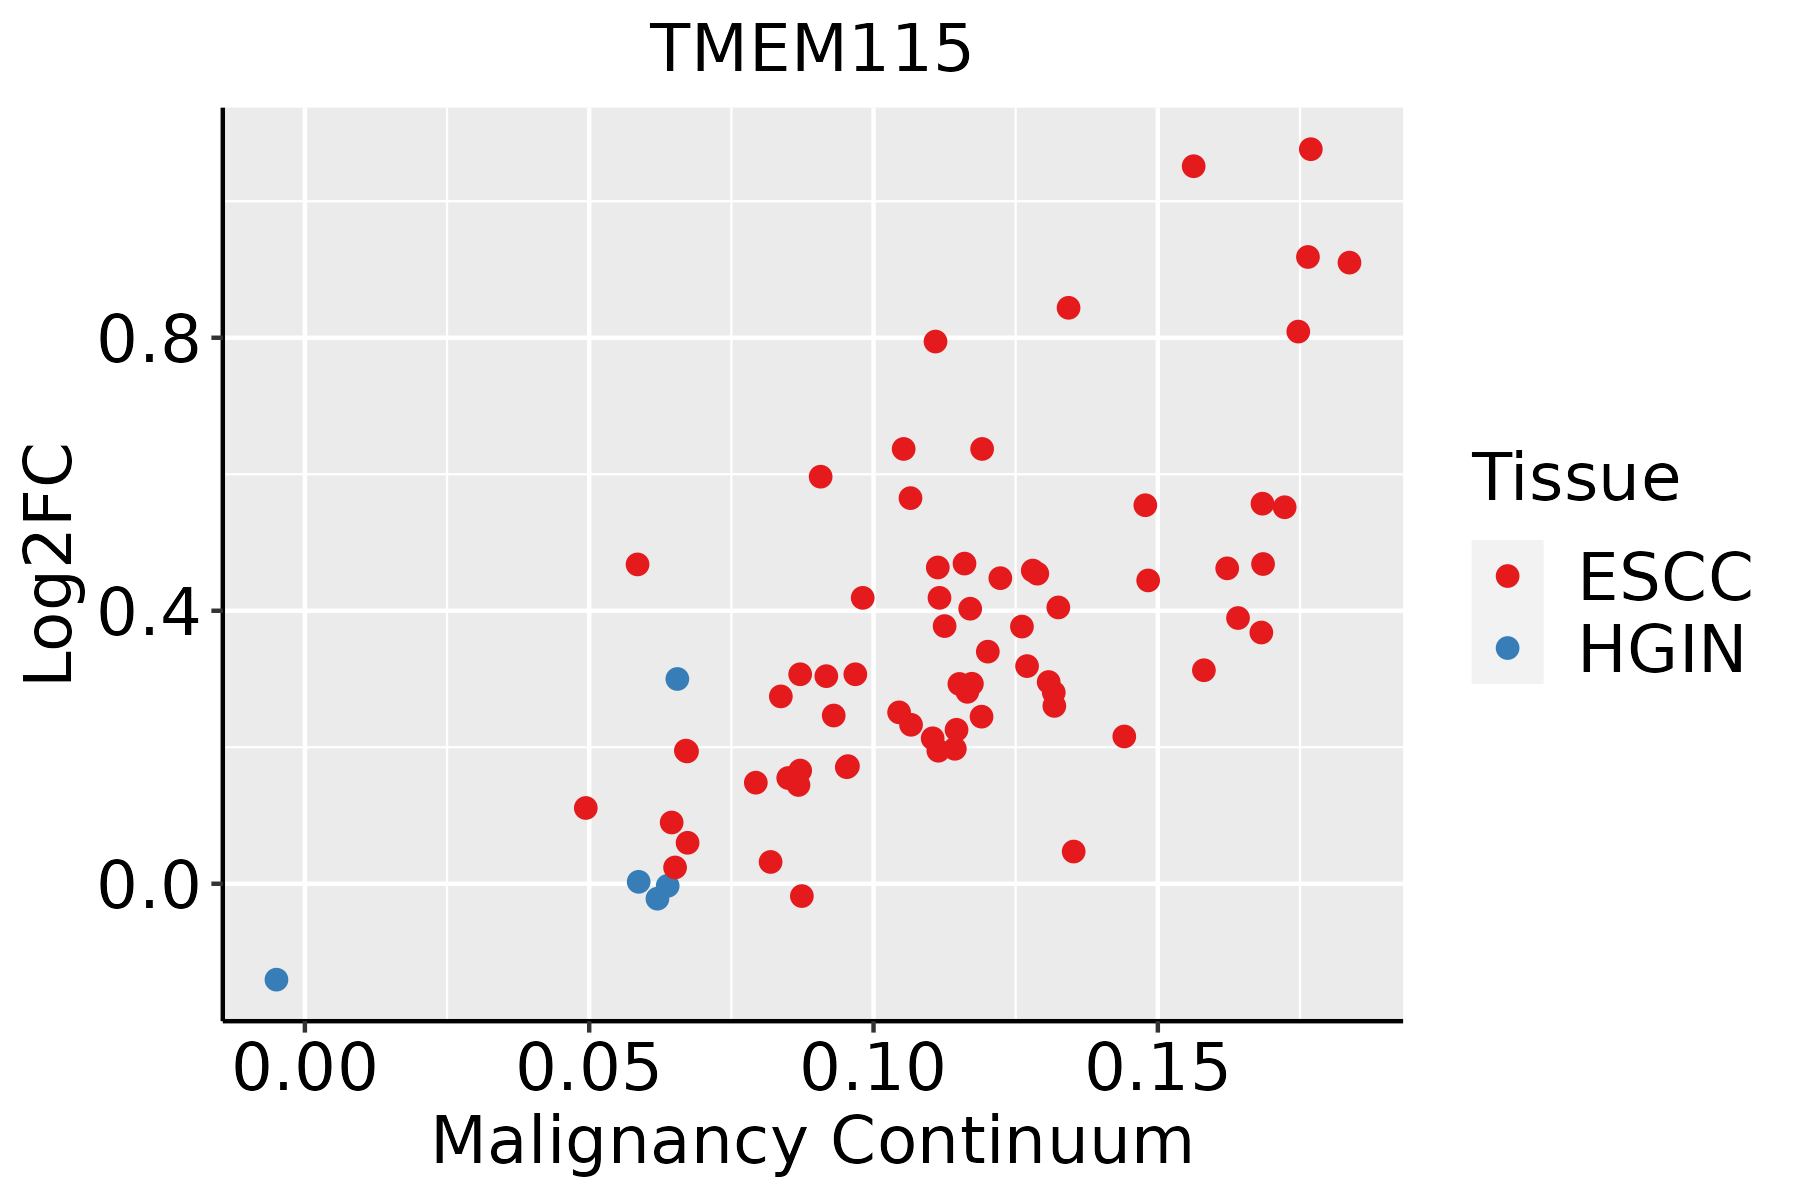 | ESCC: Esophageal squamous cell carcinoma |
| HGIN: High-grade intraepithelial neoplasias | ||
| LGIN: Low-grade intraepithelial neoplasias | ||
| Liver |  | HCC: Hepatocellular carcinoma |
| NAFLD: Non-alcoholic fatty liver disease | ||
| Oral Cavity | 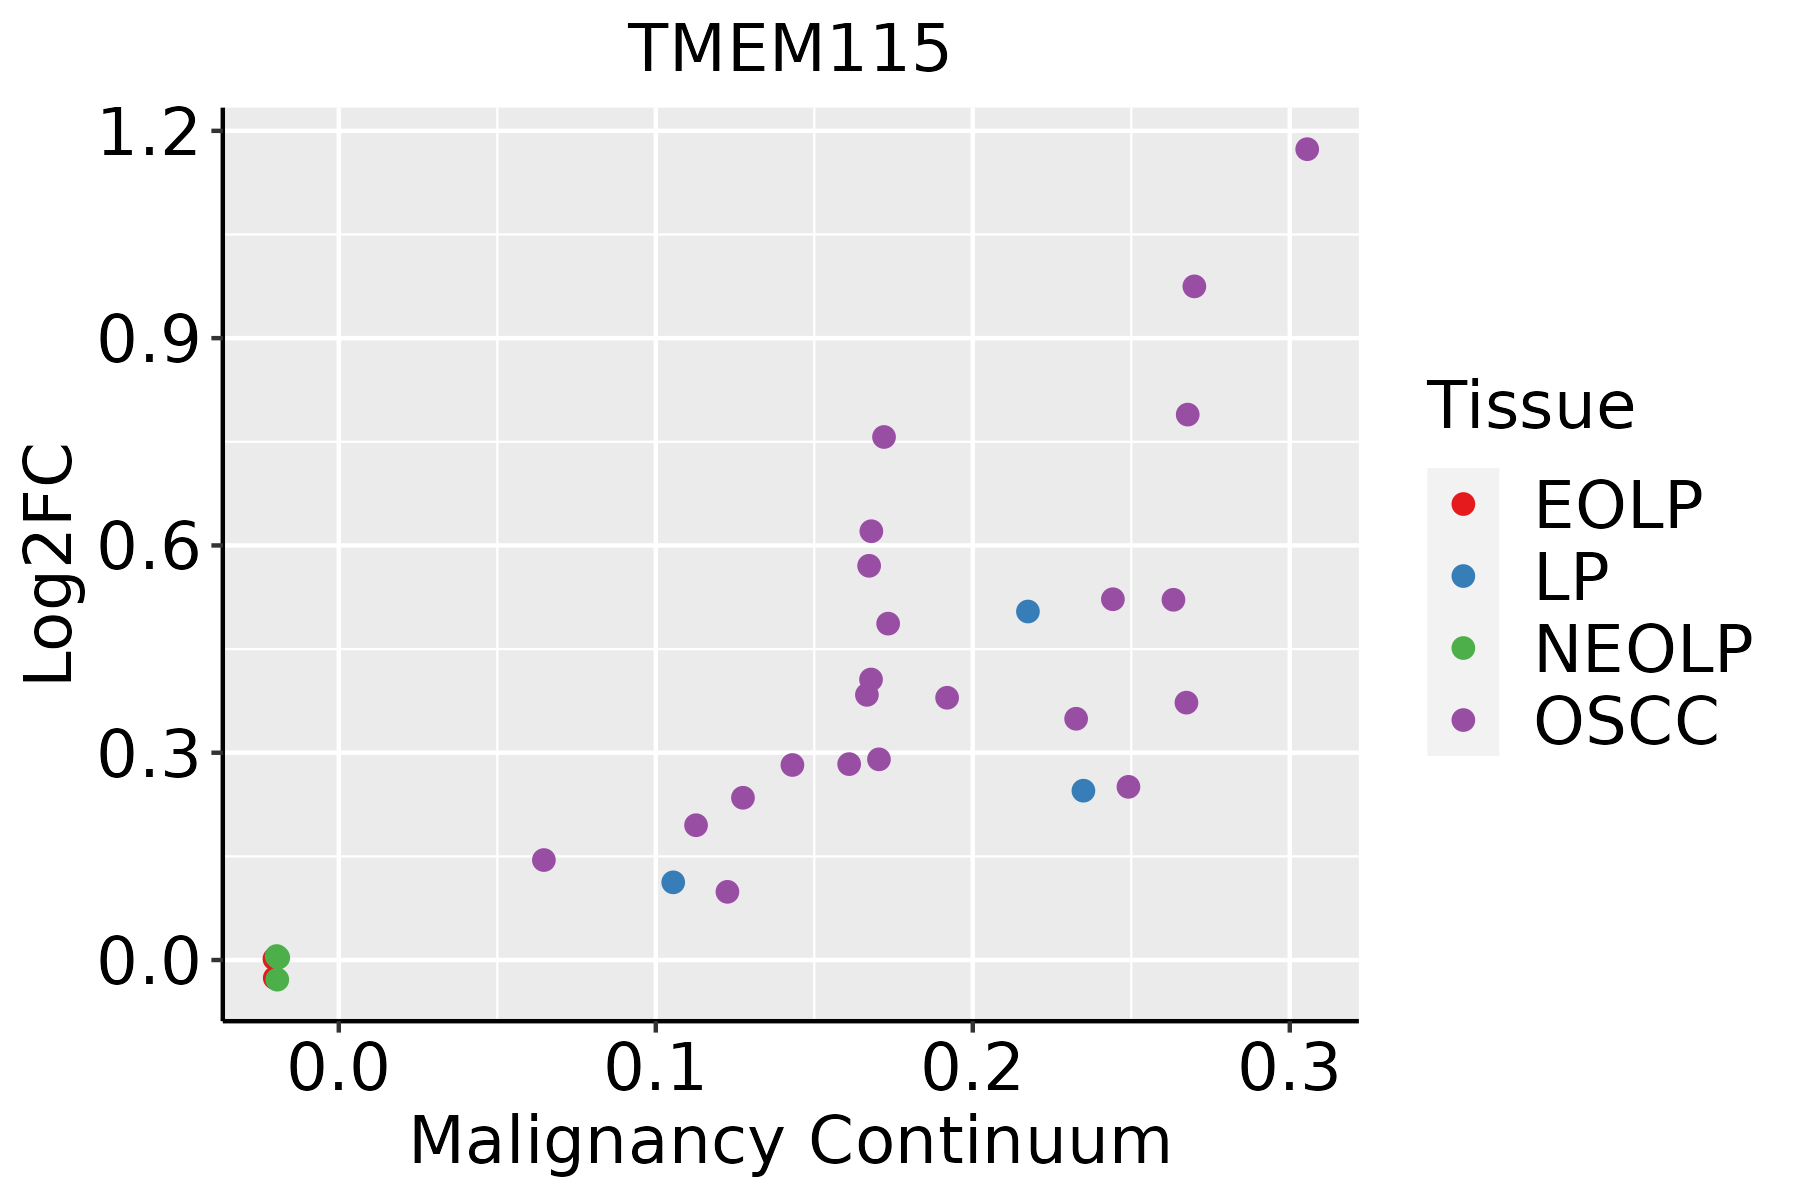 | EOLP: Erosive Oral lichen planus |
| LP: leukoplakia | ||
| NEOLP: Non-erosive oral lichen planus | ||
| OSCC: Oral squamous cell carcinoma | ||
| Skin | 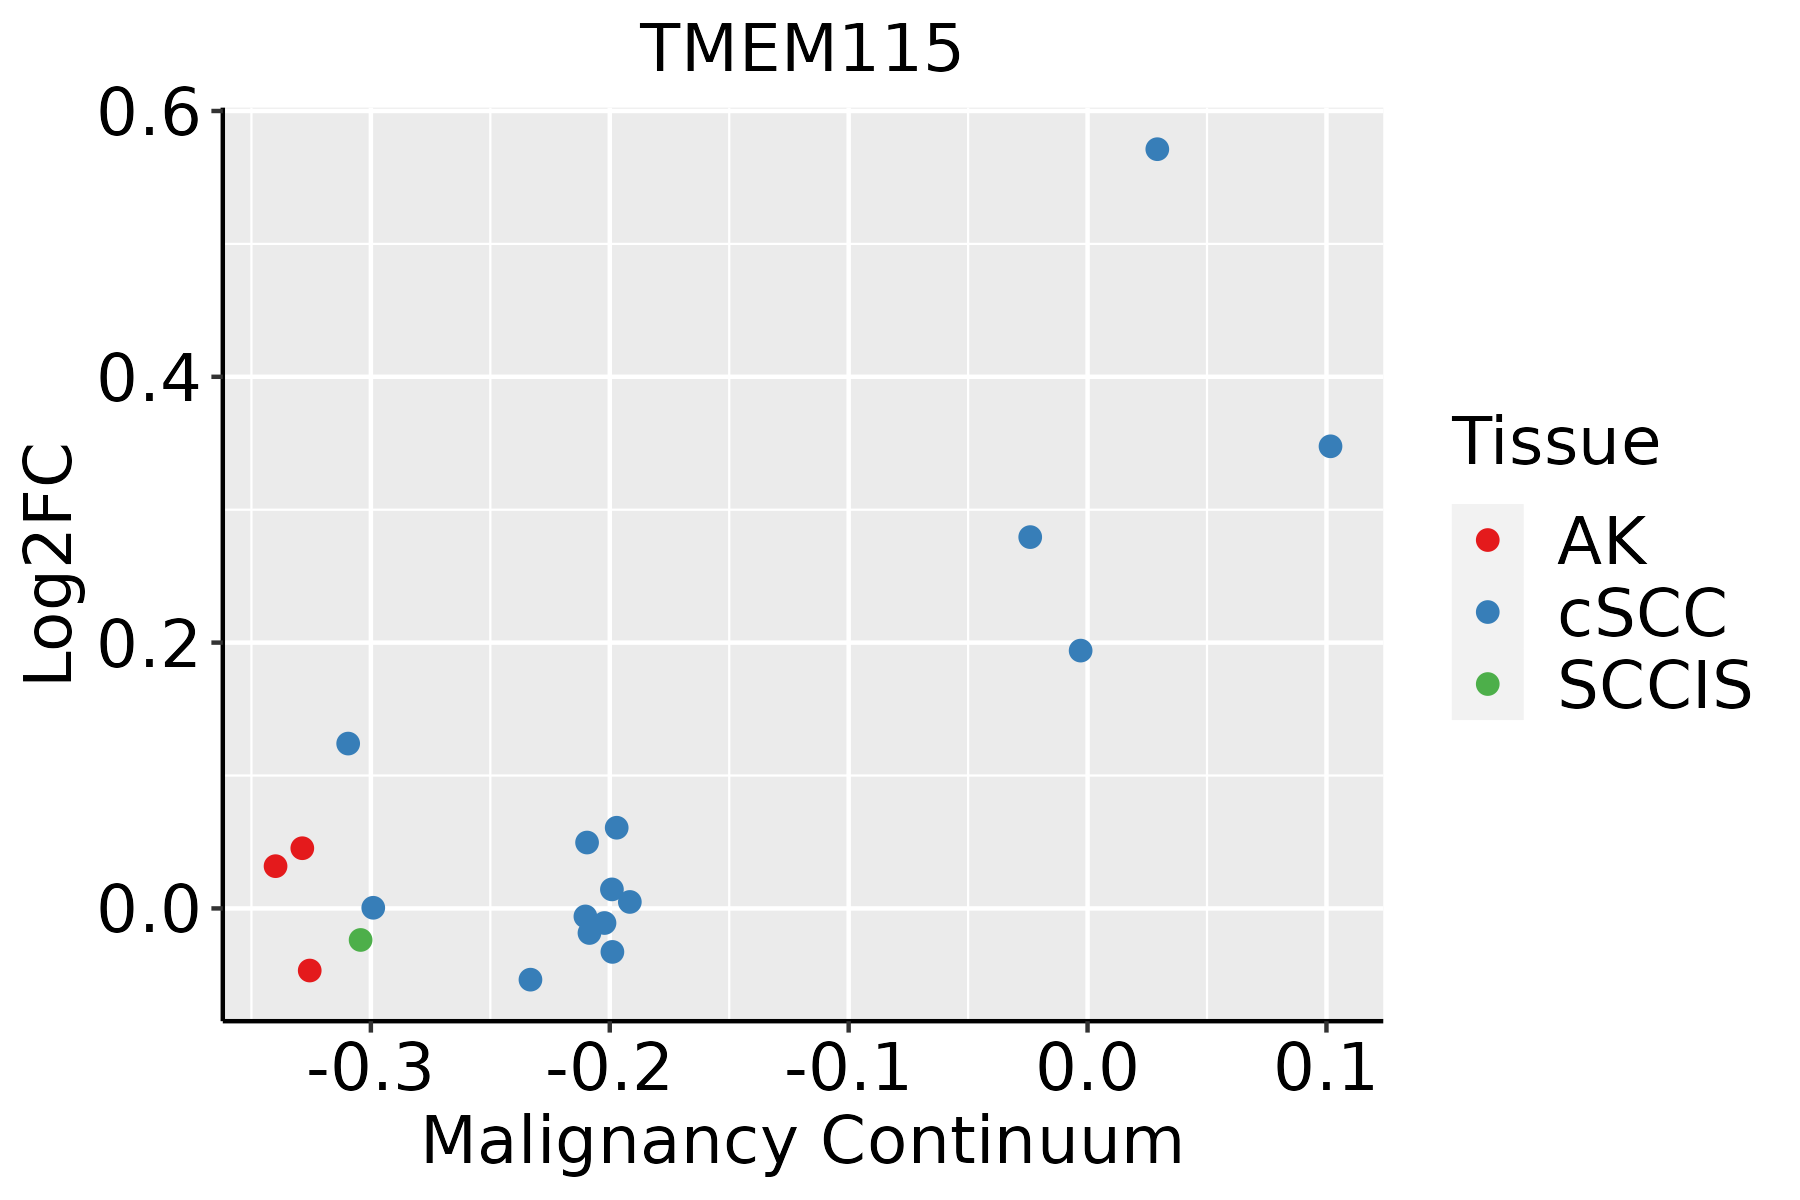 | AK: Actinic keratosis |
| cSCC: Cutaneous squamous cell carcinoma | ||
| SCCIS:squamous cell carcinoma in situ | ||
| Thyroid | 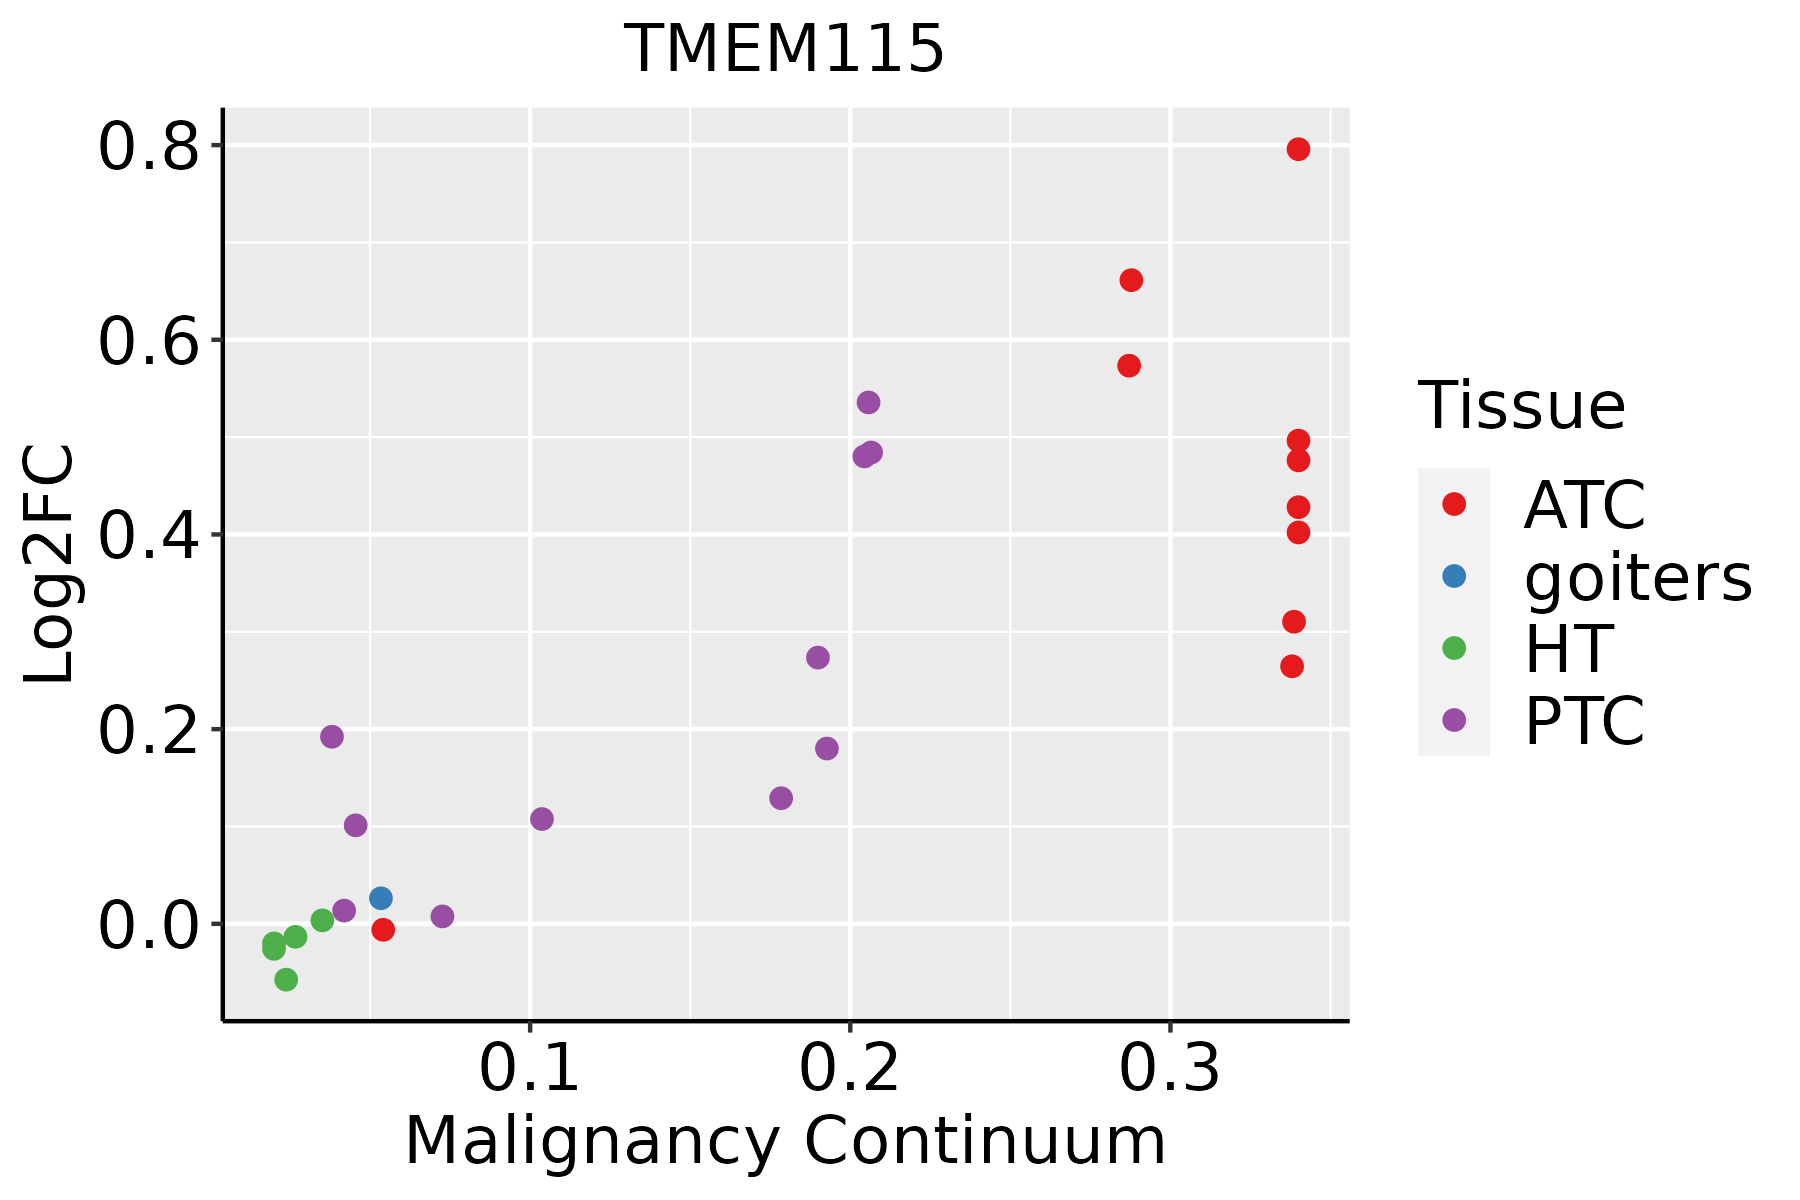 | ATC: Anaplastic thyroid cancer |
| HT: Hashimoto's thyroiditis | ||
| PTC: Papillary thyroid cancer |
| ∗log2FC in expression of this searched gene in stem-like cells from each diseased tissue sample relative to stem-like cells in normal samples in each tissue plotted against the malignancy continuum. Samples are colored based on if they are from different disease stage. |
Top |
Malignant transformation related pathway analysis |
| Find out the enriched GO biological processes and KEGG pathways involved in transition from healthy to precancer to cancer |
| Tissue | Disease Stage | Enriched GO biological Processes |
| Colorectum | AD |  |
| Colorectum | SER |  |
| Colorectum | MSS |  |
| Colorectum | MSI-H |  |
| Colorectum | FAP |  |
| ∗Top 15 enriched GO BP terms are showed in the bar plot of each disease state in each tissue. Each row represents a significant GO biological process which is colored according to the -log10(p.adjust). |
| Page: 1 2 3 4 5 6 7 8 9 |
| GO ID | Tissue | Disease Stage | Description | Gene Ratio | Bg Ratio | pvalue | p.adjust | Count |
| GO:004819318 | Esophagus | ESCC | Golgi vesicle transport | 231/8552 | 296/18723 | 1.82e-30 | 9.63e-28 | 231 |
| GO:000689017 | Esophagus | ESCC | retrograde vesicle-mediated transport, Golgi to endoplasmic reticulum | 46/8552 | 52/18723 | 1.23e-10 | 3.66e-09 | 46 |
| GO:004819311 | Liver | Cirrhotic | Golgi vesicle transport | 153/4634 | 296/18723 | 1.02e-23 | 6.43e-21 | 153 |
| GO:00068905 | Liver | Cirrhotic | retrograde vesicle-mediated transport, Golgi to endoplasmic reticulum | 29/4634 | 52/18723 | 1.69e-06 | 3.22e-05 | 29 |
| GO:004819321 | Liver | HCC | Golgi vesicle transport | 217/7958 | 296/18723 | 2.58e-27 | 1.02e-24 | 217 |
| GO:000689011 | Liver | HCC | retrograde vesicle-mediated transport, Golgi to endoplasmic reticulum | 36/7958 | 52/18723 | 8.79e-05 | 7.66e-04 | 36 |
| GO:004819315 | Oral cavity | OSCC | Golgi vesicle transport | 209/7305 | 296/18723 | 1.39e-28 | 6.30e-26 | 209 |
| GO:000689010 | Oral cavity | OSCC | retrograde vesicle-mediated transport, Golgi to endoplasmic reticulum | 40/7305 | 52/18723 | 2.86e-08 | 5.50e-07 | 40 |
| GO:0048193110 | Skin | cSCC | Golgi vesicle transport | 153/4864 | 296/18723 | 1.85e-21 | 3.41e-19 | 153 |
| GO:000689018 | Skin | cSCC | retrograde vesicle-mediated transport, Golgi to endoplasmic reticulum | 27/4864 | 52/18723 | 5.68e-05 | 5.67e-04 | 27 |
| GO:004819320 | Thyroid | PTC | Golgi vesicle transport | 186/5968 | 296/18723 | 3.09e-28 | 1.22e-25 | 186 |
| GO:000689019 | Thyroid | PTC | retrograde vesicle-mediated transport, Golgi to endoplasmic reticulum | 37/5968 | 52/18723 | 6.98e-09 | 1.75e-07 | 37 |
| GO:0048193111 | Thyroid | ATC | Golgi vesicle transport | 189/6293 | 296/18723 | 9.58e-27 | 5.05e-24 | 189 |
| GO:0006890110 | Thyroid | ATC | retrograde vesicle-mediated transport, Golgi to endoplasmic reticulum | 37/6293 | 52/18723 | 3.45e-08 | 6.43e-07 | 37 |
| Page: 1 |
| Pathway ID | Tissue | Disease Stage | Description | Gene Ratio | Bg Ratio | pvalue | p.adjust | qvalue | Count |
| Page: 1 |
Top |
Cell-cell communication analysis |
| Identification of potential cell-cell interactions between two cell types and their ligand-receptor pairs for different disease states |
| Ligand | Receptor | LRpair | Pathway | Tissue | Disease Stage |
| Page: 1 |
Top |
Single-cell gene regulatory network inference analysis |
| Find out the significant the regulons (TFs) and the target genes of each regulon across cell types for different disease states |
| TF | Cell Type | Tissue | Disease Stage | Target Gene | RSS | Regulon Activity |
| ∗The dot plots of a searched regulon are shown for all cell subpopulations in each disease state of each tissue based on the regulon specific score inferred using pySCENIC and by calculating the average expression. |
| Page: 1 |
Top |
Somatic mutation of malignant transformation related genes |
| Annotation of somatic variants for genes involved in malignant transformation |
| Hugo Symbol | Variant Class | Variant Classification | dbSNP RS | HGVSc | HGVSp | HGVSp Short | SWISSPROT | BIOTYPE | SIFT | PolyPhen | Tumor Sample Barcode | Tissue | Histology | Sex | Age | Stage | Therapy Types | Drugs | Outcome |
| TMEM115 | SNV | Missense_Mutation | rs200775541 | c.1046N>T | p.Pro349Leu | p.P349L | Q12893 | protein_coding | deleterious_low_confidence(0.03) | benign(0.012) | TCGA-E9-A1RH-01 | Breast | breast invasive carcinoma | Female | <65 | I/II | Chemotherapy | 5-fluorouracil | SD |
| TMEM115 | SNV | Missense_Mutation | c.268N>C | p.Glu90Gln | p.E90Q | Q12893 | protein_coding | deleterious(0) | probably_damaging(0.999) | TCGA-C5-A7CH-01 | Cervix | cervical & endocervical cancer | Female | <65 | I/II | Unspecific | SD | ||
| TMEM115 | SNV | Missense_Mutation | c.11N>T | p.Ala4Val | p.A4V | Q12893 | protein_coding | tolerated(0.32) | benign(0.017) | TCGA-JX-A3Q0-01 | Cervix | cervical & endocervical cancer | Female | <65 | III/IV | Unknown | Unknown | SD | |
| TMEM115 | deletion | Frame_Shift_Del | novel | c.694delC | p.Leu232CysfsTer17 | p.L232Cfs*17 | Q12893 | protein_coding | TCGA-EK-A2RK-01 | Cervix | cervical & endocervical cancer | Female | >=65 | I/II | Unknown | Unknown | SD | ||
| TMEM115 | SNV | Missense_Mutation | c.719C>T | p.Ala240Val | p.A240V | Q12893 | protein_coding | deleterious(0.01) | probably_damaging(0.949) | TCGA-CK-6751-01 | Colorectum | colon adenocarcinoma | Female | >=65 | I/II | Unknown | Unknown | SD | |
| TMEM115 | SNV | Missense_Mutation | c.959N>A | p.Ser320Asn | p.S320N | Q12893 | protein_coding | tolerated(0.05) | benign(0.027) | TCGA-G4-6588-01 | Colorectum | colon adenocarcinoma | Female | <65 | I/II | Unknown | Unknown | SD | |
| TMEM115 | deletion | Frame_Shift_Del | c.340delN | p.Ala114ProfsTer29 | p.A114Pfs*29 | Q12893 | protein_coding | TCGA-D5-6540-01 | Colorectum | colon adenocarcinoma | Male | >=65 | I/II | Unknown | Unknown | SD | |||
| TMEM115 | SNV | Missense_Mutation | novel | c.826N>T | p.Asp276Tyr | p.D276Y | Q12893 | protein_coding | deleterious(0) | probably_damaging(0.999) | TCGA-A5-A0G2-01 | Endometrium | uterine corpus endometrioid carcinoma | Female | <65 | III/IV | Unknown | Unknown | SD |
| TMEM115 | SNV | Missense_Mutation | c.1006N>A | p.Ala336Thr | p.A336T | Q12893 | protein_coding | tolerated(0.6) | benign(0) | TCGA-AP-A0LT-01 | Endometrium | uterine corpus endometrioid carcinoma | Female | <65 | I/II | Unknown | Unknown | SD | |
| TMEM115 | SNV | Missense_Mutation | novel | c.127G>T | p.Gly43Cys | p.G43C | Q12893 | protein_coding | tolerated(0.11) | benign(0.019) | TCGA-AP-A1DK-01 | Endometrium | uterine corpus endometrioid carcinoma | Female | <65 | I/II | Unknown | Unknown | SD |
| Page: 1 2 3 |
Top |
Related drugs of malignant transformation related genes |
| Identification of chemicals and drugs interact with genes involved in malignant transfromation |
| (DGIdb 4.0) |
| Entrez ID | Symbol | Category | Interaction Types | Drug Claim Name | Drug Name | PMIDs |
| Page: 1 |

Copyright 2023-Present -The University of Texas Health Science Center at Houston |