Schematic overview of the cellular and molecular mechanisms involved in the cancer progression, including the proposed cellular and molecular mechanisms in cancer cells trajectory. AT1: alveolar type 1 cells; AT2: alveolar type 2 cells; AAH: atypical adenomatous hyperplasia; AIS: adenocarcinoma in situ; MIA: minimally invasive adenocarcinoma; IA: invasive adenocarcinoma; EMT: epithelial-mesenchymal transition

Home

Download

Statistics

Help

Contact

Center for Computational Systems Medicine
leaf

Gene summary

leaf

Malignant transformation analysis

leaf

Malignant transformation related pathway analysis

leaf

Cell-cell communication analysis

leaf

Single-cell gene regulatory network inference analysis

leaf

Somatic mutation of malignant transformation related genes

leaf

Related drugs of malignant transformation related genes

Gene: TMEM11

Gene summary for TMEM11

check button Gene summary.

Gene informationSpeciesHuman
Gene symbol

TMEM11

Gene ID

8834

Gene nametransmembrane protein 11
Gene AliasC17orf35
Cytomap17p11.2
Gene Typeprotein-coding
GO ID

GO:0006996

UniProtAcc

P17152


Top

Malignant transformation analysis

check button Identification of the aberrant gene expression in precancerous and cancerous lesions by comparing the gene expression of stem-like cells in diseased tissues with normal stem cells
check button Malignant transformation involving gene list.
Entrez IDSymbolReplicatesSpeciesOrganTissueAdj P-valueLog2FCMalignancy
8834TMEM11LZE4THumanEsophagusESCC5.79e-094.71e-010.0811
8834TMEM11LZE7THumanEsophagusESCC2.77e-106.55e-010.0667
8834TMEM11LZE8THumanEsophagusESCC5.20e-072.10e-010.067
8834TMEM11LZE20THumanEsophagusESCC1.61e-071.85e-010.0662
8834TMEM11LZE22THumanEsophagusESCC5.01e-044.41e-010.068
8834TMEM11LZE24THumanEsophagusESCC7.06e-237.44e-010.0596
8834TMEM11LZE21THumanEsophagusESCC3.24e-032.41e-010.0655
8834TMEM11LZE6THumanEsophagusESCC3.29e-044.00e-010.0845
8834TMEM11P1T-EHumanEsophagusESCC5.54e-115.44e-010.0875
8834TMEM11P2T-EHumanEsophagusESCC1.25e-316.35e-010.1177
8834TMEM11P4T-EHumanEsophagusESCC7.67e-391.10e+000.1323
8834TMEM11P5T-EHumanEsophagusESCC5.73e-233.76e-010.1327
8834TMEM11P8T-EHumanEsophagusESCC6.07e-378.12e-010.0889
8834TMEM11P9T-EHumanEsophagusESCC6.56e-244.89e-010.1131
8834TMEM11P10T-EHumanEsophagusESCC8.72e-305.41e-010.116
8834TMEM11P11T-EHumanEsophagusESCC5.55e-208.67e-010.1426
8834TMEM11P12T-EHumanEsophagusESCC7.49e-336.47e-010.1122
8834TMEM11P15T-EHumanEsophagusESCC2.05e-243.68e-010.1149
8834TMEM11P16T-EHumanEsophagusESCC1.42e-377.39e-010.1153
8834TMEM11P17T-EHumanEsophagusESCC5.76e-135.25e-010.1278
Page: 1 2 3 4 5 6 

check button Transcriptomic changes along malignancy continuum.
TissueExpression DynamicsAbbreviation
EsophagusThe image shows the transcriptomic changes along malignancy continuum.log2FC in expression of this searched gene in stem-like cells from each diseased tissue sample relative to stem-like cells in normal samples in each tissue plotted against the malignancy continuum. Samples are colored based on if they are from different disease stage.
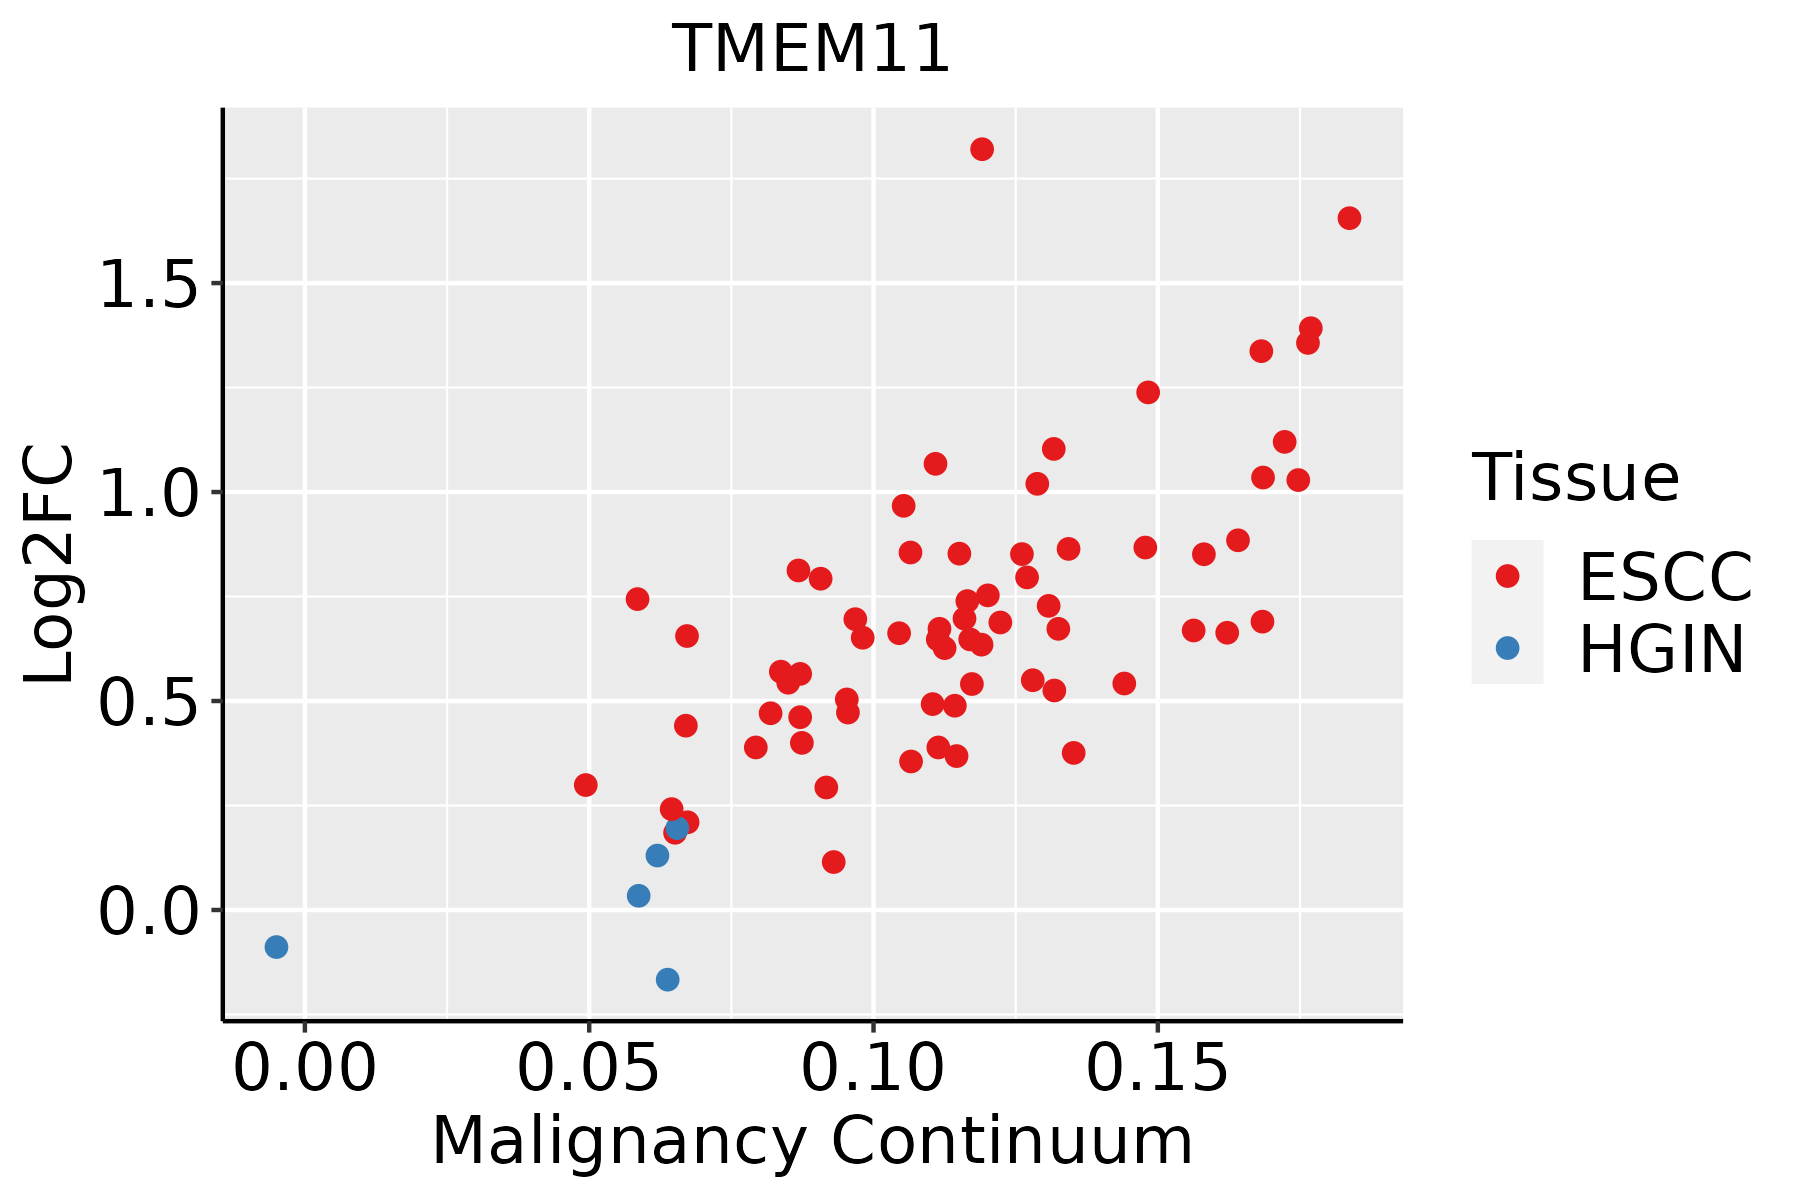
ESCC: Esophageal squamous cell carcinoma
HGIN: High-grade intraepithelial neoplasias
LGIN: Low-grade intraepithelial neoplasias
LiverThe image shows the transcriptomic changes along malignancy continuum.log2FC in expression of this searched gene in stem-like cells from each diseased tissue sample relative to stem-like cells in normal samples in each tissue plotted against the malignancy continuum. Samples are colored based on if they are from different disease stage.HCC: Hepatocellular carcinoma
NAFLD: Non-alcoholic fatty liver disease
Oral CavityThe image shows the transcriptomic changes along malignancy continuum.log2FC in expression of this searched gene in stem-like cells from each diseased tissue sample relative to stem-like cells in normal samples in each tissue plotted against the malignancy continuum. Samples are colored based on if they are from different disease stage.
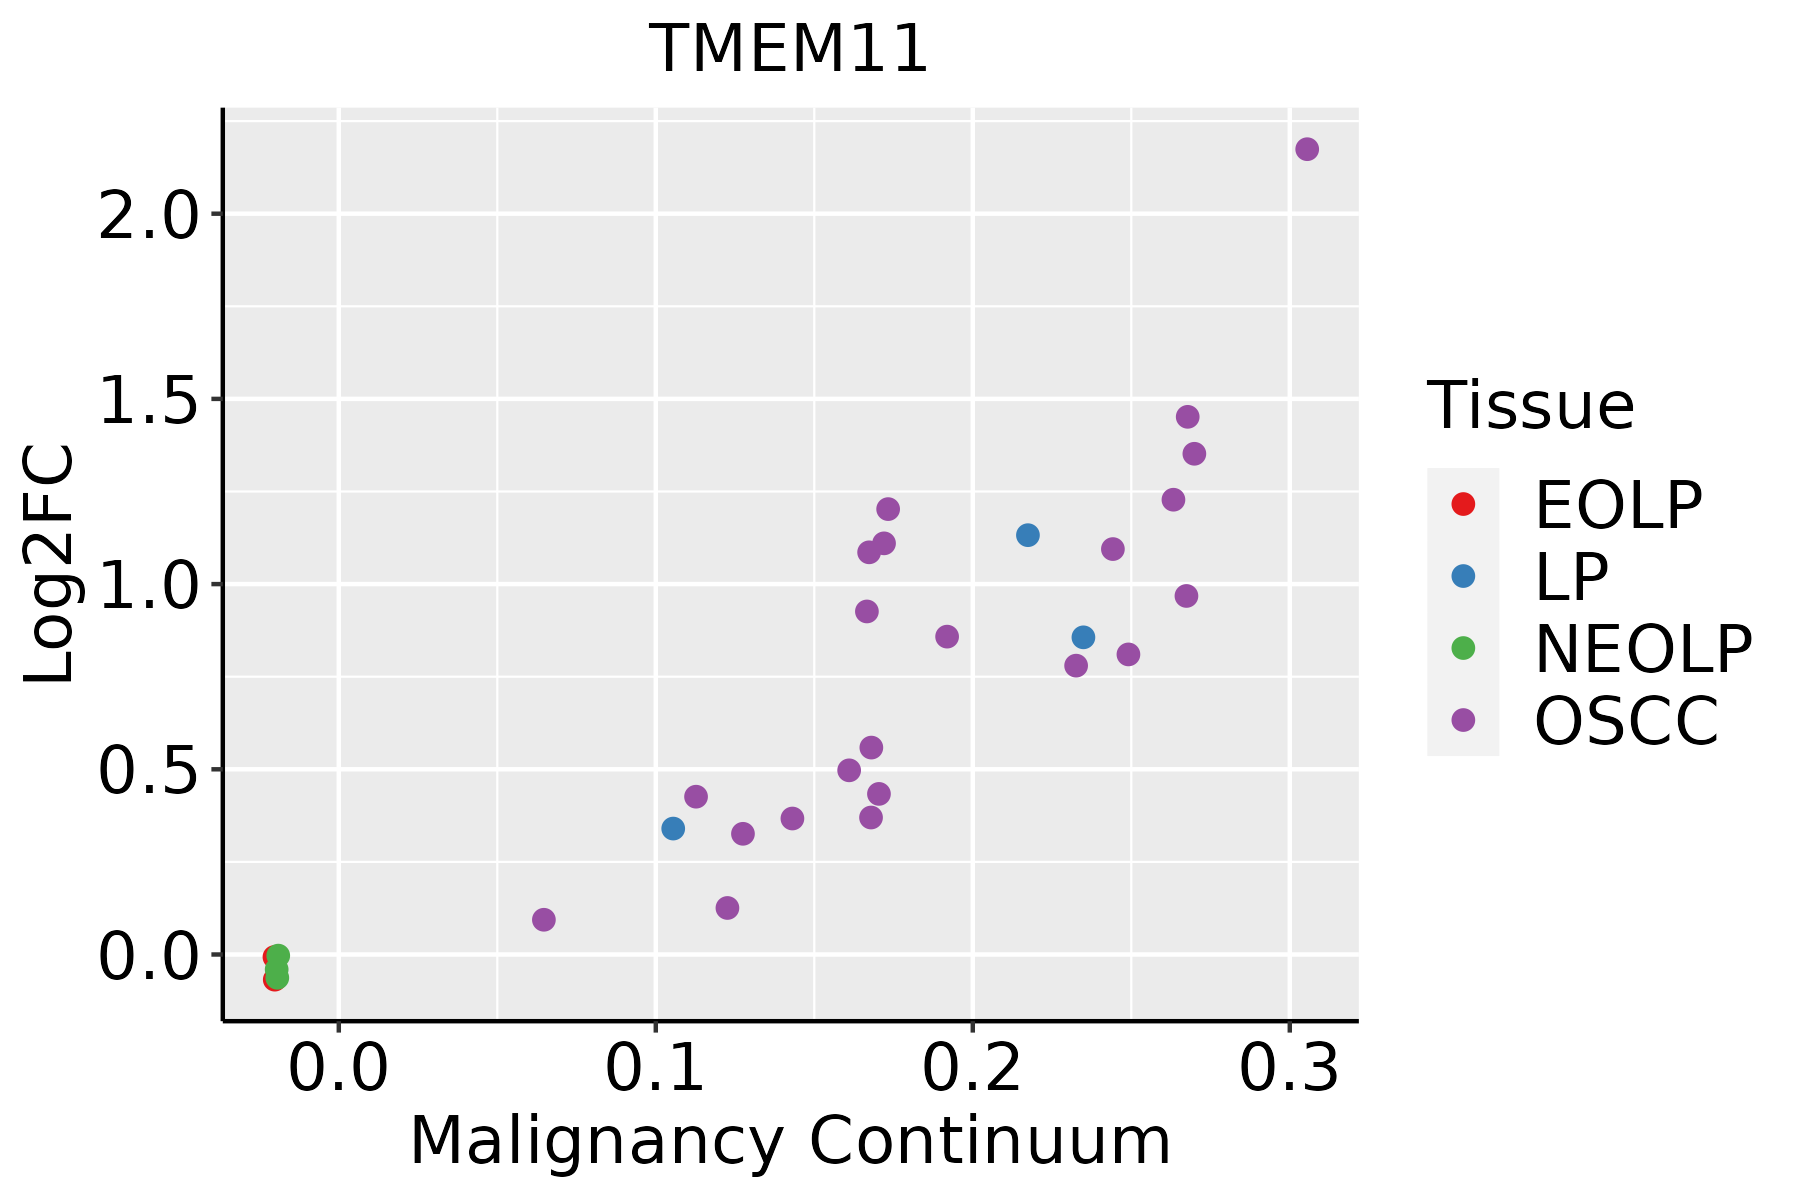
EOLP: Erosive Oral lichen planus
LP: leukoplakia
NEOLP: Non-erosive oral lichen planus
OSCC: Oral squamous cell carcinoma
SkinThe image shows the transcriptomic changes along malignancy continuum.log2FC in expression of this searched gene in stem-like cells from each diseased tissue sample relative to stem-like cells in normal samples in each tissue plotted against the malignancy continuum. Samples are colored based on if they are from different disease stage.
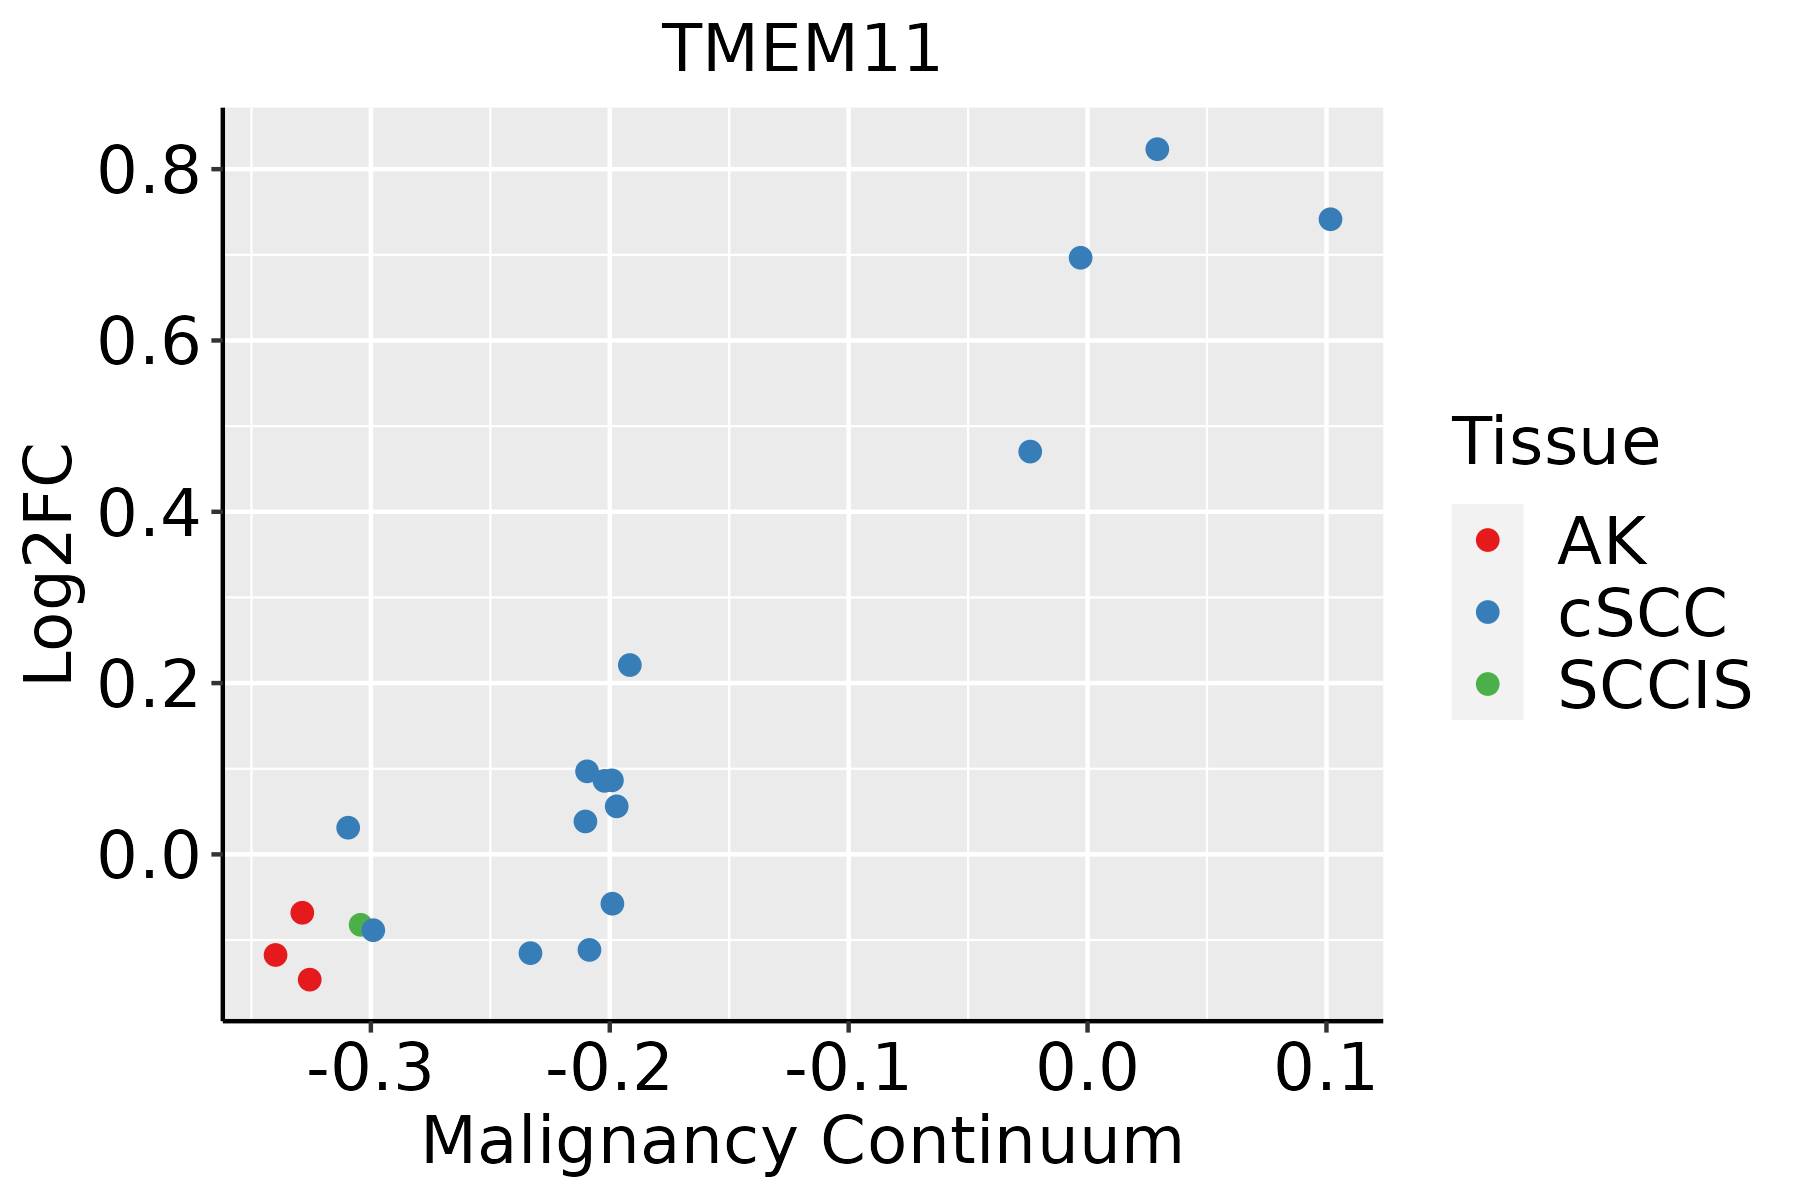
AK: Actinic keratosis
cSCC: Cutaneous squamous cell carcinoma
SCCIS:squamous cell carcinoma in situ
ThyroidThe image shows the transcriptomic changes along malignancy continuum.log2FC in expression of this searched gene in stem-like cells from each diseased tissue sample relative to stem-like cells in normal samples in each tissue plotted against the malignancy continuum. Samples are colored based on if they are from different disease stage.
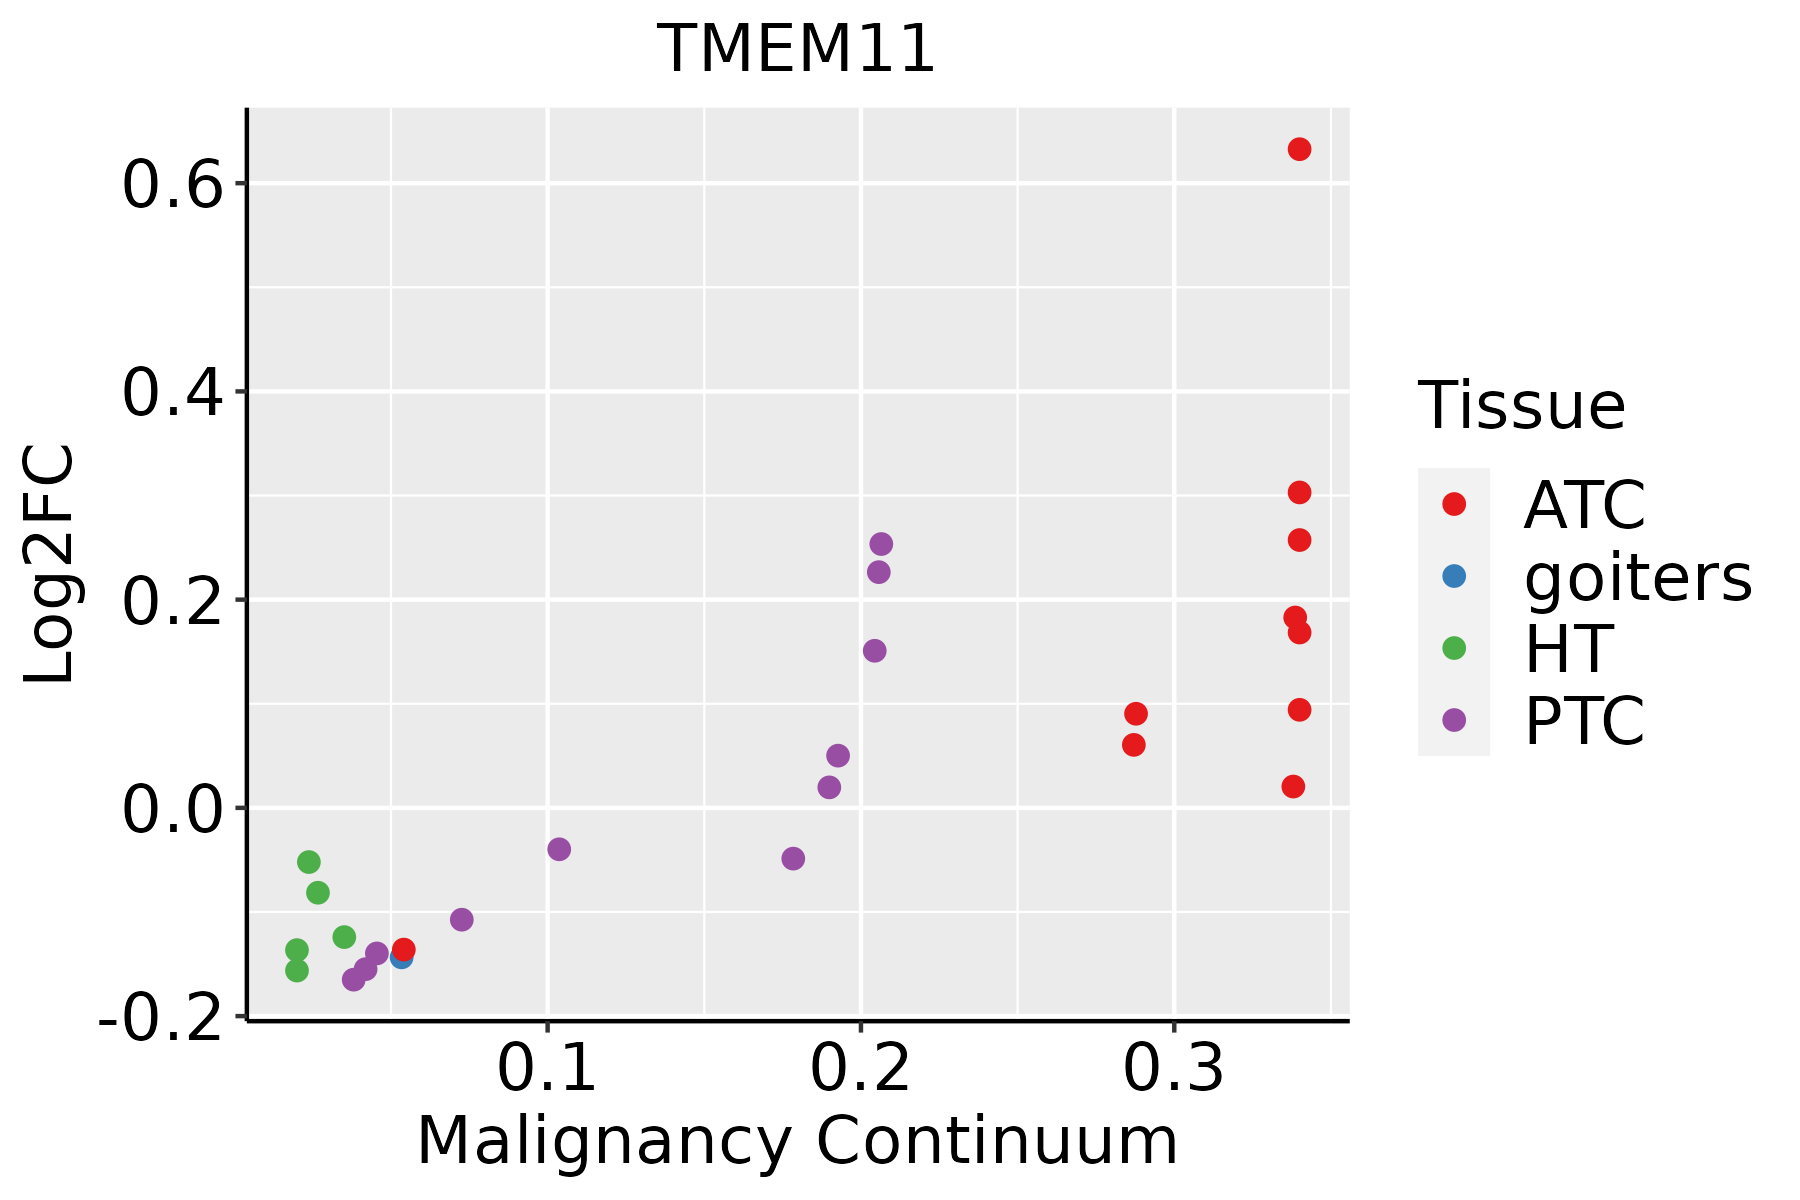
ATC: Anaplastic thyroid cancer
HT: Hashimoto's thyroiditis
PTC: Papillary thyroid cancer
∗log2FC in expression of this searched gene in stem-like cells from each diseased tissue sample relative to stem-like cells in normal samples in each tissue plotted against the malignancy continuum. Samples are colored based on if they are from different disease stage.

Top

Malignant transformation related pathway analysis

check buttonFind out the enriched GO biological processes and KEGG pathways involved in transition from healthy to precancer to cancer
check button Figure of enriched GO biological processes.
TissueDisease StageEnriched GO biological Processes
ColorectumADGO analysis - Figure of enriched GO biological processes: Top 15 enriched GO BP terms are showed in the bar plot of each disease state in each tissue. Each row represents a significant GO biological process which is colored according to the -log10(p.adjust).
ColorectumSERGO analysis - Figure of enriched GO biological processes: Top 15 enriched GO BP terms are showed in the bar plot of each disease state in each tissue. Each row represents a significant GO biological process which is colored according to the -log10(p.adjust).
ColorectumMSSGO analysis - Figure of enriched GO biological processes: Top 15 enriched GO BP terms are showed in the bar plot of each disease state in each tissue. Each row represents a significant GO biological process which is colored according to the -log10(p.adjust).
ColorectumMSI-HGO analysis - Figure of enriched GO biological processes: Top 15 enriched GO BP terms are showed in the bar plot of each disease state in each tissue. Each row represents a significant GO biological process which is colored according to the -log10(p.adjust).
ColorectumFAPGO analysis - Figure of enriched GO biological processes: Top 15 enriched GO BP terms are showed in the bar plot of each disease state in each tissue. Each row represents a significant GO biological process which is colored according to the -log10(p.adjust).
∗Top 15 enriched GO BP terms are showed in the bar plot of each disease state in each tissue. Each row represents a significant GO biological process which is colored according to the -log10(p.adjust).
Page: 1 2 3 4 5 6 7 8 9 

check button Enriched GO biological processes.
GO IDTissueDisease StageDescriptionGene RatioBg Ratiopvaluep.adjustCount
GO:009719310CervixCCintrinsic apoptotic signaling pathway85/2311288/187234.56e-156.46e-1285
GO:003497610CervixCCresponse to endoplasmic reticulum stress57/2311256/187235.81e-061.42e-0457
GO:00700599CervixCCintrinsic apoptotic signaling pathway in response to endoplasmic reticulum stress21/231163/187231.18e-052.51e-0421
GO:0097193ColorectumADintrinsic apoptotic signaling pathway108/3918288/187236.25e-116.41e-09108
GO:0034976ColorectumADresponse to endoplasmic reticulum stress90/3918256/187238.48e-084.28e-0690
GO:0070059ColorectumADintrinsic apoptotic signaling pathway in response to endoplasmic reticulum stress29/391863/187237.03e-061.73e-0429
GO:00971931ColorectumSERintrinsic apoptotic signaling pathway87/2897288/187231.67e-102.32e-0887
GO:00349761ColorectumSERresponse to endoplasmic reticulum stress74/2897256/187233.01e-082.05e-0674
GO:00700591ColorectumSERintrinsic apoptotic signaling pathway in response to endoplasmic reticulum stress25/289763/187232.92e-061.18e-0425
GO:00971932ColorectumMSSintrinsic apoptotic signaling pathway102/3467288/187236.06e-129.82e-10102
GO:00349762ColorectumMSSresponse to endoplasmic reticulum stress81/3467256/187232.65e-071.10e-0581
GO:00700592ColorectumMSSintrinsic apoptotic signaling pathway in response to endoplasmic reticulum stress27/346763/187236.93e-061.79e-0427
GO:00349764ColorectumFAPresponse to endoplasmic reticulum stress61/2622256/187231.58e-054.10e-0461
GO:00971934ColorectumFAPintrinsic apoptotic signaling pathway66/2622288/187232.76e-056.33e-0466
GO:00700593ColorectumFAPintrinsic apoptotic signaling pathway in response to endoplasmic reticulum stress18/262263/187231.95e-031.65e-0218
GO:00971935ColorectumCRCintrinsic apoptotic signaling pathway57/2078288/187239.77e-063.31e-0457
GO:009719316EndometriumAEHintrinsic apoptotic signaling pathway75/2100288/187231.46e-122.83e-1075
GO:003497616EndometriumAEHresponse to endoplasmic reticulum stress62/2100256/187232.88e-092.13e-0762
GO:007005910EndometriumAEHintrinsic apoptotic signaling pathway in response to endoplasmic reticulum stress18/210063/187231.32e-041.80e-0318
GO:009719317EndometriumEECintrinsic apoptotic signaling pathway80/2168288/187233.35e-149.13e-1280
Page: 1 2 3 4 5 

check button Enriched KEGG pathways.
Pathway IDTissueDisease StageDescriptionGene RatioBg Ratiopvaluep.adjustqvalueCount
Page: 1 

Top

Cell-cell communication analysis

check buttonIdentification of potential cell-cell interactions between two cell types and their ligand-receptor pairs for different disease states
LigandReceptorLRpairPathwayTissueDisease Stage
Page: 1 

Top

Single-cell gene regulatory network inference analysis

check buttonFind out the significant the regulons (TFs) and the target genes of each regulon across cell types for different disease states
TFCell TypeTissueDisease StageTarget GeneRSSRegulon Activity
∗The dot plots of a searched regulon are shown for all cell subpopulations in each disease state of each tissue based on the regulon specific score inferred using pySCENIC and by calculating the average expression.
Page: 1 

Top

Somatic mutation of malignant transformation related genes

check buttonAnnotation of somatic variants for genes involved in malignant transformation
Hugo SymbolVariant ClassVariant ClassificationdbSNP RSHGVScHGVSpHGVSp ShortSWISSPROTBIOTYPESIFTPolyPhenTumor Sample BarcodeTissueHistologySexAgeStageTherapy TypesDrugsOutcome
TMEM11insertionFrame_Shift_Insnovelc.105_106insACAAGAGACAACAGAGp.Tyr36ThrfsTer16p.Y36Tfs*16P17152protein_codingTCGA-A2-A0D4-01Breastbreast invasive carcinomaFemale<65I/IIChemotherapyadriamycinSD
TMEM11SNVMissense_Mutationrs775552645c.562N>Ap.Glu188Lysp.E188KP17152protein_codingtolerated(0.09)benign(0.009)TCGA-AA-A00N-01Colorectumcolon adenocarcinomaMale>=65I/IIUnknownUnknownPD
TMEM11SNVMissense_Mutationrs775552645c.562N>Ap.Glu188Lysp.E188KP17152protein_codingtolerated(0.09)benign(0.009)TCGA-AG-A002-01Colorectumrectum adenocarcinomaMale<65I/IIUnknownUnknownSD
TMEM11SNVMissense_Mutationc.433N>Tp.Arg145Cysp.R145CP17152protein_codingdeleterious(0)possibly_damaging(0.712)TCGA-F5-6814-01Colorectumrectum adenocarcinomaMale<65I/IIUnknownUnknownSD
TMEM11SNVMissense_Mutationnovelc.102N>Tp.Glu34Aspp.E34DP17152protein_codingdeleterious(0.01)benign(0.162)TCGA-A5-A0G2-01Endometriumuterine corpus endometrioid carcinomaFemale<65III/IVUnknownUnknownSD
TMEM11SNVMissense_Mutationnovelc.217C>Tp.Arg73Cysp.R73CP17152protein_codingdeleterious(0)benign(0.226)TCGA-AJ-A3OJ-01Endometriumuterine corpus endometrioid carcinomaFemale<65I/IIChemotherapycarboplatinCR
TMEM11SNVMissense_Mutationrs775552645c.562N>Ap.Glu188Lysp.E188KP17152protein_codingtolerated(0.09)benign(0.009)TCGA-AX-A05Z-01Endometriumuterine corpus endometrioid carcinomaFemale<65III/IVChemotherapyadriamycinSD
TMEM11SNVMissense_Mutationrs541612728c.574G>Ap.Val192Ilep.V192IP17152protein_codingtolerated_low_confidence(0.08)possibly_damaging(0.899)TCGA-AX-A06F-01Endometriumuterine corpus endometrioid carcinomaFemale<65III/IVChemotherapycarboplatinSD
TMEM11SNVMissense_Mutationc.433N>Tp.Arg145Cysp.R145CP17152protein_codingdeleterious(0)possibly_damaging(0.712)TCGA-AX-A0J1-01Endometriumuterine corpus endometrioid carcinomaFemale>=65I/IIUnknownUnknownSD
TMEM11SNVMissense_Mutationrs527761394c.532N>Ap.Ala178Thrp.A178TP17152protein_codingdeleterious(0.03)benign(0.258)TCGA-B5-A11E-01Endometriumuterine corpus endometrioid carcinomaFemale<65I/IIUnknownUnknownSD
Page: 1 2 3 

Top

Related drugs of malignant transformation related genes

check buttonIdentification of chemicals and drugs interact with genes involved in malignant transfromation
(DGIdb 4.0)
Entrez IDSymbolCategoryInteraction TypesDrug Claim NameDrug NamePMIDs
Page: 1