
|
|||||
|
 | |
| |
| |
| |
| |
| |
|
Gene: TMEM108 |
Gene summary for TMEM108 |
| Gene information | Species | Human | Gene symbol | TMEM108 | Gene ID | 66000 |
| Gene name | transmembrane protein 108 | |
| Gene Alias | CT124 | |
| Cytomap | 3q22.1 | |
| Gene Type | protein-coding | GO ID | GO:0000902 | UniProtAcc | Q6UXF1 |
Top |
Malignant transformation analysis |
| Identification of the aberrant gene expression in precancerous and cancerous lesions by comparing the gene expression of stem-like cells in diseased tissues with normal stem cells |
| Entrez ID | Symbol | Replicates | Species | Organ | Tissue | Adj P-value | Log2FC | Malignancy |
| 66000 | TMEM108 | P2T-E | Human | Esophagus | ESCC | 1.06e-50 | 9.61e-01 | 0.1177 |
| 66000 | TMEM108 | P10T-E | Human | Esophagus | ESCC | 3.75e-03 | 7.77e-02 | 0.116 |
| 66000 | TMEM108 | P16T-E | Human | Esophagus | ESCC | 1.61e-32 | 6.23e-01 | 0.1153 |
| 66000 | TMEM108 | P54T-E | Human | Esophagus | ESCC | 7.62e-03 | 8.95e-02 | 0.0975 |
| 66000 | TMEM108 | P56T-E | Human | Esophagus | ESCC | 5.84e-10 | 2.16e+00 | 0.1613 |
| 66000 | TMEM108 | P76T-E | Human | Esophagus | ESCC | 2.72e-30 | 6.76e-01 | 0.1207 |
| 66000 | TMEM108 | P80T-E | Human | Esophagus | ESCC | 1.20e-05 | 1.63e-01 | 0.155 |
| 66000 | TMEM108 | P107T-E | Human | Esophagus | ESCC | 4.67e-06 | 1.57e-01 | 0.171 |
| 66000 | TMEM108 | P128T-E | Human | Esophagus | ESCC | 3.30e-05 | 1.69e-01 | 0.1241 |
| 66000 | TMEM108 | RNA-P25T1-P25T1-1 | Human | Lung | AIS | 5.23e-06 | 5.36e-01 | -0.2116 |
| 66000 | TMEM108 | RNA-P25T1-P25T1-4 | Human | Lung | AIS | 2.87e-06 | 5.05e-01 | -0.2119 |
| Page: 1 |
| Tissue | Expression Dynamics | Abbreviation |
| Esophagus | 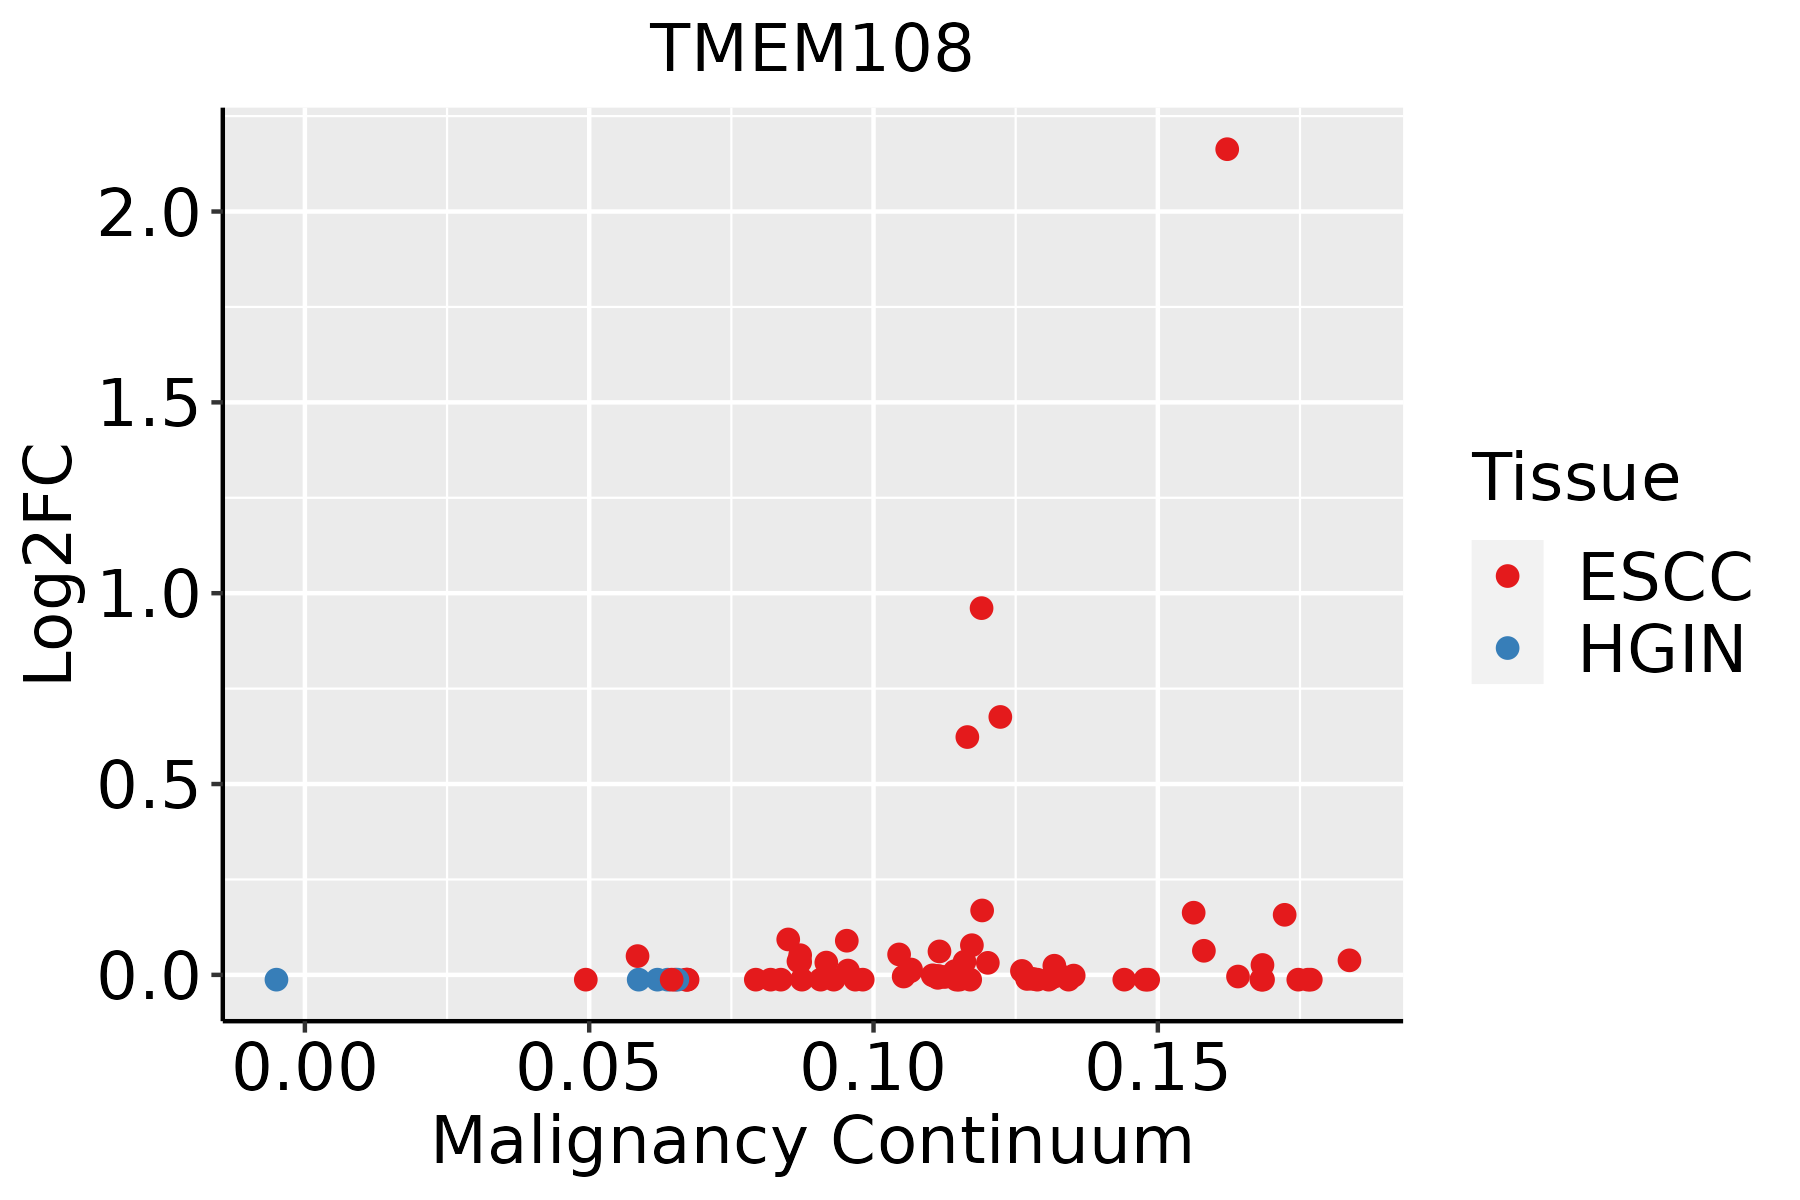 | ESCC: Esophageal squamous cell carcinoma |
| HGIN: High-grade intraepithelial neoplasias | ||
| LGIN: Low-grade intraepithelial neoplasias | ||
| Lung |  | AAH: Atypical adenomatous hyperplasia |
| AIS: Adenocarcinoma in situ | ||
| IAC: Invasive lung adenocarcinoma | ||
| MIA: Minimally invasive adenocarcinoma |
| ∗log2FC in expression of this searched gene in stem-like cells from each diseased tissue sample relative to stem-like cells in normal samples in each tissue plotted against the malignancy continuum. Samples are colored based on if they are from different disease stage. |
Top |
Malignant transformation related pathway analysis |
| Find out the enriched GO biological processes and KEGG pathways involved in transition from healthy to precancer to cancer |
| Tissue | Disease Stage | Enriched GO biological Processes |
| Colorectum | AD |  |
| Colorectum | SER |  |
| Colorectum | MSS |  |
| Colorectum | MSI-H |  |
| Colorectum | FAP |  |
| ∗Top 15 enriched GO BP terms are showed in the bar plot of each disease state in each tissue. Each row represents a significant GO biological process which is colored according to the -log10(p.adjust). |
| Page: 1 2 3 4 5 6 7 8 9 |
| GO ID | Tissue | Disease Stage | Description | Gene Ratio | Bg Ratio | pvalue | p.adjust | Count |
| GO:0016049110 | Esophagus | ESCC | cell growth | 289/8552 | 482/18723 | 1.29e-10 | 3.77e-09 | 289 |
| GO:003070518 | Esophagus | ESCC | cytoskeleton-dependent intracellular transport | 133/8552 | 195/18723 | 1.48e-10 | 4.27e-09 | 133 |
| GO:001097013 | Esophagus | ESCC | transport along microtubule | 107/8552 | 155/18723 | 3.17e-09 | 6.80e-08 | 107 |
| GO:000808810 | Esophagus | ESCC | axo-dendritic transport | 58/8552 | 75/18723 | 2.09e-08 | 4.02e-07 | 58 |
| GO:00989304 | Esophagus | ESCC | axonal transport | 49/8552 | 64/18723 | 4.54e-07 | 6.15e-06 | 49 |
| GO:00991114 | Esophagus | ESCC | microtubule-based transport | 115/8552 | 190/18723 | 2.54e-05 | 2.15e-04 | 115 |
| GO:000689818 | Esophagus | ESCC | receptor-mediated endocytosis | 142/8552 | 244/18723 | 5.22e-05 | 4.05e-04 | 142 |
| GO:199009017 | Esophagus | ESCC | cellular response to nerve growth factor stimulus | 38/8552 | 53/18723 | 1.10e-04 | 7.69e-04 | 38 |
| GO:199008916 | Esophagus | ESCC | response to nerve growth factor | 39/8552 | 56/18723 | 2.44e-04 | 1.51e-03 | 39 |
| GO:006056010 | Esophagus | ESCC | developmental growth involved in morphogenesis | 131/8552 | 234/18723 | 9.28e-04 | 4.73e-03 | 131 |
| GO:00215436 | Esophagus | ESCC | pallium development | 94/8552 | 169/18723 | 5.79e-03 | 2.14e-02 | 94 |
| GO:004858810 | Esophagus | ESCC | developmental cell growth | 125/8552 | 234/18723 | 1.01e-02 | 3.46e-02 | 125 |
| GO:0048011 | Esophagus | ESCC | neurotrophin TRK receptor signaling pathway | 17/8552 | 24/18723 | 1.13e-02 | 3.81e-02 | 17 |
| GO:006056012 | Lung | AIS | developmental growth involved in morphogenesis | 51/1849 | 234/18723 | 4.43e-08 | 5.24e-06 | 51 |
| GO:001604912 | Lung | AIS | cell growth | 83/1849 | 482/18723 | 3.26e-07 | 2.79e-05 | 83 |
| GO:000689812 | Lung | AIS | receptor-mediated endocytosis | 50/1849 | 244/18723 | 4.47e-07 | 3.52e-05 | 50 |
| GO:199013812 | Lung | AIS | neuron projection extension | 38/1849 | 172/18723 | 1.57e-06 | 9.85e-05 | 38 |
| GO:004858812 | Lung | AIS | developmental cell growth | 47/1849 | 234/18723 | 1.77e-06 | 1.05e-04 | 47 |
| GO:003070512 | Lung | AIS | cytoskeleton-dependent intracellular transport | 37/1849 | 195/18723 | 7.68e-05 | 1.95e-03 | 37 |
| GO:009917311 | Lung | AIS | postsynapse organization | 31/1849 | 168/18723 | 4.67e-04 | 7.79e-03 | 31 |
| Page: 1 2 |
| Pathway ID | Tissue | Disease Stage | Description | Gene Ratio | Bg Ratio | pvalue | p.adjust | qvalue | Count |
| Page: 1 |
Top |
Cell-cell communication analysis |
| Identification of potential cell-cell interactions between two cell types and their ligand-receptor pairs for different disease states |
| Ligand | Receptor | LRpair | Pathway | Tissue | Disease Stage |
| Page: 1 |
Top |
Single-cell gene regulatory network inference analysis |
| Find out the significant the regulons (TFs) and the target genes of each regulon across cell types for different disease states |
| TF | Cell Type | Tissue | Disease Stage | Target Gene | RSS | Regulon Activity |
| ∗The dot plots of a searched regulon are shown for all cell subpopulations in each disease state of each tissue based on the regulon specific score inferred using pySCENIC and by calculating the average expression. |
| Page: 1 |
Top |
Somatic mutation of malignant transformation related genes |
| Annotation of somatic variants for genes involved in malignant transformation |
| Hugo Symbol | Variant Class | Variant Classification | dbSNP RS | HGVSc | HGVSp | HGVSp Short | SWISSPROT | BIOTYPE | SIFT | PolyPhen | Tumor Sample Barcode | Tissue | Histology | Sex | Age | Stage | Therapy Types | Drugs | Outcome |
| TMEM108 | SNV | Missense_Mutation | c.143N>A | p.Gly48Glu | p.G48E | Q6UXF1 | protein_coding | deleterious_low_confidence(0.01) | benign(0.088) | TCGA-A2-A0EO-01 | Breast | breast invasive carcinoma | Female | <65 | I/II | Hormone Therapy | tamoxiphen | SD | |
| TMEM108 | SNV | Missense_Mutation | novel | c.1567G>C | p.Glu523Gln | p.E523Q | Q6UXF1 | protein_coding | deleterious(0.03) | probably_damaging(0.998) | TCGA-C8-A12T-01 | Breast | breast invasive carcinoma | Female | <65 | I/II | Unknown | Unknown | SD |
| TMEM108 | insertion | Nonsense_Mutation | novel | c.287_288insATAACTAGAAATGTTTTTAAA | p.Thr96_Ile97insTer | p.T96_I97ins* | Q6UXF1 | protein_coding | TCGA-B6-A0IA-01 | Breast | breast invasive carcinoma | Female | <65 | I/II | Unknown | Unknown | SD | ||
| TMEM108 | SNV | Missense_Mutation | c.1603N>C | p.Glu535Gln | p.E535Q | Q6UXF1 | protein_coding | tolerated(0.05) | probably_damaging(0.952) | TCGA-C5-A1BQ-01 | Cervix | cervical & endocervical cancer | Female | >=65 | III/IV | Chemotherapy | cisplatin | CR | |
| TMEM108 | SNV | Missense_Mutation | c.1196N>A | p.Gly399Glu | p.G399E | Q6UXF1 | protein_coding | tolerated_low_confidence(0.9) | benign(0.01) | TCGA-EK-A2RJ-01 | Cervix | cervical & endocervical cancer | Female | <65 | I/II | Unknown | Unknown | SD | |
| TMEM108 | SNV | Missense_Mutation | novel | c.1230N>A | p.Met410Ile | p.M410I | Q6UXF1 | protein_coding | tolerated_low_confidence(0.37) | benign(0.006) | TCGA-IR-A3LH-01 | Cervix | cervical & endocervical cancer | Female | <65 | I/II | Chemotherapy | cisplatin | CR |
| TMEM108 | SNV | Missense_Mutation | c.1279N>A | p.Gly427Ser | p.G427S | Q6UXF1 | protein_coding | deleterious(0) | probably_damaging(0.977) | TCGA-A6-2686-01 | Colorectum | colon adenocarcinoma | Female | >=65 | I/II | Unknown | Unknown | SD | |
| TMEM108 | SNV | Missense_Mutation | rs199967106 | c.476G>A | p.Arg159His | p.R159H | Q6UXF1 | protein_coding | deleterious_low_confidence(0.01) | benign(0.386) | TCGA-AA-3685-01 | Colorectum | colon adenocarcinoma | Male | >=65 | I/II | Unknown | Unknown | SD |
| TMEM108 | SNV | Missense_Mutation | rs761644701 | c.1625G>A | p.Arg542His | p.R542H | Q6UXF1 | protein_coding | deleterious(0.01) | benign(0.236) | TCGA-AA-3989-01 | Colorectum | colon adenocarcinoma | Male | >=65 | III/IV | Unknown | Unknown | PD |
| TMEM108 | SNV | Missense_Mutation | novel | c.433N>G | p.Lys145Glu | p.K145E | Q6UXF1 | protein_coding | tolerated_low_confidence(0.06) | benign(0.003) | TCGA-G4-6295-01 | Colorectum | colon adenocarcinoma | Female | >=65 | I/II | Unknown | Unknown | SD |
| Page: 1 2 3 4 5 6 7 |
Top |
Related drugs of malignant transformation related genes |
| Identification of chemicals and drugs interact with genes involved in malignant transfromation |
| (DGIdb 4.0) |
| Entrez ID | Symbol | Category | Interaction Types | Drug Claim Name | Drug Name | PMIDs |
| Page: 1 |

Copyright 2023-Present -The University of Texas Health Science Center at Houston |