
|
|||||
|
 | |
| |
| |
| |
| |
| |
|
Gene: TMEM107 |
Gene summary for TMEM107 |
| Gene information | Species | Human | Gene symbol | TMEM107 | Gene ID | 84314 |
| Gene name | transmembrane protein 107 | |
| Gene Alias | GRVS638 | |
| Cytomap | 17p13.1 | |
| Gene Type | protein-coding | GO ID | GO:0001501 | UniProtAcc | Q6UX40 |
Top |
Malignant transformation analysis |
| Identification of the aberrant gene expression in precancerous and cancerous lesions by comparing the gene expression of stem-like cells in diseased tissues with normal stem cells |
| Entrez ID | Symbol | Replicates | Species | Organ | Tissue | Adj P-value | Log2FC | Malignancy |
| 84314 | TMEM107 | LZE4T | Human | Esophagus | ESCC | 3.97e-07 | 2.96e-01 | 0.0811 |
| 84314 | TMEM107 | LZE7T | Human | Esophagus | ESCC | 9.56e-03 | 1.74e-01 | 0.0667 |
| 84314 | TMEM107 | LZE8T | Human | Esophagus | ESCC | 2.21e-02 | 1.32e-01 | 0.067 |
| 84314 | TMEM107 | LZE21D1 | Human | Esophagus | HGIN | 4.95e-03 | 4.85e-01 | 0.0632 |
| 84314 | TMEM107 | LZE22D1 | Human | Esophagus | HGIN | 2.43e-02 | 1.43e-01 | 0.0595 |
| 84314 | TMEM107 | LZE24T | Human | Esophagus | ESCC | 2.54e-12 | 4.65e-01 | 0.0596 |
| 84314 | TMEM107 | P1T-E | Human | Esophagus | ESCC | 1.35e-09 | 3.90e-01 | 0.0875 |
| 84314 | TMEM107 | P2T-E | Human | Esophagus | ESCC | 6.63e-26 | 5.47e-01 | 0.1177 |
| 84314 | TMEM107 | P4T-E | Human | Esophagus | ESCC | 1.55e-29 | 7.19e-01 | 0.1323 |
| 84314 | TMEM107 | P5T-E | Human | Esophagus | ESCC | 1.10e-14 | 2.30e-01 | 0.1327 |
| 84314 | TMEM107 | P8T-E | Human | Esophagus | ESCC | 5.26e-20 | 3.43e-01 | 0.0889 |
| 84314 | TMEM107 | P9T-E | Human | Esophagus | ESCC | 3.00e-07 | 1.89e-01 | 0.1131 |
| 84314 | TMEM107 | P10T-E | Human | Esophagus | ESCC | 9.88e-18 | 2.91e-01 | 0.116 |
| 84314 | TMEM107 | P11T-E | Human | Esophagus | ESCC | 5.90e-10 | 3.83e-01 | 0.1426 |
| 84314 | TMEM107 | P12T-E | Human | Esophagus | ESCC | 5.31e-18 | 2.77e-01 | 0.1122 |
| 84314 | TMEM107 | P15T-E | Human | Esophagus | ESCC | 4.25e-10 | 1.56e-01 | 0.1149 |
| 84314 | TMEM107 | P16T-E | Human | Esophagus | ESCC | 1.17e-24 | 4.99e-01 | 0.1153 |
| 84314 | TMEM107 | P17T-E | Human | Esophagus | ESCC | 6.54e-06 | 3.85e-01 | 0.1278 |
| 84314 | TMEM107 | P19T-E | Human | Esophagus | ESCC | 1.43e-09 | 9.23e-01 | 0.1662 |
| 84314 | TMEM107 | P20T-E | Human | Esophagus | ESCC | 4.43e-13 | 3.27e-01 | 0.1124 |
| Page: 1 2 3 4 5 |
| Tissue | Expression Dynamics | Abbreviation |
| Esophagus | 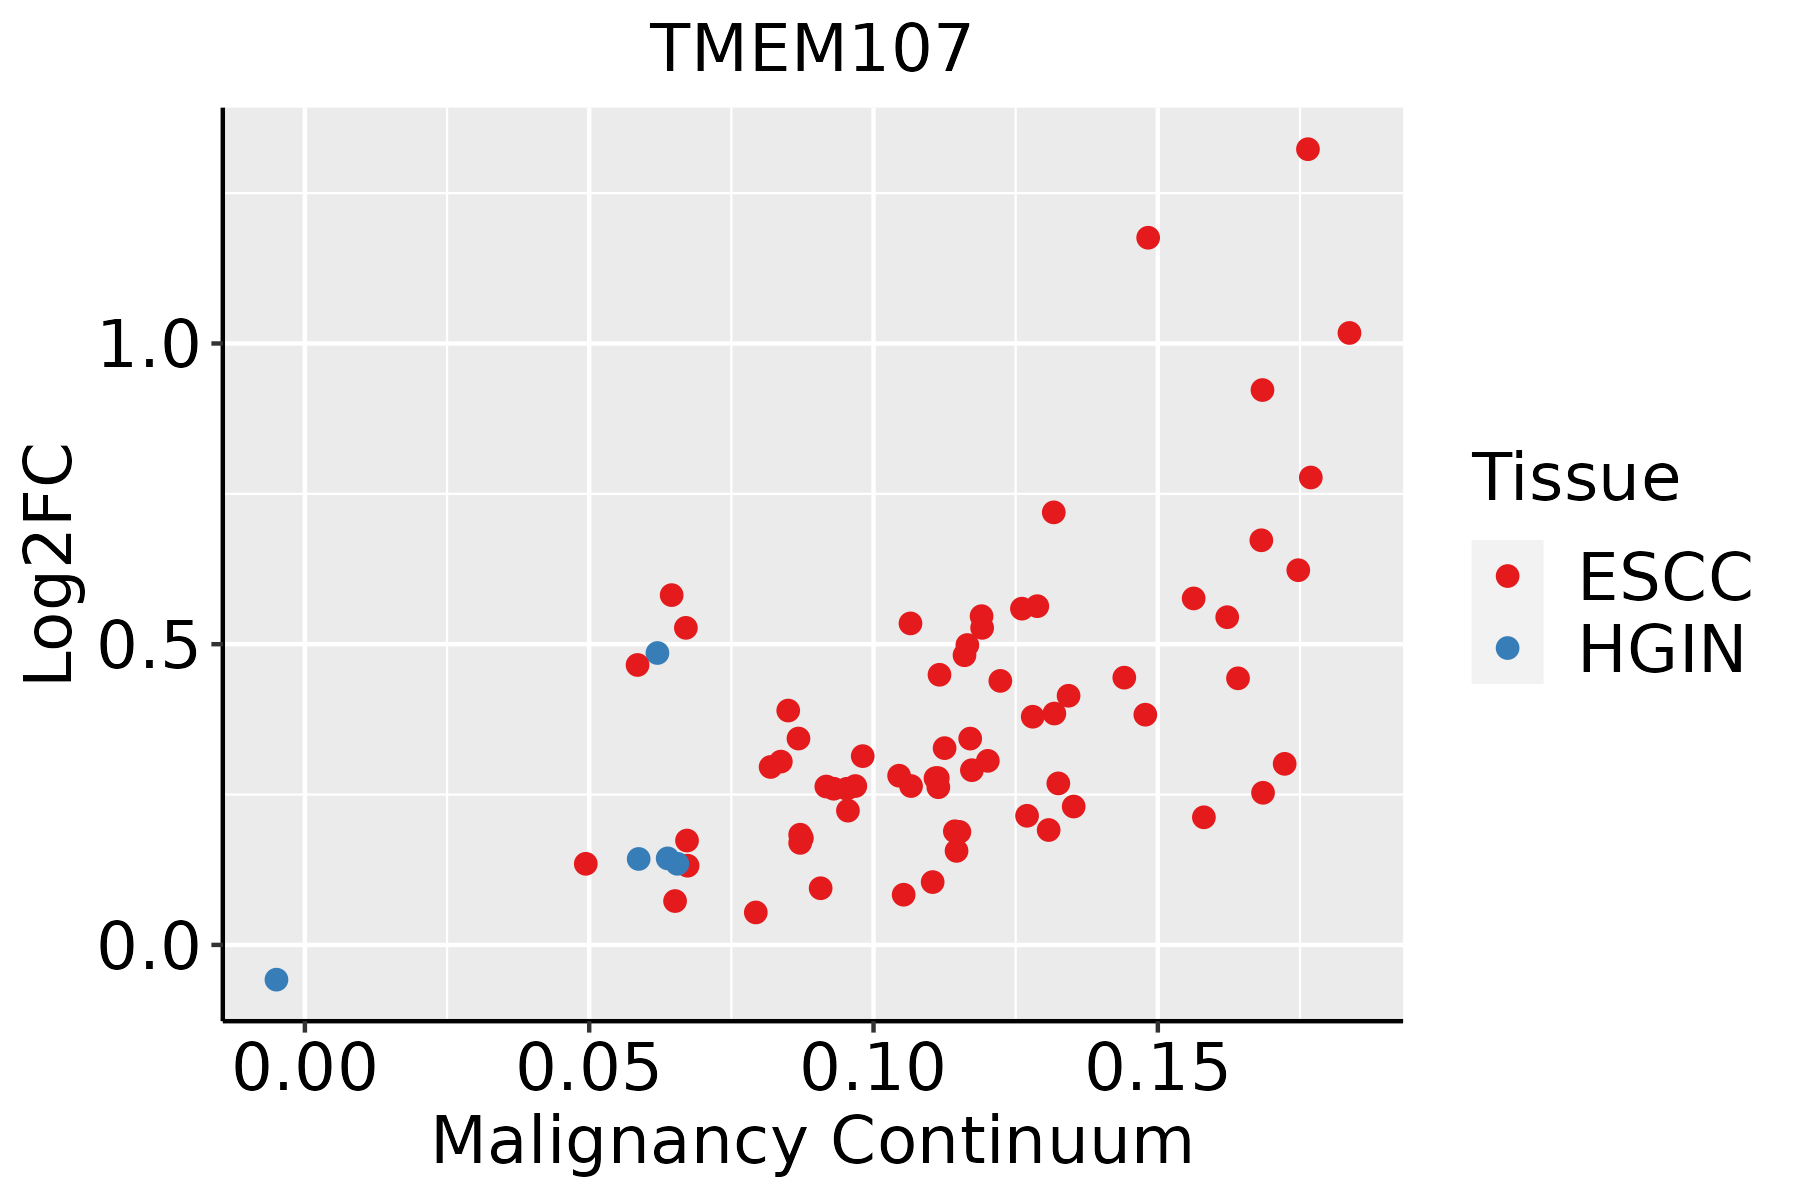 | ESCC: Esophageal squamous cell carcinoma |
| HGIN: High-grade intraepithelial neoplasias | ||
| LGIN: Low-grade intraepithelial neoplasias | ||
| Oral Cavity |  | EOLP: Erosive Oral lichen planus |
| LP: leukoplakia | ||
| NEOLP: Non-erosive oral lichen planus | ||
| OSCC: Oral squamous cell carcinoma | ||
| Thyroid | 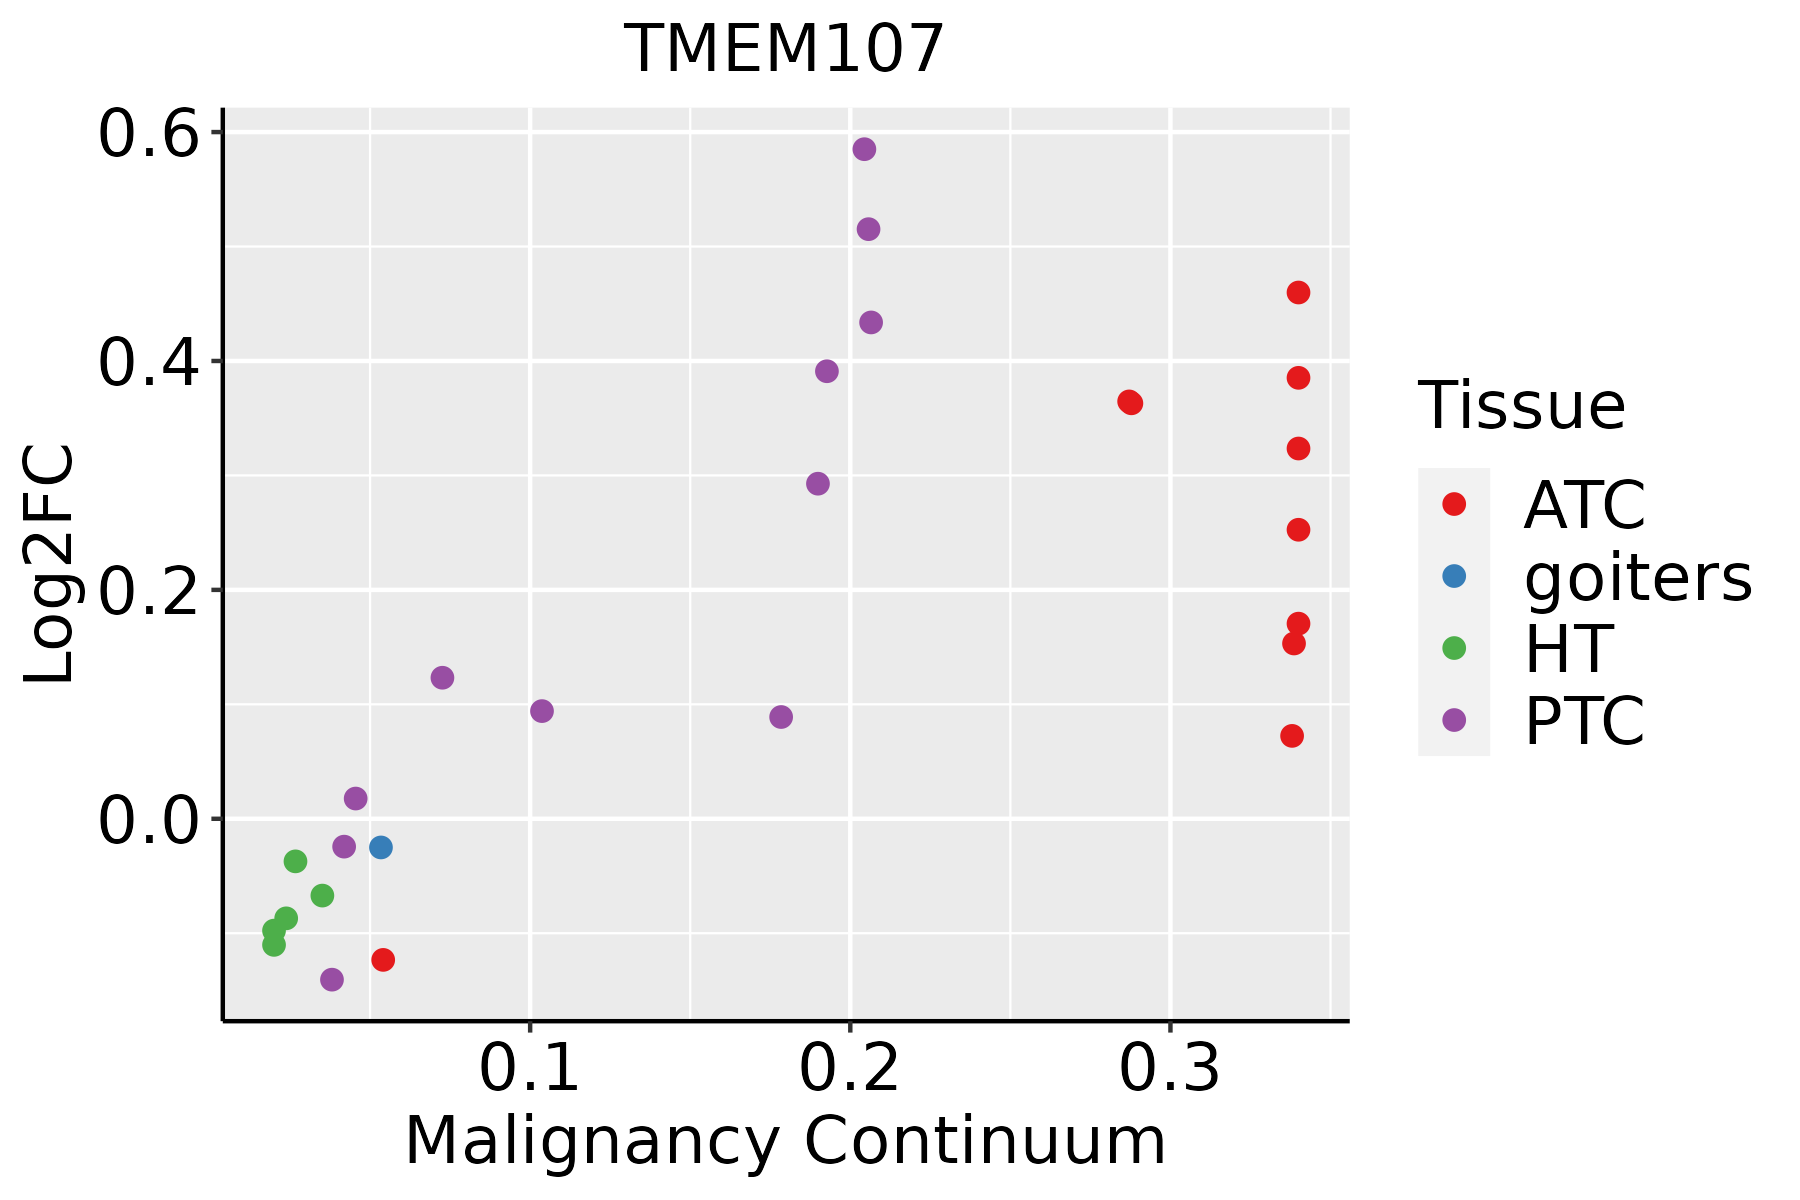 | ATC: Anaplastic thyroid cancer |
| HT: Hashimoto's thyroiditis | ||
| PTC: Papillary thyroid cancer |
| ∗log2FC in expression of this searched gene in stem-like cells from each diseased tissue sample relative to stem-like cells in normal samples in each tissue plotted against the malignancy continuum. Samples are colored based on if they are from different disease stage. |
Top |
Malignant transformation related pathway analysis |
| Find out the enriched GO biological processes and KEGG pathways involved in transition from healthy to precancer to cancer |
| Tissue | Disease Stage | Enriched GO biological Processes |
| Colorectum | AD |  |
| Colorectum | SER |  |
| Colorectum | MSS |  |
| Colorectum | MSI-H |  |
| Colorectum | FAP |  |
| ∗Top 15 enriched GO BP terms are showed in the bar plot of each disease state in each tissue. Each row represents a significant GO biological process which is colored according to the -log10(p.adjust). |
| Page: 1 2 3 4 5 6 7 8 9 |
| GO ID | Tissue | Disease Stage | Description | Gene Ratio | Bg Ratio | pvalue | p.adjust | Count |
| GO:00219159 | Esophagus | ESCC | neural tube development | 101/8552 | 152/18723 | 1.78e-07 | 2.79e-06 | 101 |
| GO:00603485 | Esophagus | ESCC | bone development | 115/8552 | 205/18723 | 1.67e-03 | 7.72e-03 | 115 |
| GO:00487367 | Esophagus | ESCC | appendage development | 98/8552 | 172/18723 | 1.83e-03 | 8.37e-03 | 98 |
| GO:00601737 | Esophagus | ESCC | limb development | 98/8552 | 172/18723 | 1.83e-03 | 8.37e-03 | 98 |
| GO:19055153 | Esophagus | ESCC | non-motile cilium assembly | 39/8552 | 61/18723 | 3.08e-03 | 1.28e-02 | 39 |
| GO:00487052 | Esophagus | ESCC | skeletal system morphogenesis | 120/8552 | 220/18723 | 4.90e-03 | 1.89e-02 | 120 |
| GO:0060021 | Esophagus | ESCC | roof of mouth development | 50/8552 | 85/18723 | 1.00e-02 | 3.42e-02 | 50 |
| GO:19048881 | Esophagus | ESCC | cranial skeletal system development | 41/8552 | 68/18723 | 1.07e-02 | 3.66e-02 | 41 |
| GO:00219158 | Oral cavity | OSCC | neural tube development | 77/7305 | 152/18723 | 2.26e-03 | 1.00e-02 | 77 |
| GO:00603484 | Oral cavity | OSCC | bone development | 99/7305 | 205/18723 | 4.13e-03 | 1.68e-02 | 99 |
| GO:1904888 | Oral cavity | OSCC | cranial skeletal system development | 36/7305 | 68/18723 | 1.36e-02 | 4.50e-02 | 36 |
| GO:002191514 | Thyroid | PTC | neural tube development | 76/5968 | 152/18723 | 2.40e-06 | 3.17e-05 | 76 |
| GO:00603486 | Thyroid | PTC | bone development | 90/5968 | 205/18723 | 1.89e-04 | 1.42e-03 | 90 |
| GO:002191515 | Thyroid | ATC | neural tube development | 80/6293 | 152/18723 | 9.87e-07 | 1.29e-05 | 80 |
| GO:006034813 | Thyroid | ATC | bone development | 102/6293 | 205/18723 | 1.18e-06 | 1.52e-05 | 102 |
| GO:0060349 | Thyroid | ATC | bone morphogenesis | 50/6293 | 93/18723 | 4.87e-05 | 3.88e-04 | 50 |
| GO:00487053 | Thyroid | ATC | skeletal system morphogenesis | 101/6293 | 220/18723 | 9.48e-05 | 6.93e-04 | 101 |
| GO:19048882 | Thyroid | ATC | cranial skeletal system development | 35/6293 | 68/18723 | 1.76e-03 | 8.71e-03 | 35 |
| GO:00600211 | Thyroid | ATC | roof of mouth development | 42/6293 | 85/18723 | 1.83e-03 | 9.02e-03 | 42 |
| GO:00351074 | Thyroid | ATC | appendage morphogenesis | 63/6293 | 138/18723 | 2.13e-03 | 1.00e-02 | 63 |
| Page: 1 2 |
| Pathway ID | Tissue | Disease Stage | Description | Gene Ratio | Bg Ratio | pvalue | p.adjust | qvalue | Count |
| Page: 1 |
Top |
Cell-cell communication analysis |
| Identification of potential cell-cell interactions between two cell types and their ligand-receptor pairs for different disease states |
| Ligand | Receptor | LRpair | Pathway | Tissue | Disease Stage |
| Page: 1 |
Top |
Single-cell gene regulatory network inference analysis |
| Find out the significant the regulons (TFs) and the target genes of each regulon across cell types for different disease states |
| TF | Cell Type | Tissue | Disease Stage | Target Gene | RSS | Regulon Activity |
| ∗The dot plots of a searched regulon are shown for all cell subpopulations in each disease state of each tissue based on the regulon specific score inferred using pySCENIC and by calculating the average expression. |
| Page: 1 |
Top |
Somatic mutation of malignant transformation related genes |
| Annotation of somatic variants for genes involved in malignant transformation |
| Hugo Symbol | Variant Class | Variant Classification | dbSNP RS | HGVSc | HGVSp | HGVSp Short | SWISSPROT | BIOTYPE | SIFT | PolyPhen | Tumor Sample Barcode | Tissue | Histology | Sex | Age | Stage | Therapy Types | Drugs | Outcome |
| TMEM107 | SNV | Missense_Mutation | c.325G>C | p.Glu109Gln | p.E109Q | Q6UX40 | protein_coding | tolerated(0.16) | probably_damaging(0.998) | TCGA-EK-A3GK-01 | Cervix | cervical & endocervical cancer | Female | <65 | I/II | Unknown | Unknown | SD | |
| TMEM107 | SNV | Missense_Mutation | c.344N>T | p.Thr115Met | p.T115M | Q6UX40 | protein_coding | tolerated(0.23) | benign(0.015) | TCGA-AA-A00N-01 | Colorectum | colon adenocarcinoma | Male | >=65 | I/II | Unknown | Unknown | PD | |
| TMEM107 | SNV | Missense_Mutation | c.132N>T | p.Glu44Asp | p.E44D | Q6UX40 | protein_coding | tolerated(0.32) | possibly_damaging(0.555) | TCGA-AP-A059-01 | Endometrium | uterine corpus endometrioid carcinoma | Female | >=65 | I/II | Unknown | Unknown | SD | |
| TMEM107 | SNV | Missense_Mutation | novel | c.422N>C | p.Leu141Pro | p.L141P | Q6UX40 | protein_coding | deleterious(0) | probably_damaging(0.982) | TCGA-AP-A1DK-01 | Endometrium | uterine corpus endometrioid carcinoma | Female | <65 | I/II | Unknown | Unknown | SD |
| TMEM107 | SNV | Missense_Mutation | novel | c.175C>A | p.Leu59Met | p.L59M | Q6UX40 | protein_coding | tolerated(0.09) | possibly_damaging(0.66) | TCGA-B5-A3FA-01 | Endometrium | uterine corpus endometrioid carcinoma | Female | >=65 | I/II | Unknown | Unknown | SD |
| TMEM107 | SNV | Missense_Mutation | c.184N>T | p.Ala62Ser | p.A62S | Q6UX40 | protein_coding | deleterious(0.04) | probably_damaging(0.997) | TCGA-51-4080-01 | Lung | lung squamous cell carcinoma | Male | >=65 | III/IV | Unknown | Unknown | SD | |
| TMEM107 | SNV | Missense_Mutation | novel | c.163N>T | p.Pro55Ser | p.P55S | Q6UX40 | protein_coding | tolerated_low_confidence(0.64) | benign(0) | TCGA-68-8251-01 | Lung | lung squamous cell carcinoma | Male | >=65 | I/II | Chemotherapy | carboplatin | SD |
| TMEM107 | SNV | Missense_Mutation | novel | c.438N>G | p.Phe146Leu | p.F146L | Q6UX40 | protein_coding | tolerated_low_confidence(0.22) | benign(0) | TCGA-CR-6484-01 | Oral cavity | head & neck squamous cell carcinoma | Female | >=65 | I/II | Chemotherapy | carboplatin | SD |
| TMEM107 | SNV | Missense_Mutation | novel | c.299N>T | p.Ser100Phe | p.S100F | Q6UX40 | protein_coding | deleterious(0) | possibly_damaging(0.885) | TCGA-QK-A8Z7-01 | Oral cavity | head & neck squamous cell carcinoma | Male | <65 | I/II | Chemotherapy | carboplatin | CR |
| TMEM107 | SNV | Missense_Mutation | c.337T>C | p.Cys113Arg | p.C113R | Q6UX40 | protein_coding | deleterious(0) | probably_damaging(0.997) | TCGA-BR-4362-01 | Stomach | stomach adenocarcinoma | Female | >=65 | I/II | Unknown | Unknown | SD |
| Page: 1 2 |
Top |
Related drugs of malignant transformation related genes |
| Identification of chemicals and drugs interact with genes involved in malignant transfromation |
| (DGIdb 4.0) |
| Entrez ID | Symbol | Category | Interaction Types | Drug Claim Name | Drug Name | PMIDs |
| Page: 1 |

Copyright 2023-Present -The University of Texas Health Science Center at Houston |