
|
|||||
|
 | |
| |
| |
| |
| |
| |
|
Gene: TMEM106B |
Gene summary for TMEM106B |
| Gene information | Species | Human | Gene symbol | TMEM106B | Gene ID | 54664 |
| Gene name | transmembrane protein 106B | |
| Gene Alias | HLD16 | |
| Cytomap | 7p21.3 | |
| Gene Type | protein-coding | GO ID | GO:0000902 | UniProtAcc | A0A024R9Z1 |
Top |
Malignant transformation analysis |
| Identification of the aberrant gene expression in precancerous and cancerous lesions by comparing the gene expression of stem-like cells in diseased tissues with normal stem cells |
| Entrez ID | Symbol | Replicates | Species | Organ | Tissue | Adj P-value | Log2FC | Malignancy |
| 54664 | TMEM106B | LZE4T | Human | Esophagus | ESCC | 2.09e-17 | 5.10e-01 | 0.0811 |
| 54664 | TMEM106B | LZE5T | Human | Esophagus | ESCC | 2.04e-05 | 5.68e-01 | 0.0514 |
| 54664 | TMEM106B | LZE7T | Human | Esophagus | ESCC | 7.27e-06 | 5.84e-01 | 0.0667 |
| 54664 | TMEM106B | LZE8T | Human | Esophagus | ESCC | 2.60e-04 | 2.88e-01 | 0.067 |
| 54664 | TMEM106B | LZE20T | Human | Esophagus | ESCC | 1.80e-02 | 1.54e-01 | 0.0662 |
| 54664 | TMEM106B | LZE22T | Human | Esophagus | ESCC | 6.92e-03 | 7.47e-01 | 0.068 |
| 54664 | TMEM106B | LZE24T | Human | Esophagus | ESCC | 3.69e-19 | 6.09e-01 | 0.0596 |
| 54664 | TMEM106B | LZE21T | Human | Esophagus | ESCC | 2.43e-02 | 6.48e-01 | 0.0655 |
| 54664 | TMEM106B | LZE6T | Human | Esophagus | ESCC | 2.22e-09 | 5.57e-01 | 0.0845 |
| 54664 | TMEM106B | P1T-E | Human | Esophagus | ESCC | 3.49e-15 | 6.61e-01 | 0.0875 |
| 54664 | TMEM106B | P2T-E | Human | Esophagus | ESCC | 2.78e-46 | 8.66e-01 | 0.1177 |
| 54664 | TMEM106B | P4T-E | Human | Esophagus | ESCC | 1.20e-31 | 7.83e-01 | 0.1323 |
| 54664 | TMEM106B | P5T-E | Human | Esophagus | ESCC | 1.73e-12 | 1.84e-01 | 0.1327 |
| 54664 | TMEM106B | P8T-E | Human | Esophagus | ESCC | 1.93e-28 | 4.13e-01 | 0.0889 |
| 54664 | TMEM106B | P9T-E | Human | Esophagus | ESCC | 9.92e-18 | 4.80e-01 | 0.1131 |
| 54664 | TMEM106B | P10T-E | Human | Esophagus | ESCC | 2.58e-40 | 8.02e-01 | 0.116 |
| 54664 | TMEM106B | P11T-E | Human | Esophagus | ESCC | 1.89e-25 | 1.09e+00 | 0.1426 |
| 54664 | TMEM106B | P12T-E | Human | Esophagus | ESCC | 6.99e-57 | 1.28e+00 | 0.1122 |
| 54664 | TMEM106B | P15T-E | Human | Esophagus | ESCC | 2.22e-35 | 7.59e-01 | 0.1149 |
| 54664 | TMEM106B | P16T-E | Human | Esophagus | ESCC | 1.27e-51 | 1.20e+00 | 0.1153 |
| Page: 1 2 3 4 5 6 |
| Tissue | Expression Dynamics | Abbreviation |
| Esophagus | 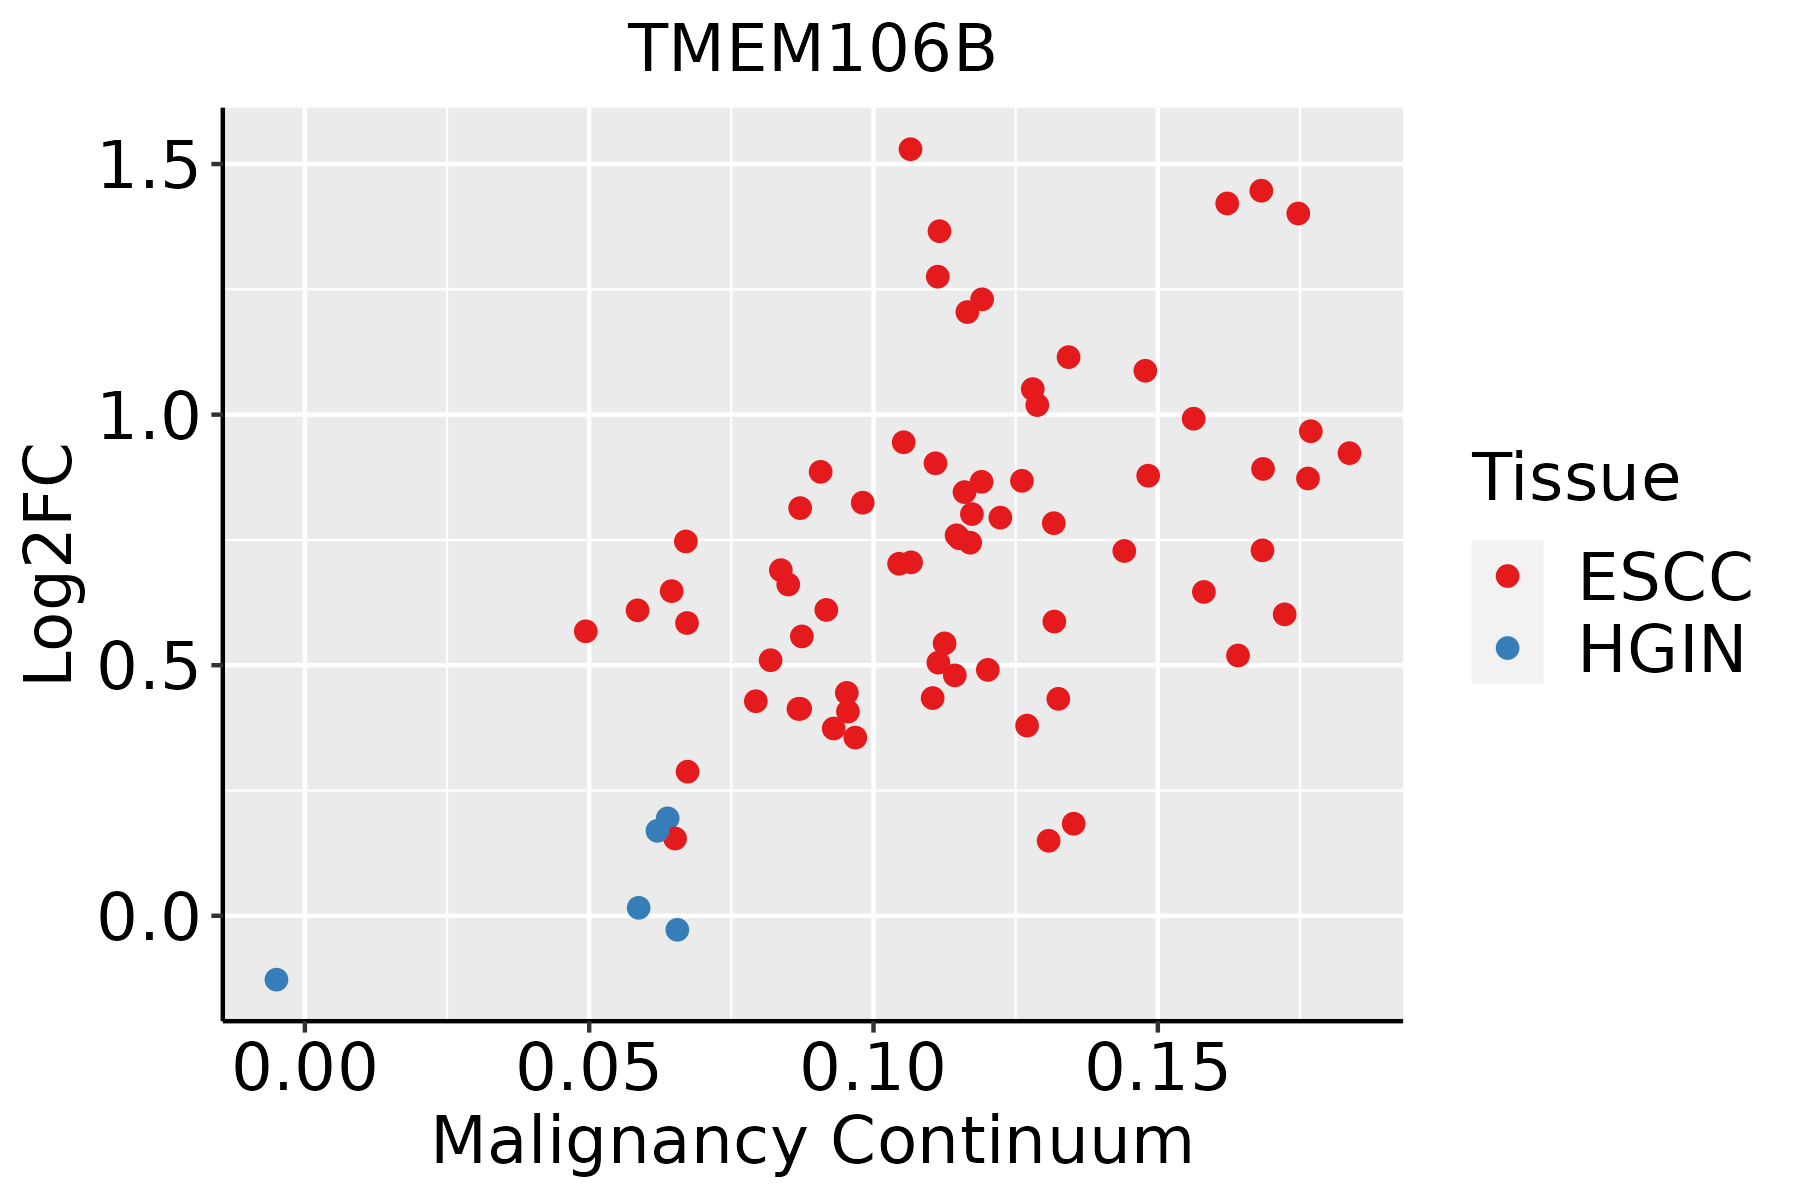 | ESCC: Esophageal squamous cell carcinoma |
| HGIN: High-grade intraepithelial neoplasias | ||
| LGIN: Low-grade intraepithelial neoplasias | ||
| Liver | 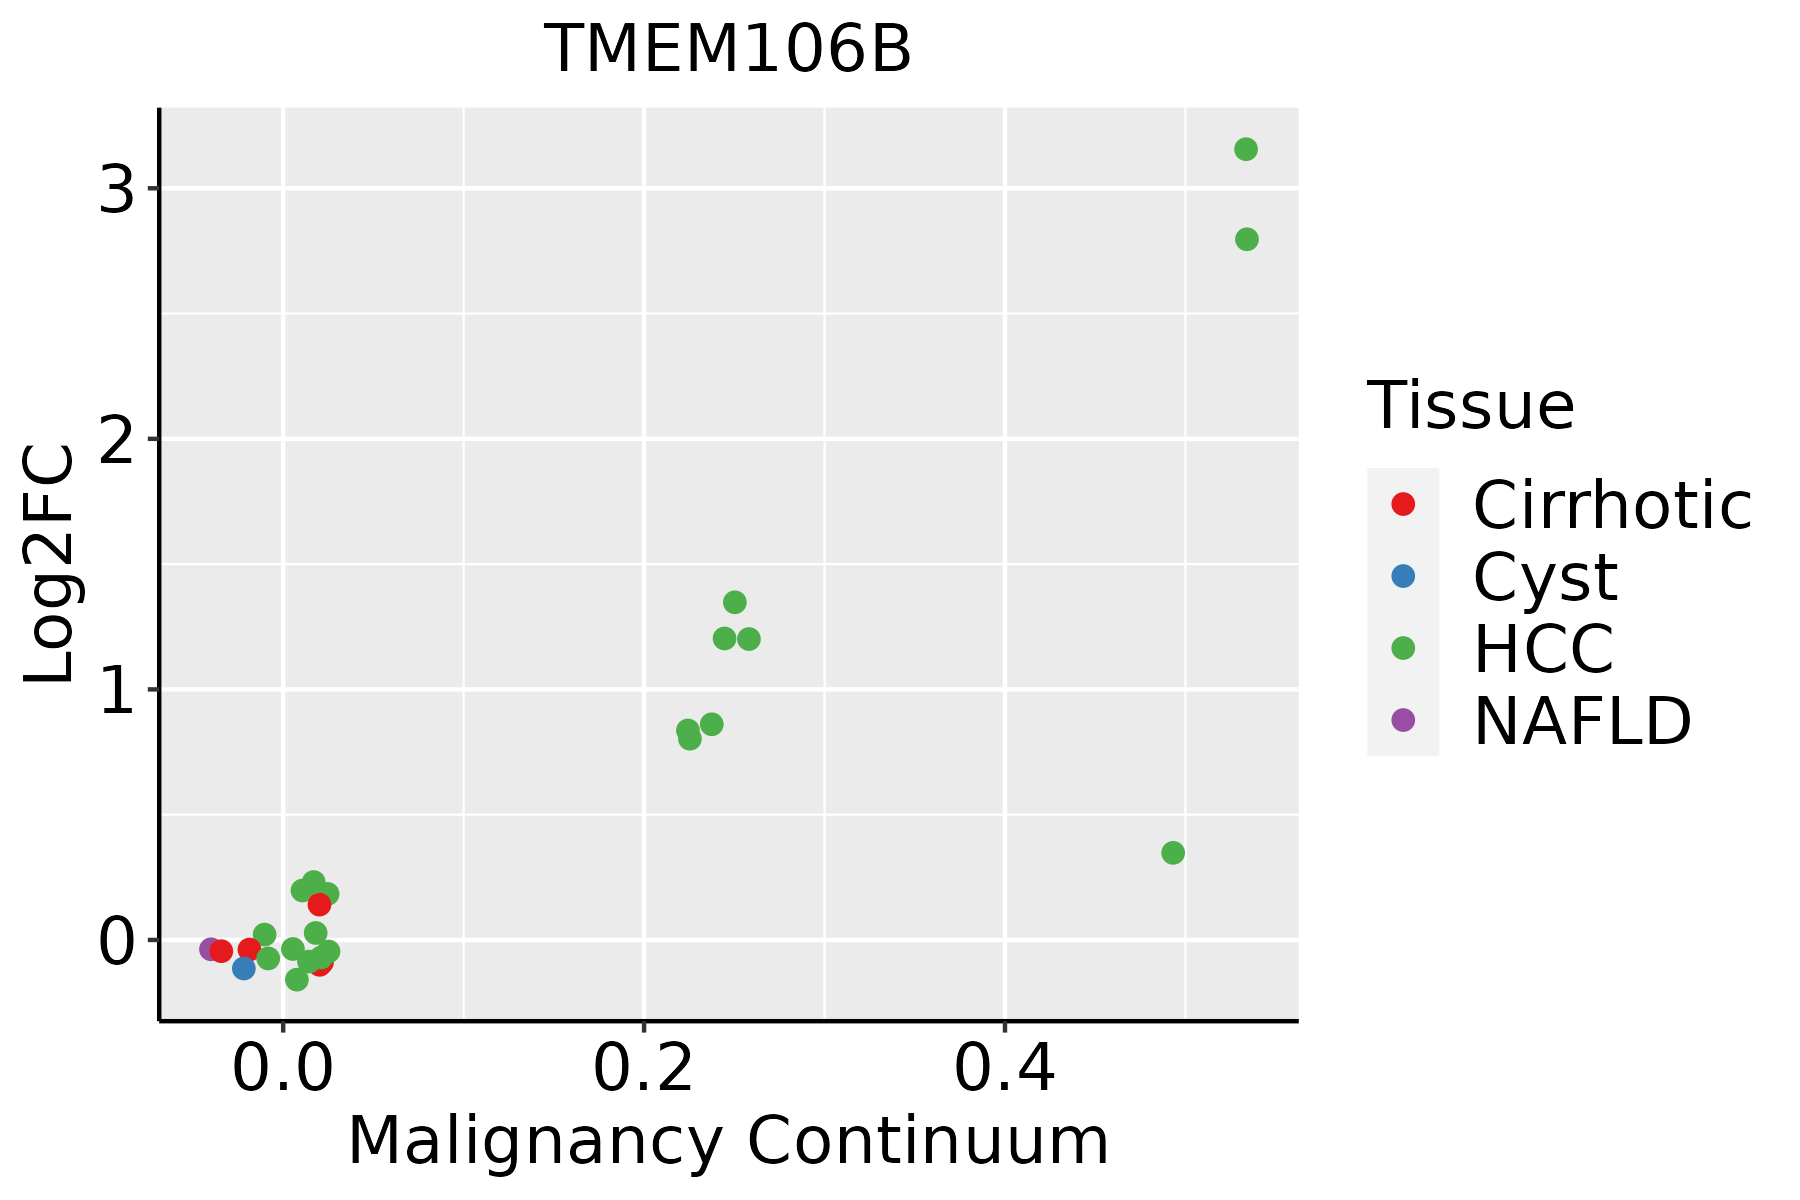 | HCC: Hepatocellular carcinoma |
| NAFLD: Non-alcoholic fatty liver disease | ||
| Oral Cavity | 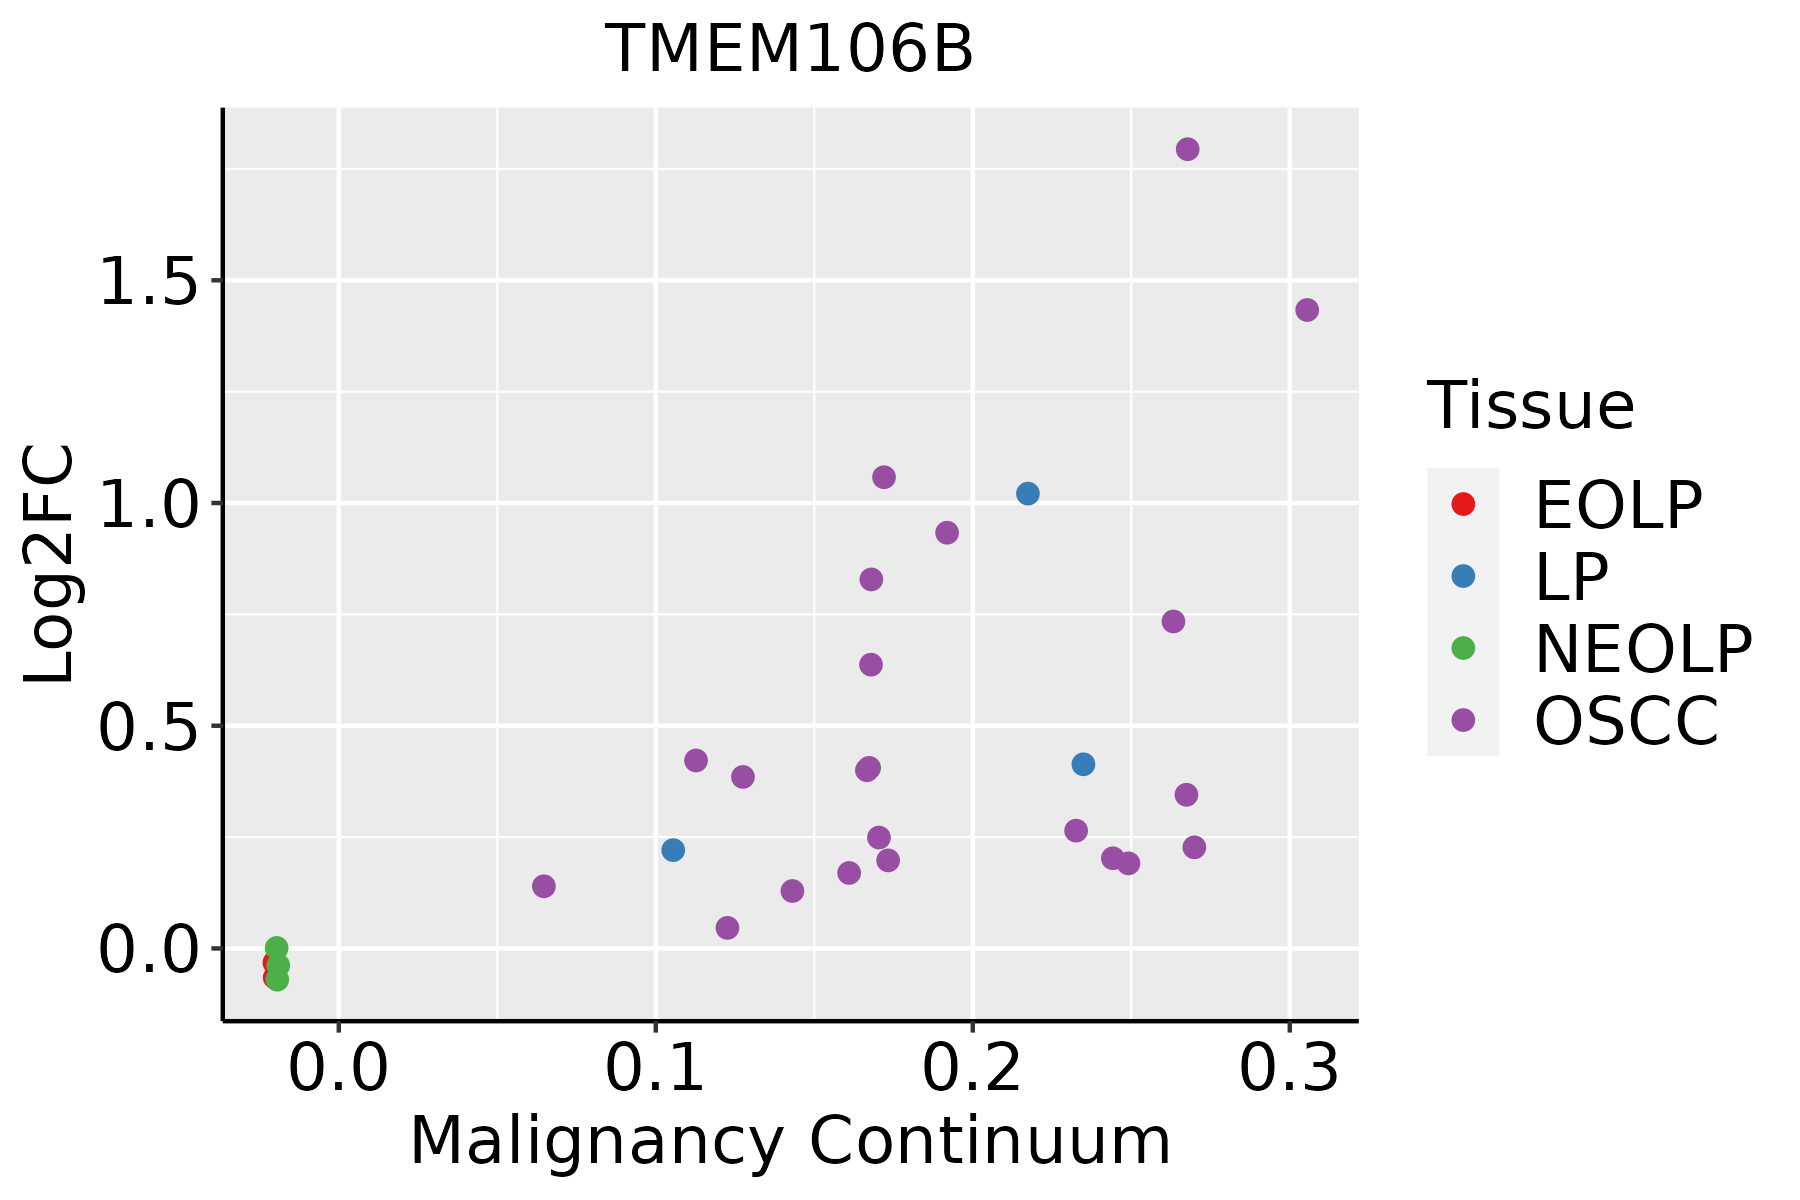 | EOLP: Erosive Oral lichen planus |
| LP: leukoplakia | ||
| NEOLP: Non-erosive oral lichen planus | ||
| OSCC: Oral squamous cell carcinoma | ||
| Skin |  | AK: Actinic keratosis |
| cSCC: Cutaneous squamous cell carcinoma | ||
| SCCIS:squamous cell carcinoma in situ | ||
| Thyroid | 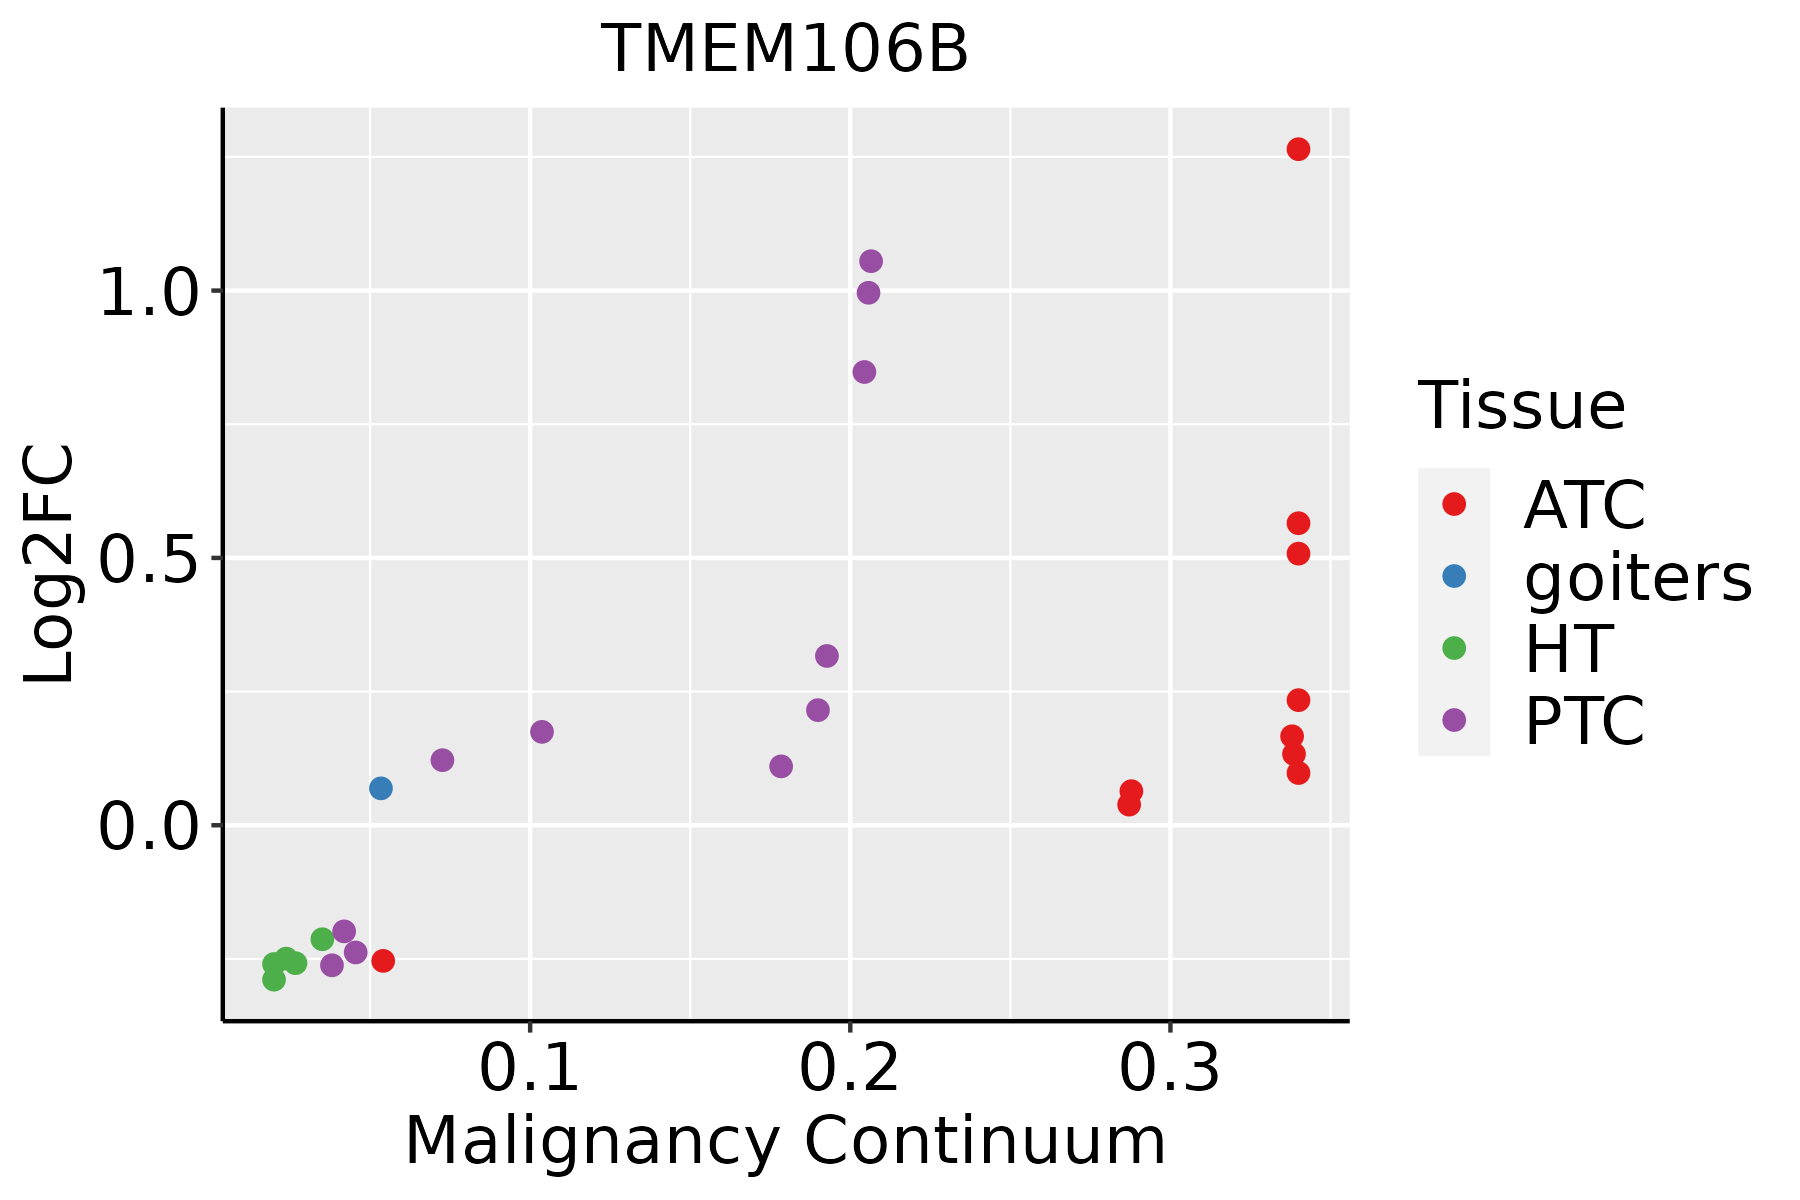 | ATC: Anaplastic thyroid cancer |
| HT: Hashimoto's thyroiditis | ||
| PTC: Papillary thyroid cancer |
| ∗log2FC in expression of this searched gene in stem-like cells from each diseased tissue sample relative to stem-like cells in normal samples in each tissue plotted against the malignancy continuum. Samples are colored based on if they are from different disease stage. |
Top |
Malignant transformation related pathway analysis |
| Find out the enriched GO biological processes and KEGG pathways involved in transition from healthy to precancer to cancer |
| Tissue | Disease Stage | Enriched GO biological Processes |
| Colorectum | AD |  |
| Colorectum | SER |  |
| Colorectum | MSS |  |
| Colorectum | MSI-H |  |
| Colorectum | FAP |  |
| ∗Top 15 enriched GO BP terms are showed in the bar plot of each disease state in each tissue. Each row represents a significant GO biological process which is colored according to the -log10(p.adjust). |
| Page: 1 2 3 4 5 6 7 8 9 |
| GO ID | Tissue | Disease Stage | Description | Gene Ratio | Bg Ratio | pvalue | p.adjust | Count |
| GO:000703417 | Esophagus | ESCC | vacuolar transport | 119/8552 | 157/18723 | 1.16e-14 | 6.30e-13 | 119 |
| GO:000703314 | Esophagus | ESCC | vacuole organization | 127/8552 | 180/18723 | 1.04e-11 | 3.85e-10 | 127 |
| GO:00070419 | Esophagus | ESCC | lysosomal transport | 83/8552 | 114/18723 | 3.52e-09 | 7.41e-08 | 83 |
| GO:00070403 | Esophagus | ESCC | lysosome organization | 53/8552 | 74/18723 | 5.34e-06 | 5.57e-05 | 53 |
| GO:00801713 | Esophagus | ESCC | lytic vacuole organization | 53/8552 | 74/18723 | 5.34e-06 | 5.57e-05 | 53 |
| GO:003134616 | Esophagus | ESCC | positive regulation of cell projection organization | 201/8552 | 353/18723 | 1.19e-05 | 1.11e-04 | 201 |
| GO:00070353 | Esophagus | ESCC | vacuolar acidification | 20/8552 | 24/18723 | 1.69e-04 | 1.11e-03 | 20 |
| GO:00070423 | Esophagus | ESCC | lysosomal lumen acidification | 11/8552 | 11/18723 | 1.80e-04 | 1.16e-03 | 11 |
| GO:001097516 | Esophagus | ESCC | regulation of neuron projection development | 240/8552 | 445/18723 | 2.48e-04 | 1.53e-03 | 240 |
| GO:004408812 | Esophagus | ESCC | regulation of vacuole organization | 32/8552 | 45/18723 | 4.87e-04 | 2.70e-03 | 32 |
| GO:00070393 | Esophagus | ESCC | protein catabolic process in the vacuole | 16/8552 | 19/18723 | 6.45e-04 | 3.43e-03 | 16 |
| GO:19051463 | Esophagus | ESCC | lysosomal protein catabolic process | 13/8552 | 15/18723 | 1.31e-03 | 6.26e-03 | 13 |
| GO:00514521 | Esophagus | ESCC | intracellular pH reduction | 29/8552 | 42/18723 | 1.87e-03 | 8.46e-03 | 29 |
| GO:00458511 | Esophagus | ESCC | pH reduction | 31/8552 | 46/18723 | 2.42e-03 | 1.06e-02 | 31 |
| GO:00109764 | Esophagus | ESCC | positive regulation of neuron projection development | 91/8552 | 163/18723 | 5.72e-03 | 2.13e-02 | 91 |
| GO:001635816 | Esophagus | ESCC | dendrite development | 130/8552 | 243/18723 | 8.33e-03 | 2.95e-02 | 130 |
| GO:000703411 | Liver | Cirrhotic | vacuolar transport | 75/4634 | 157/18723 | 3.13e-10 | 1.53e-08 | 75 |
| GO:00070332 | Liver | Cirrhotic | vacuole organization | 80/4634 | 180/18723 | 5.73e-09 | 2.25e-07 | 80 |
| GO:000704111 | Liver | Cirrhotic | lysosomal transport | 50/4634 | 114/18723 | 6.15e-06 | 9.82e-05 | 50 |
| GO:0007040 | Liver | Cirrhotic | lysosome organization | 35/4634 | 74/18723 | 2.10e-05 | 2.77e-04 | 35 |
| Page: 1 2 3 4 5 6 |
| Pathway ID | Tissue | Disease Stage | Description | Gene Ratio | Bg Ratio | pvalue | p.adjust | qvalue | Count |
| Page: 1 |
Top |
Cell-cell communication analysis |
| Identification of potential cell-cell interactions between two cell types and their ligand-receptor pairs for different disease states |
| Ligand | Receptor | LRpair | Pathway | Tissue | Disease Stage |
| Page: 1 |
Top |
Single-cell gene regulatory network inference analysis |
| Find out the significant the regulons (TFs) and the target genes of each regulon across cell types for different disease states |
| TF | Cell Type | Tissue | Disease Stage | Target Gene | RSS | Regulon Activity |
| ∗The dot plots of a searched regulon are shown for all cell subpopulations in each disease state of each tissue based on the regulon specific score inferred using pySCENIC and by calculating the average expression. |
| Page: 1 |
Top |
Somatic mutation of malignant transformation related genes |
| Annotation of somatic variants for genes involved in malignant transformation |
| Hugo Symbol | Variant Class | Variant Classification | dbSNP RS | HGVSc | HGVSp | HGVSp Short | SWISSPROT | BIOTYPE | SIFT | PolyPhen | Tumor Sample Barcode | Tissue | Histology | Sex | Age | Stage | Therapy Types | Drugs | Outcome |
| TMEM106B | SNV | Missense_Mutation | c.558T>G | p.Ile186Met | p.I186M | Q9NUM4 | protein_coding | tolerated(0.13) | benign(0.091) | TCGA-A8-A07W-01 | Breast | breast invasive carcinoma | Female | >=65 | III/IV | Hormone Therapy | exemestane | SD | |
| TMEM106B | SNV | Missense_Mutation | c.263N>C | p.Arg88Thr | p.R88T | Q9NUM4 | protein_coding | deleterious(0) | probably_damaging(0.998) | TCGA-BH-A0AV-01 | Breast | breast invasive carcinoma | Female | <65 | I/II | Chemotherapy | taxotere | CR | |
| TMEM106B | SNV | Missense_Mutation | c.278G>T | p.Arg93Ile | p.R93I | Q9NUM4 | protein_coding | deleterious(0) | probably_damaging(0.999) | TCGA-AA-3977-01 | Colorectum | colon adenocarcinoma | Male | >=65 | I/II | Unknown | Unknown | SD | |
| TMEM106B | SNV | Missense_Mutation | novel | c.98G>A | p.Ser33Asn | p.S33N | Q9NUM4 | protein_coding | tolerated(0.3) | benign(0.001) | TCGA-AA-A01K-01 | Colorectum | colon adenocarcinoma | Female | >=65 | III/IV | Chemotherapy | folinic | CR |
| TMEM106B | SNV | Missense_Mutation | c.263N>T | p.Arg88Ile | p.R88I | Q9NUM4 | protein_coding | deleterious(0) | probably_damaging(0.999) | TCGA-EI-6507-01 | Colorectum | rectum adenocarcinoma | Male | <65 | I/II | Unknown | Unknown | SD | |
| TMEM106B | SNV | Missense_Mutation | novel | c.329G>A | p.Gly110Glu | p.G110E | Q9NUM4 | protein_coding | deleterious(0.01) | possibly_damaging(0.885) | TCGA-A5-A0G2-01 | Endometrium | uterine corpus endometrioid carcinoma | Female | <65 | III/IV | Unknown | Unknown | SD |
| TMEM106B | SNV | Missense_Mutation | novel | c.59G>A | p.Gly20Glu | p.G20E | Q9NUM4 | protein_coding | tolerated(0.75) | benign(0) | TCGA-A5-A1OF-01 | Endometrium | uterine corpus endometrioid carcinoma | Female | <65 | I/II | Unknown | Unknown | SD |
| TMEM106B | SNV | Missense_Mutation | c.293N>C | p.Val98Ala | p.V98A | Q9NUM4 | protein_coding | deleterious(0) | probably_damaging(0.997) | TCGA-AJ-A3EK-01 | Endometrium | uterine corpus endometrioid carcinoma | Female | <65 | I/II | Chemotherapy | carboplatin | CR | |
| TMEM106B | SNV | Missense_Mutation | novel | c.667A>C | p.Asn223His | p.N223H | Q9NUM4 | protein_coding | deleterious(0.04) | possibly_damaging(0.558) | TCGA-AX-A05Z-01 | Endometrium | uterine corpus endometrioid carcinoma | Female | <65 | III/IV | Chemotherapy | adriamycin | SD |
| TMEM106B | SNV | Missense_Mutation | novel | c.299N>A | p.Ala100Asp | p.A100D | Q9NUM4 | protein_coding | deleterious(0) | possibly_damaging(0.69) | TCGA-B5-A3FA-01 | Endometrium | uterine corpus endometrioid carcinoma | Female | >=65 | I/II | Unknown | Unknown | SD |
| Page: 1 2 3 |
Top |
Related drugs of malignant transformation related genes |
| Identification of chemicals and drugs interact with genes involved in malignant transfromation |
| (DGIdb 4.0) |
| Entrez ID | Symbol | Category | Interaction Types | Drug Claim Name | Drug Name | PMIDs |
| Page: 1 |

Copyright 2023-Present -The University of Texas Health Science Center at Houston |