
|
|||||
|
 | |
| |
| |
| |
| |
| |
|
Gene: TMEM106A |
Gene summary for TMEM106A |
| Gene information | Species | Human | Gene symbol | TMEM106A | Gene ID | 113277 |
| Gene name | transmembrane protein 106A | |
| Gene Alias | TMEM106A | |
| Cytomap | 17q21.31 | |
| Gene Type | protein-coding | GO ID | GO:0000165 | UniProtAcc | Q96A25 |
Top |
Malignant transformation analysis |
| Identification of the aberrant gene expression in precancerous and cancerous lesions by comparing the gene expression of stem-like cells in diseased tissues with normal stem cells |
| Entrez ID | Symbol | Replicates | Species | Organ | Tissue | Adj P-value | Log2FC | Malignancy |
| 113277 | TMEM106A | HCC1_Meng | Human | Liver | HCC | 1.76e-07 | 1.20e-04 | 0.0246 |
| 113277 | TMEM106A | HCC2_Meng | Human | Liver | HCC | 9.71e-05 | 3.86e-02 | 0.0107 |
| 113277 | TMEM106A | HCC1 | Human | Liver | HCC | 9.56e-10 | 1.12e+00 | 0.5336 |
| 113277 | TMEM106A | HCC2 | Human | Liver | HCC | 1.44e-16 | 2.36e+00 | 0.5341 |
| 113277 | TMEM106A | HCC5 | Human | Liver | HCC | 2.46e-17 | 1.44e+00 | 0.4932 |
| 113277 | TMEM106A | S029 | Human | Liver | HCC | 8.93e-05 | 3.37e-01 | 0.2581 |
| Page: 1 |
| Tissue | Expression Dynamics | Abbreviation |
| Liver | 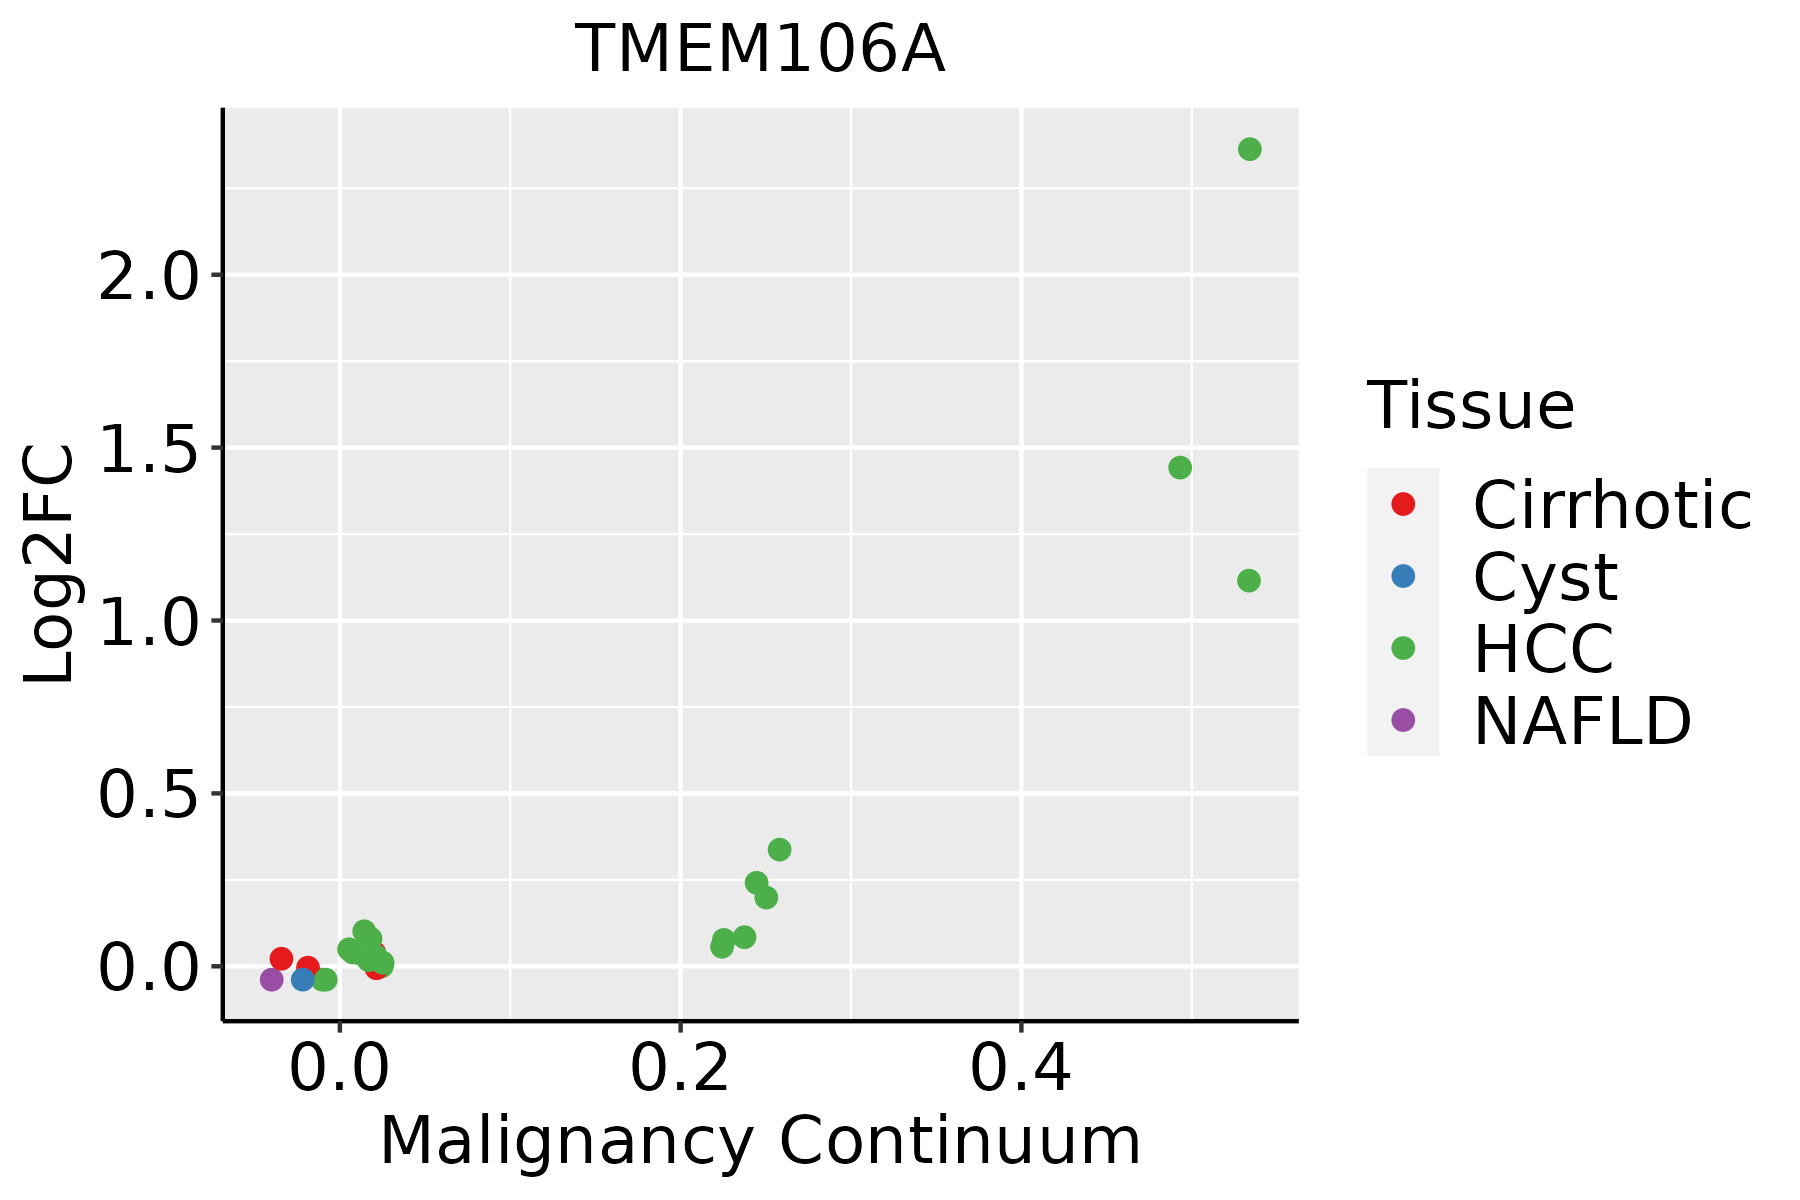 | HCC: Hepatocellular carcinoma |
| NAFLD: Non-alcoholic fatty liver disease |
| ∗log2FC in expression of this searched gene in stem-like cells from each diseased tissue sample relative to stem-like cells in normal samples in each tissue plotted against the malignancy continuum. Samples are colored based on if they are from different disease stage. |
Top |
Malignant transformation related pathway analysis |
| Find out the enriched GO biological processes and KEGG pathways involved in transition from healthy to precancer to cancer |
| Tissue | Disease Stage | Enriched GO biological Processes |
| Colorectum | AD |  |
| Colorectum | SER |  |
| Colorectum | MSS |  |
| Colorectum | MSI-H |  |
| Colorectum | FAP |  |
| ∗Top 15 enriched GO BP terms are showed in the bar plot of each disease state in each tissue. Each row represents a significant GO biological process which is colored according to the -log10(p.adjust). |
| Page: 1 2 3 4 5 6 7 8 9 |
| GO ID | Tissue | Disease Stage | Description | Gene Ratio | Bg Ratio | pvalue | p.adjust | Count |
| GO:000724912 | Liver | HCC | I-kappaB kinase/NF-kappaB signaling | 156/7958 | 281/18723 | 6.66e-06 | 8.00e-05 | 156 |
| GO:004312312 | Liver | HCC | positive regulation of I-kappaB kinase/NF-kappaB signaling | 108/7958 | 186/18723 | 1.28e-05 | 1.43e-04 | 108 |
| GO:004312212 | Liver | HCC | regulation of I-kappaB kinase/NF-kappaB signaling | 138/7958 | 249/18723 | 2.47e-05 | 2.58e-04 | 138 |
| GO:200105722 | Liver | HCC | reactive nitrogen species metabolic process | 51/7958 | 82/18723 | 2.50e-04 | 1.86e-03 | 51 |
| GO:004620922 | Liver | HCC | nitric oxide metabolic process | 50/7958 | 81/18723 | 3.72e-04 | 2.56e-03 | 50 |
| GO:008016422 | Liver | HCC | regulation of nitric oxide metabolic process | 41/7958 | 64/18723 | 4.06e-04 | 2.74e-03 | 41 |
| GO:0009100 | Liver | HCC | glycoprotein metabolic process | 193/7958 | 387/18723 | 1.89e-03 | 9.62e-03 | 193 |
| GO:190440712 | Liver | HCC | positive regulation of nitric oxide metabolic process | 25/7958 | 41/18723 | 1.31e-02 | 4.69e-02 | 25 |
| Page: 1 |
| Pathway ID | Tissue | Disease Stage | Description | Gene Ratio | Bg Ratio | pvalue | p.adjust | qvalue | Count |
| Page: 1 |
Top |
Cell-cell communication analysis |
| Identification of potential cell-cell interactions between two cell types and their ligand-receptor pairs for different disease states |
| Ligand | Receptor | LRpair | Pathway | Tissue | Disease Stage |
| Page: 1 |
Top |
Single-cell gene regulatory network inference analysis |
| Find out the significant the regulons (TFs) and the target genes of each regulon across cell types for different disease states |
| TF | Cell Type | Tissue | Disease Stage | Target Gene | RSS | Regulon Activity |
| ∗The dot plots of a searched regulon are shown for all cell subpopulations in each disease state of each tissue based on the regulon specific score inferred using pySCENIC and by calculating the average expression. |
| Page: 1 |
Top |
Somatic mutation of malignant transformation related genes |
| Annotation of somatic variants for genes involved in malignant transformation |
| Hugo Symbol | Variant Class | Variant Classification | dbSNP RS | HGVSc | HGVSp | HGVSp Short | SWISSPROT | BIOTYPE | SIFT | PolyPhen | Tumor Sample Barcode | Tissue | Histology | Sex | Age | Stage | Therapy Types | Drugs | Outcome |
| TMEM106A | SNV | Missense_Mutation | c.159N>G | p.Asp53Glu | p.D53E | Q96A25 | protein_coding | tolerated(0.43) | benign(0) | TCGA-BH-A1F6-01 | Breast | breast invasive carcinoma | Female | <65 | III/IV | Unknown | Unknown | SD | |
| TMEM106A | insertion | Frame_Shift_Ins | novel | c.180_181insCTTTTCTCATTAGTGAAACCCCCGCCCCTGAAGAATGGGT | p.Thr61LeufsTer87 | p.T61Lfs*87 | Q96A25 | protein_coding | TCGA-A2-A0D1-01 | Breast | breast invasive carcinoma | Female | >=65 | I/II | Chemotherapy | taxotere | SD | ||
| TMEM106A | insertion | In_Frame_Ins | novel | c.421_422insCAGAATTTGTTATCGGCT | p.Asn141delinsThrGluPheValIleGlyTyr | p.N141delinsTEFVIGY | Q96A25 | protein_coding | TCGA-BH-A0HF-01 | Breast | breast invasive carcinoma | Female | >=65 | I/II | Hormone Therapy | arimidex | SD | ||
| TMEM106A | SNV | Missense_Mutation | rs148483239 | c.298G>A | p.Val100Met | p.V100M | Q96A25 | protein_coding | deleterious(0.01) | possibly_damaging(0.781) | TCGA-C5-A2LX-01 | Cervix | cervical & endocervical cancer | Female | <65 | I/II | Chemotherapy | cisplatin | SD |
| TMEM106A | SNV | Missense_Mutation | c.158N>G | p.Asp53Gly | p.D53G | Q96A25 | protein_coding | tolerated(1) | benign(0) | TCGA-AA-A022-01 | Colorectum | colon adenocarcinoma | Female | >=65 | I/II | Unknown | Unknown | SD | |
| TMEM106A | SNV | Missense_Mutation | c.143N>C | p.Cys48Ser | p.C48S | Q96A25 | protein_coding | tolerated(0.21) | benign(0.093) | TCGA-F5-6864-01 | Colorectum | rectum adenocarcinoma | Female | >=65 | III/IV | Chemotherapy | 5-fluorouracil | CR | |
| TMEM106A | SNV | Missense_Mutation | novel | c.266N>A | p.Pro89His | p.P89H | Q96A25 | protein_coding | deleterious(0) | probably_damaging(1) | TCGA-A5-A0G1-01 | Endometrium | uterine corpus endometrioid carcinoma | Female | >=65 | I/II | Unknown | Unknown | SD |
| TMEM106A | SNV | Missense_Mutation | rs141271195 | c.275C>T | p.Thr92Met | p.T92M | Q96A25 | protein_coding | deleterious(0.01) | benign(0.392) | TCGA-AP-A0LM-01 | Endometrium | uterine corpus endometrioid carcinoma | Female | <65 | III/IV | Chemotherapy | cisplatin | SD |
| TMEM106A | SNV | Missense_Mutation | c.407C>T | p.Ala136Val | p.A136V | Q96A25 | protein_coding | tolerated(0.12) | benign(0.091) | TCGA-AP-A0LM-01 | Endometrium | uterine corpus endometrioid carcinoma | Female | <65 | III/IV | Chemotherapy | cisplatin | SD | |
| TMEM106A | SNV | Missense_Mutation | novel | c.466A>G | p.Ile156Val | p.I156V | Q96A25 | protein_coding | tolerated(0.9) | benign(0.031) | TCGA-AX-A2HC-01 | Endometrium | uterine corpus endometrioid carcinoma | Female | <65 | III/IV | Chemotherapy | paclitaxel | PD |
| Page: 1 2 3 |
Top |
Related drugs of malignant transformation related genes |
| Identification of chemicals and drugs interact with genes involved in malignant transfromation |
| (DGIdb 4.0) |
| Entrez ID | Symbol | Category | Interaction Types | Drug Claim Name | Drug Name | PMIDs |
| Page: 1 |

Copyright 2023-Present -The University of Texas Health Science Center at Houston |