
|
|||||
|
 | |
| |
| |
| |
| |
| |
|
Gene: TMEM101 |
Gene summary for TMEM101 |
| Gene information | Species | Human | Gene symbol | TMEM101 | Gene ID | 84336 |
| Gene name | transmembrane protein 101 | |
| Gene Alias | TMEM101 | |
| Cytomap | 17q21.31 | |
| Gene Type | protein-coding | GO ID | GO:0007154 | UniProtAcc | B4DFS4 |
Top |
Malignant transformation analysis |
| Identification of the aberrant gene expression in precancerous and cancerous lesions by comparing the gene expression of stem-like cells in diseased tissues with normal stem cells |
| Entrez ID | Symbol | Replicates | Species | Organ | Tissue | Adj P-value | Log2FC | Malignancy |
| 84336 | TMEM101 | AEH-subject2 | Human | Endometrium | AEH | 1.30e-04 | -7.53e-02 | -0.2525 |
| 84336 | TMEM101 | AEH-subject3 | Human | Endometrium | AEH | 4.14e-05 | 3.37e-01 | -0.2576 |
| 84336 | TMEM101 | EEC-subject3 | Human | Endometrium | EEC | 8.84e-29 | -5.92e-01 | -0.2525 |
| 84336 | TMEM101 | GSM5276934 | Human | Endometrium | EEC | 2.41e-25 | -6.13e-01 | -0.0913 |
| 84336 | TMEM101 | GSM5276937 | Human | Endometrium | EEC | 4.13e-16 | -5.28e-01 | -0.0897 |
| 84336 | TMEM101 | GSM6177620_NYU_UCEC1_lib1_lib1 | Human | Endometrium | EEC | 7.49e-19 | -3.93e-01 | -0.1869 |
| 84336 | TMEM101 | GSM6177620_NYU_UCEC1_lib2_lib2 | Human | Endometrium | EEC | 8.25e-19 | -4.92e-01 | -0.1875 |
| 84336 | TMEM101 | GSM6177620_NYU_UCEC1_lib3_lib3 | Human | Endometrium | EEC | 2.22e-18 | -3.65e-01 | -0.1883 |
| 84336 | TMEM101 | GSM6177621_NYU_UCEC2_lib1_lib1 | Human | Endometrium | EEC | 3.06e-08 | 2.03e-01 | -0.1934 |
| 84336 | TMEM101 | GSM6177622_NYU_UCEC3_lib1_lib1 | Human | Endometrium | EEC | 2.64e-20 | -1.36e-01 | -0.1917 |
| 84336 | TMEM101 | GSM6177622_NYU_UCEC3_lib2_lib2 | Human | Endometrium | EEC | 1.87e-27 | -2.33e-01 | -0.1916 |
| 84336 | TMEM101 | GSM6177623_NYU_UCEC3_Vis | Human | Endometrium | EEC | 4.64e-07 | 4.37e-01 | -0.1269 |
| 84336 | TMEM101 | LZE4T | Human | Esophagus | ESCC | 7.92e-11 | 2.87e-01 | 0.0811 |
| 84336 | TMEM101 | LZE7T | Human | Esophagus | ESCC | 3.04e-08 | 2.84e-01 | 0.0667 |
| 84336 | TMEM101 | LZE8T | Human | Esophagus | ESCC | 4.76e-06 | 1.87e-01 | 0.067 |
| 84336 | TMEM101 | LZE22T | Human | Esophagus | ESCC | 1.43e-04 | 2.68e-01 | 0.068 |
| 84336 | TMEM101 | LZE24T | Human | Esophagus | ESCC | 1.00e-17 | 6.17e-01 | 0.0596 |
| 84336 | TMEM101 | LZE6T | Human | Esophagus | ESCC | 3.00e-03 | 3.43e-01 | 0.0845 |
| 84336 | TMEM101 | P1T-E | Human | Esophagus | ESCC | 1.24e-02 | 3.80e-01 | 0.0875 |
| 84336 | TMEM101 | P2T-E | Human | Esophagus | ESCC | 1.58e-31 | 5.46e-01 | 0.1177 |
| Page: 1 2 3 4 5 6 7 |
| Tissue | Expression Dynamics | Abbreviation |
| Endometrium |  | AEH: Atypical endometrial hyperplasia |
| EEC: Endometrioid Cancer | ||
| Esophagus |  | ESCC: Esophageal squamous cell carcinoma |
| HGIN: High-grade intraepithelial neoplasias | ||
| LGIN: Low-grade intraepithelial neoplasias | ||
| Liver | 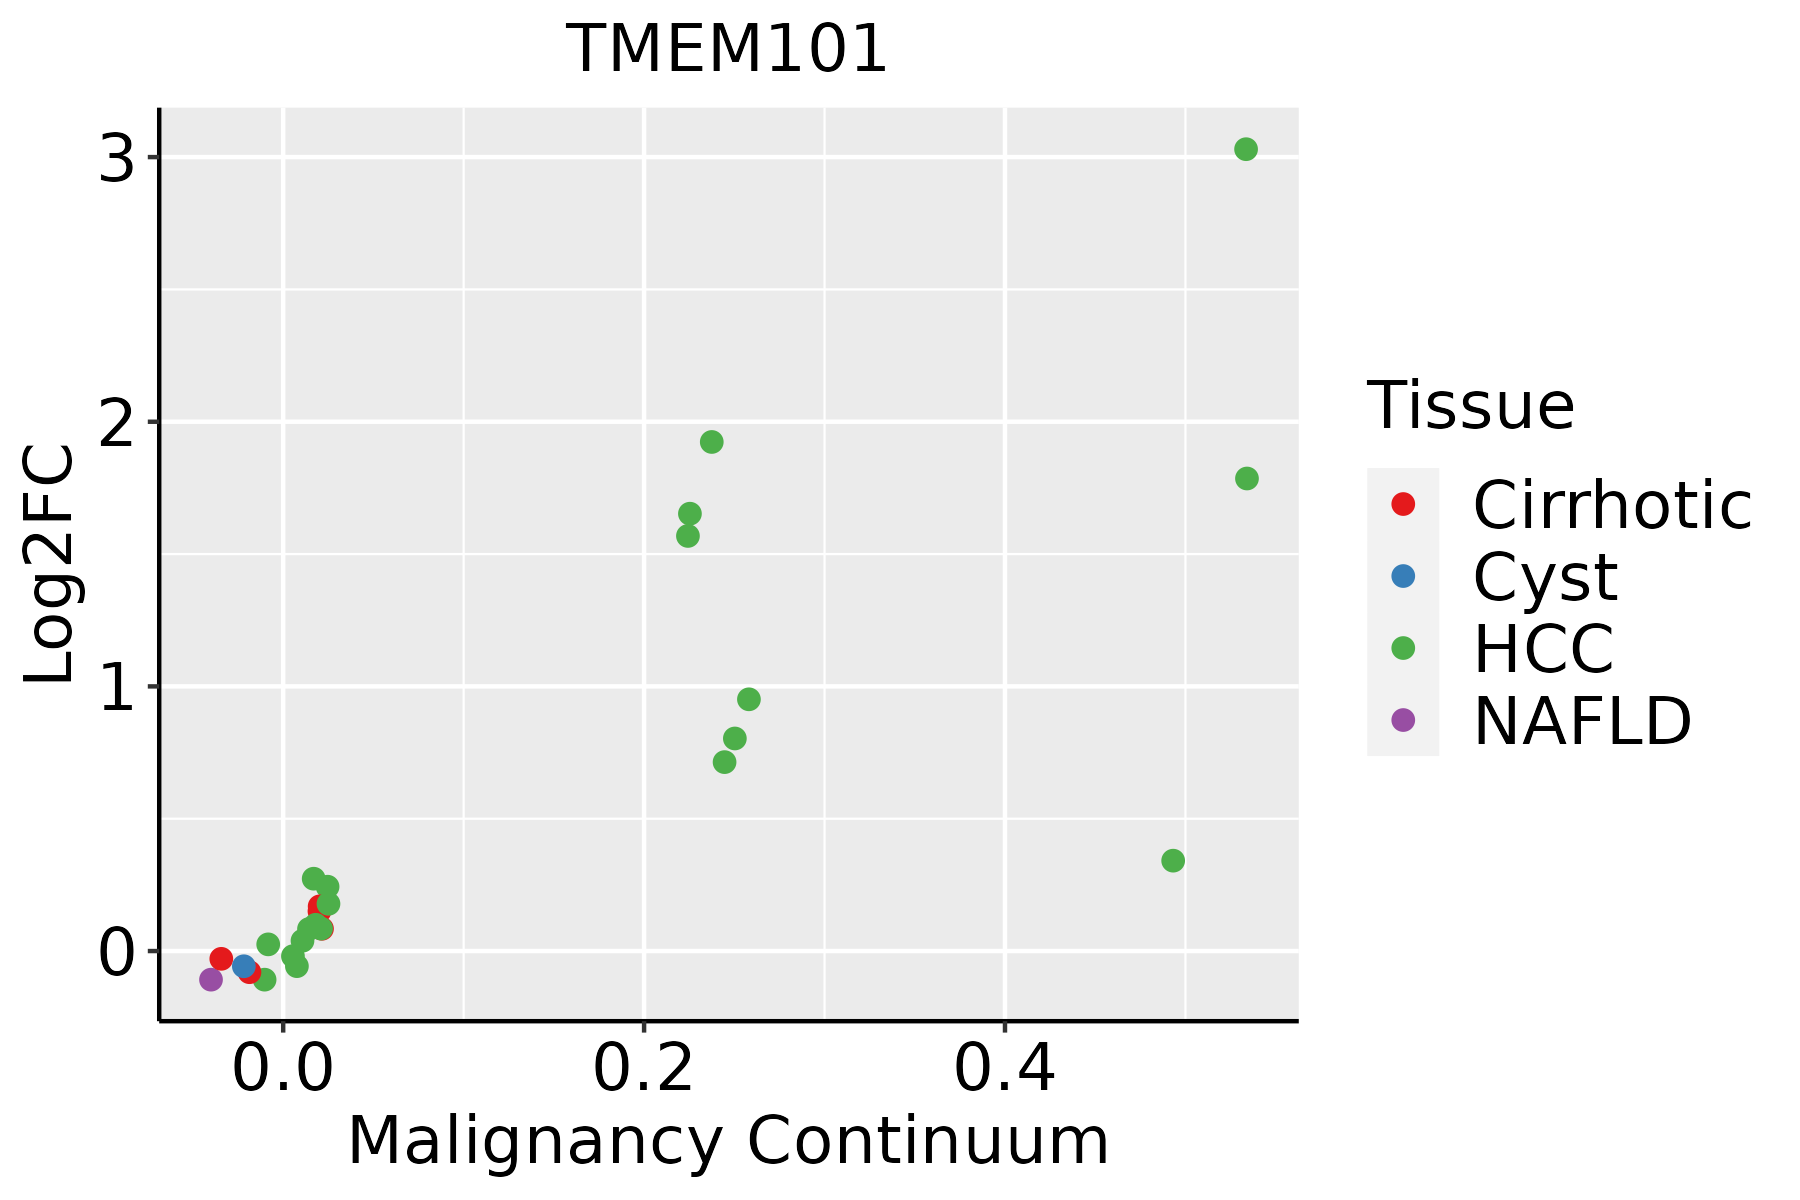 | HCC: Hepatocellular carcinoma |
| NAFLD: Non-alcoholic fatty liver disease | ||
| Oral Cavity |  | EOLP: Erosive Oral lichen planus |
| LP: leukoplakia | ||
| NEOLP: Non-erosive oral lichen planus | ||
| OSCC: Oral squamous cell carcinoma | ||
| Skin | 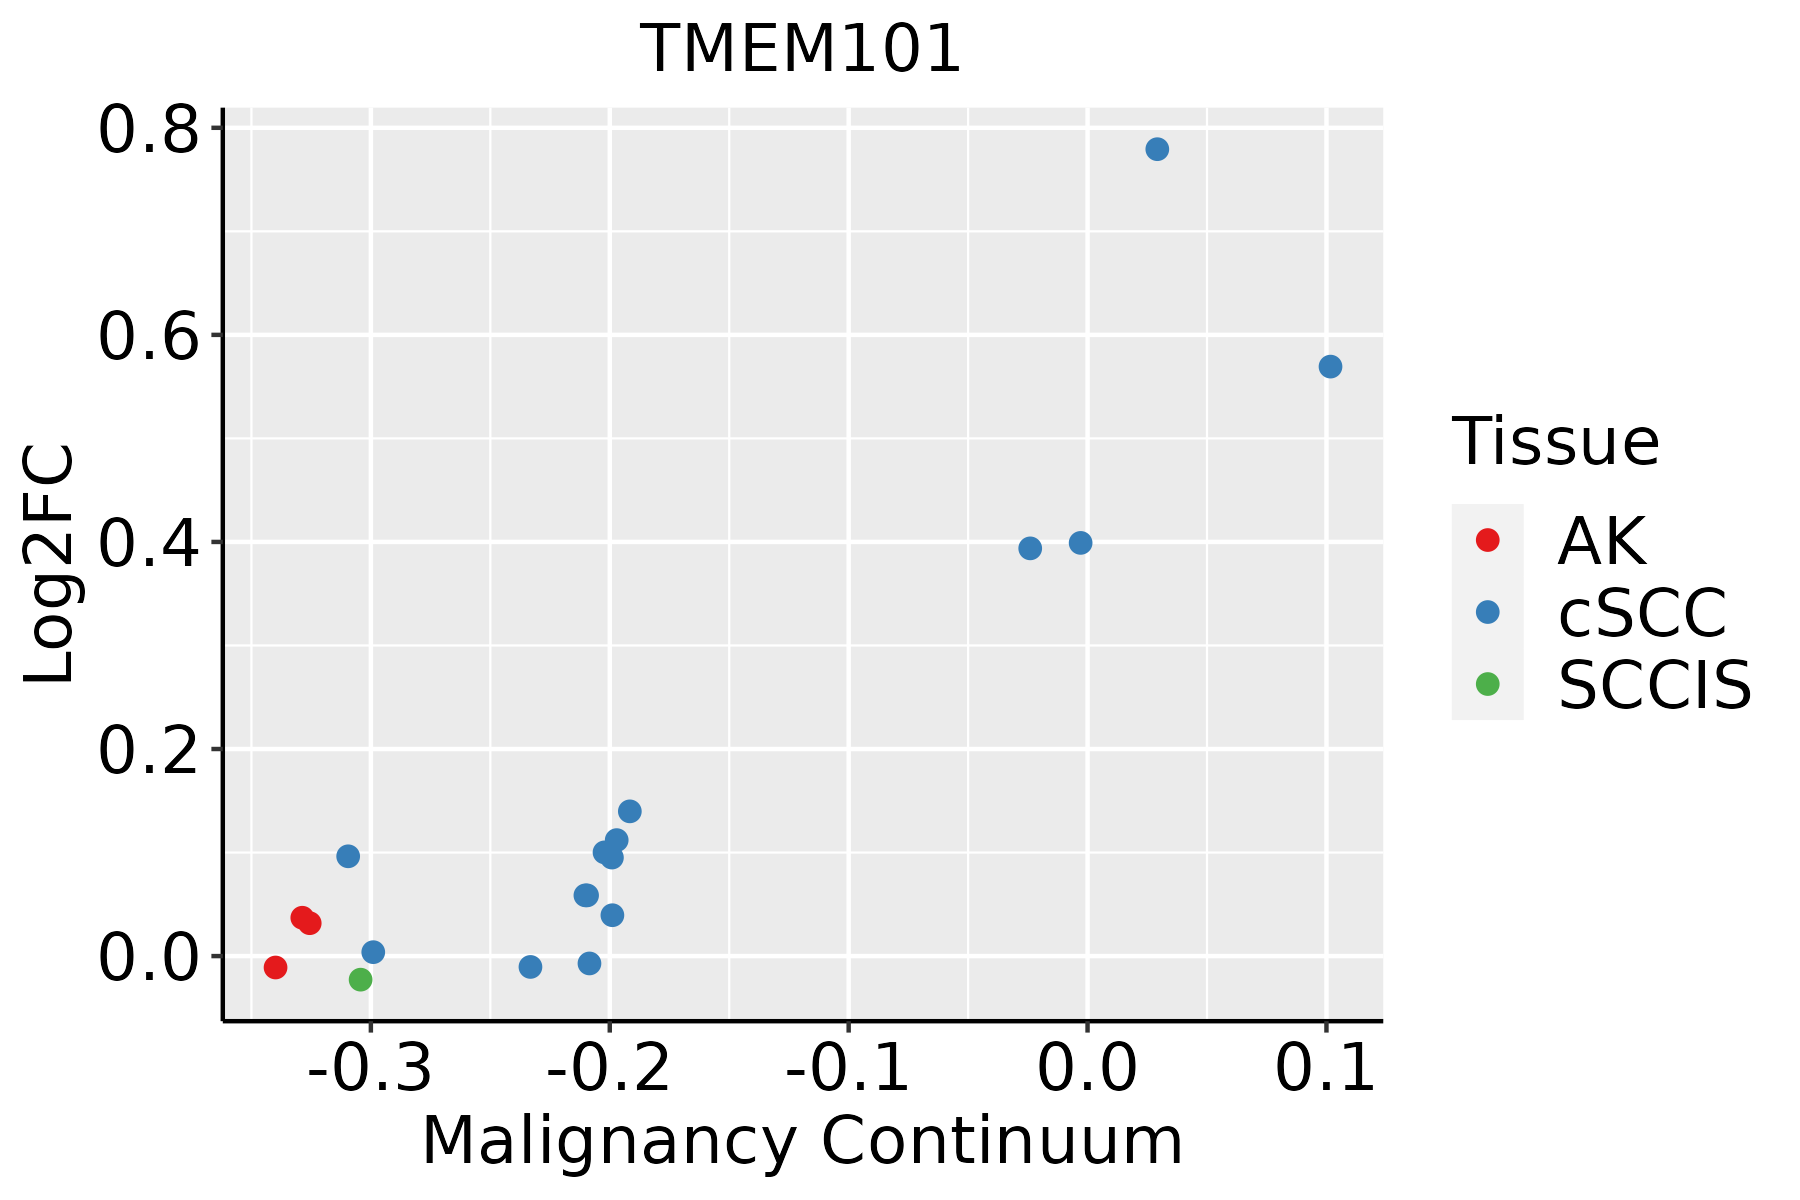 | AK: Actinic keratosis |
| cSCC: Cutaneous squamous cell carcinoma | ||
| SCCIS:squamous cell carcinoma in situ | ||
| Thyroid |  | ATC: Anaplastic thyroid cancer |
| HT: Hashimoto's thyroiditis | ||
| PTC: Papillary thyroid cancer |
| ∗log2FC in expression of this searched gene in stem-like cells from each diseased tissue sample relative to stem-like cells in normal samples in each tissue plotted against the malignancy continuum. Samples are colored based on if they are from different disease stage. |
Top |
Malignant transformation related pathway analysis |
| Find out the enriched GO biological processes and KEGG pathways involved in transition from healthy to precancer to cancer |
| Tissue | Disease Stage | Enriched GO biological Processes |
| Colorectum | AD |  |
| Colorectum | SER |  |
| Colorectum | MSS |  |
| Colorectum | MSI-H |  |
| Colorectum | FAP |  |
| ∗Top 15 enriched GO BP terms are showed in the bar plot of each disease state in each tissue. Each row represents a significant GO biological process which is colored according to the -log10(p.adjust). |
| Page: 1 2 3 4 5 6 7 8 9 |
| GO ID | Tissue | Disease Stage | Description | Gene Ratio | Bg Ratio | pvalue | p.adjust | Count |
| GO:00431229 | Endometrium | AEH | regulation of I-kappaB kinase/NF-kappaB signaling | 52/2100 | 249/18723 | 6.58e-06 | 1.59e-04 | 52 |
| GO:00431238 | Endometrium | AEH | positive regulation of I-kappaB kinase/NF-kappaB signaling | 41/2100 | 186/18723 | 1.59e-05 | 3.32e-04 | 41 |
| GO:00072498 | Endometrium | AEH | I-kappaB kinase/NF-kappaB signaling | 55/2100 | 281/18723 | 2.60e-05 | 4.88e-04 | 55 |
| GO:004312216 | Endometrium | EEC | regulation of I-kappaB kinase/NF-kappaB signaling | 53/2168 | 249/18723 | 7.59e-06 | 1.73e-04 | 53 |
| GO:004312314 | Endometrium | EEC | positive regulation of I-kappaB kinase/NF-kappaB signaling | 42/2168 | 186/18723 | 1.47e-05 | 2.87e-04 | 42 |
| GO:000724915 | Endometrium | EEC | I-kappaB kinase/NF-kappaB signaling | 57/2168 | 281/18723 | 1.60e-05 | 3.12e-04 | 57 |
| GO:004312318 | Esophagus | ESCC | positive regulation of I-kappaB kinase/NF-kappaB signaling | 132/8552 | 186/18723 | 2.07e-12 | 8.58e-11 | 132 |
| GO:0043122110 | Esophagus | ESCC | regulation of I-kappaB kinase/NF-kappaB signaling | 167/8552 | 249/18723 | 6.11e-12 | 2.32e-10 | 167 |
| GO:000724919 | Esophagus | ESCC | I-kappaB kinase/NF-kappaB signaling | 183/8552 | 281/18723 | 3.02e-11 | 1.01e-09 | 183 |
| GO:00072494 | Liver | Cirrhotic | I-kappaB kinase/NF-kappaB signaling | 108/4634 | 281/18723 | 2.21e-07 | 5.64e-06 | 108 |
| GO:00431225 | Liver | Cirrhotic | regulation of I-kappaB kinase/NF-kappaB signaling | 95/4634 | 249/18723 | 1.68e-06 | 3.22e-05 | 95 |
| GO:00431234 | Liver | Cirrhotic | positive regulation of I-kappaB kinase/NF-kappaB signaling | 71/4634 | 186/18723 | 3.20e-05 | 3.97e-04 | 71 |
| GO:000724912 | Liver | HCC | I-kappaB kinase/NF-kappaB signaling | 156/7958 | 281/18723 | 6.66e-06 | 8.00e-05 | 156 |
| GO:004312312 | Liver | HCC | positive regulation of I-kappaB kinase/NF-kappaB signaling | 108/7958 | 186/18723 | 1.28e-05 | 1.43e-04 | 108 |
| GO:004312212 | Liver | HCC | regulation of I-kappaB kinase/NF-kappaB signaling | 138/7958 | 249/18723 | 2.47e-05 | 2.58e-04 | 138 |
| GO:004312218 | Oral cavity | OSCC | regulation of I-kappaB kinase/NF-kappaB signaling | 155/7305 | 249/18723 | 7.79e-14 | 4.14e-12 | 155 |
| GO:004312310 | Oral cavity | OSCC | positive regulation of I-kappaB kinase/NF-kappaB signaling | 122/7305 | 186/18723 | 1.68e-13 | 8.52e-12 | 122 |
| GO:000724910 | Oral cavity | OSCC | I-kappaB kinase/NF-kappaB signaling | 169/7305 | 281/18723 | 4.69e-13 | 2.25e-11 | 169 |
| GO:004312316 | Oral cavity | LP | positive regulation of I-kappaB kinase/NF-kappaB signaling | 88/4623 | 186/18723 | 1.58e-11 | 1.13e-09 | 88 |
| GO:004312219 | Oral cavity | LP | regulation of I-kappaB kinase/NF-kappaB signaling | 103/4623 | 249/18723 | 4.48e-09 | 1.90e-07 | 103 |
| Page: 1 2 |
| Pathway ID | Tissue | Disease Stage | Description | Gene Ratio | Bg Ratio | pvalue | p.adjust | qvalue | Count |
| Page: 1 |
Top |
Cell-cell communication analysis |
| Identification of potential cell-cell interactions between two cell types and their ligand-receptor pairs for different disease states |
| Ligand | Receptor | LRpair | Pathway | Tissue | Disease Stage |
| Page: 1 |
Top |
Single-cell gene regulatory network inference analysis |
| Find out the significant the regulons (TFs) and the target genes of each regulon across cell types for different disease states |
| TF | Cell Type | Tissue | Disease Stage | Target Gene | RSS | Regulon Activity |
| ∗The dot plots of a searched regulon are shown for all cell subpopulations in each disease state of each tissue based on the regulon specific score inferred using pySCENIC and by calculating the average expression. |
| Page: 1 |
Top |
Somatic mutation of malignant transformation related genes |
| Annotation of somatic variants for genes involved in malignant transformation |
| Hugo Symbol | Variant Class | Variant Classification | dbSNP RS | HGVSc | HGVSp | HGVSp Short | SWISSPROT | BIOTYPE | SIFT | PolyPhen | Tumor Sample Barcode | Tissue | Histology | Sex | Age | Stage | Therapy Types | Drugs | Outcome |
| TMEM101 | SNV | Missense_Mutation | novel | c.604N>A | p.Leu202Ile | p.L202I | Q96IK0 | protein_coding | tolerated(0.33) | benign(0.024) | TCGA-AR-A2LO-01 | Breast | breast invasive carcinoma | Female | <65 | I/II | Chemotherapy | adriamycin | SD |
| TMEM101 | SNV | Missense_Mutation | c.726G>C | p.Glu242Asp | p.E242D | Q96IK0 | protein_coding | tolerated(0.42) | benign(0.08) | TCGA-IR-A3LH-01 | Cervix | cervical & endocervical cancer | Female | <65 | I/II | Chemotherapy | cisplatin | CR | |
| TMEM101 | SNV | Missense_Mutation | c.247N>A | p.Ala83Thr | p.A83T | Q96IK0 | protein_coding | deleterious(0) | benign(0.39) | TCGA-A6-2686-01 | Colorectum | colon adenocarcinoma | Female | >=65 | I/II | Unknown | Unknown | SD | |
| TMEM101 | SNV | Missense_Mutation | c.290N>A | p.Gly97Asp | p.G97D | Q96IK0 | protein_coding | tolerated(0.6) | benign(0.375) | TCGA-AA-3864-01 | Colorectum | colon adenocarcinoma | Male | >=65 | I/II | Unknown | Unknown | SD | |
| TMEM101 | SNV | Missense_Mutation | c.196G>A | p.Ala66Thr | p.A66T | Q96IK0 | protein_coding | deleterious(0.01) | benign(0.39) | TCGA-D5-6540-01 | Colorectum | colon adenocarcinoma | Male | >=65 | I/II | Unknown | Unknown | SD | |
| TMEM101 | SNV | Missense_Mutation | novel | c.634N>T | p.Pro212Ser | p.P212S | Q96IK0 | protein_coding | tolerated(0.38) | probably_damaging(0.996) | TCGA-AP-A1DK-01 | Endometrium | uterine corpus endometrioid carcinoma | Female | <65 | I/II | Unknown | Unknown | SD |
| TMEM101 | SNV | Missense_Mutation | novel | c.80N>T | p.Pro27Leu | p.P27L | Q96IK0 | protein_coding | deleterious(0.02) | benign(0.003) | TCGA-AP-A1DV-01 | Endometrium | uterine corpus endometrioid carcinoma | Female | <65 | I/II | Unknown | Unknown | SD |
| TMEM101 | SNV | Missense_Mutation | c.710T>C | p.Met237Thr | p.M237T | Q96IK0 | protein_coding | deleterious(0.02) | benign(0.099) | TCGA-AX-A063-01 | Endometrium | uterine corpus endometrioid carcinoma | Female | <65 | I/II | Unknown | Unknown | SD | |
| TMEM101 | SNV | Missense_Mutation | novel | c.217N>A | p.Val73Met | p.V73M | Q96IK0 | protein_coding | tolerated(0.19) | probably_damaging(0.995) | TCGA-AX-A1CE-01 | Endometrium | uterine corpus endometrioid carcinoma | Female | <65 | I/II | Unspecific | Paclitaxel | SD |
| TMEM101 | SNV | Missense_Mutation | rs759192533 | c.395N>A | p.Arg132His | p.R132H | Q96IK0 | protein_coding | deleterious(0.01) | probably_damaging(0.991) | TCGA-AX-A2HD-01 | Endometrium | uterine corpus endometrioid carcinoma | Female | >=65 | III/IV | Unknown | Unknown | SD |
| Page: 1 2 3 |
Top |
Related drugs of malignant transformation related genes |
| Identification of chemicals and drugs interact with genes involved in malignant transfromation |
| (DGIdb 4.0) |
| Entrez ID | Symbol | Category | Interaction Types | Drug Claim Name | Drug Name | PMIDs |
| Page: 1 |

Copyright 2023-Present -The University of Texas Health Science Center at Houston |