
|
|||||
|
 | |
| |
| |
| |
| |
| |
|
Gene: TMEFF1 |
Gene summary for TMEFF1 |
| Gene information | Species | Human | Gene symbol | TMEFF1 | Gene ID | 8577 |
| Gene name | transmembrane protein with EGF like and two follistatin like domains 1 | |
| Gene Alias | C9orf2 | |
| Cytomap | 9q31.1 | |
| Gene Type | protein-coding | GO ID | GO:0000902 | UniProtAcc | Q8IYR6 |
Top |
Malignant transformation analysis |
| Identification of the aberrant gene expression in precancerous and cancerous lesions by comparing the gene expression of stem-like cells in diseased tissues with normal stem cells |
| Entrez ID | Symbol | Replicates | Species | Organ | Tissue | Adj P-value | Log2FC | Malignancy |
| 8577 | TMEFF1 | HTA11_3410_2000001011 | Human | Colorectum | AD | 1.23e-04 | 1.33e-01 | 0.0155 |
| 8577 | TMEFF1 | HTA11_2487_2000001011 | Human | Colorectum | SER | 7.05e-06 | 1.71e-01 | -0.1808 |
| 8577 | TMEFF1 | HTA11_78_2000001011 | Human | Colorectum | AD | 1.66e-02 | 1.38e-01 | -0.1088 |
| 8577 | TMEFF1 | HTA11_347_2000001011 | Human | Colorectum | AD | 4.38e-15 | 2.83e-01 | -0.1954 |
| 8577 | TMEFF1 | HTA11_2112_2000001011 | Human | Colorectum | SER | 1.90e-02 | 2.76e-01 | -0.2196 |
| 8577 | TMEFF1 | HTA11_3361_2000001011 | Human | Colorectum | AD | 7.49e-10 | 2.88e-01 | -0.1207 |
| 8577 | TMEFF1 | HTA11_83_2000001011 | Human | Colorectum | SER | 4.23e-03 | 1.63e-01 | -0.1526 |
| 8577 | TMEFF1 | HTA11_696_2000001011 | Human | Colorectum | AD | 1.26e-15 | 3.09e-01 | -0.1464 |
| 8577 | TMEFF1 | HTA11_866_2000001011 | Human | Colorectum | AD | 2.00e-05 | 1.44e-01 | -0.1001 |
| 8577 | TMEFF1 | HTA11_1391_2000001011 | Human | Colorectum | AD | 2.44e-13 | 3.60e-01 | -0.059 |
| 8577 | TMEFF1 | HTA11_2992_2000001011 | Human | Colorectum | SER | 1.09e-02 | 2.39e-01 | -0.1706 |
| 8577 | TMEFF1 | HTA11_5212_2000001011 | Human | Colorectum | AD | 1.21e-08 | 3.63e-01 | -0.2061 |
| 8577 | TMEFF1 | HTA11_5216_2000001011 | Human | Colorectum | SER | 9.20e-14 | 4.90e-01 | -0.1462 |
| 8577 | TMEFF1 | HTA11_7862_2000001011 | Human | Colorectum | AD | 7.36e-06 | 2.52e-01 | -0.0179 |
| 8577 | TMEFF1 | HTA11_866_3004761011 | Human | Colorectum | AD | 1.58e-03 | 1.24e-01 | 0.096 |
| 8577 | TMEFF1 | HTA11_7663_2000001011 | Human | Colorectum | SER | 7.26e-05 | 3.09e-01 | 0.0131 |
| 8577 | TMEFF1 | HTA11_10623_2000001011 | Human | Colorectum | AD | 4.30e-12 | 5.17e-01 | -0.0177 |
| 8577 | TMEFF1 | HTA11_6801_2000001011 | Human | Colorectum | SER | 1.85e-04 | 3.29e-01 | 0.0171 |
| 8577 | TMEFF1 | HTA11_10711_2000001011 | Human | Colorectum | AD | 3.12e-25 | 7.13e-01 | 0.0338 |
| 8577 | TMEFF1 | HTA11_7696_3000711011 | Human | Colorectum | AD | 3.52e-13 | 2.75e-01 | 0.0674 |
| Page: 1 2 |
| Tissue | Expression Dynamics | Abbreviation |
| Colorectum (GSE201348) | 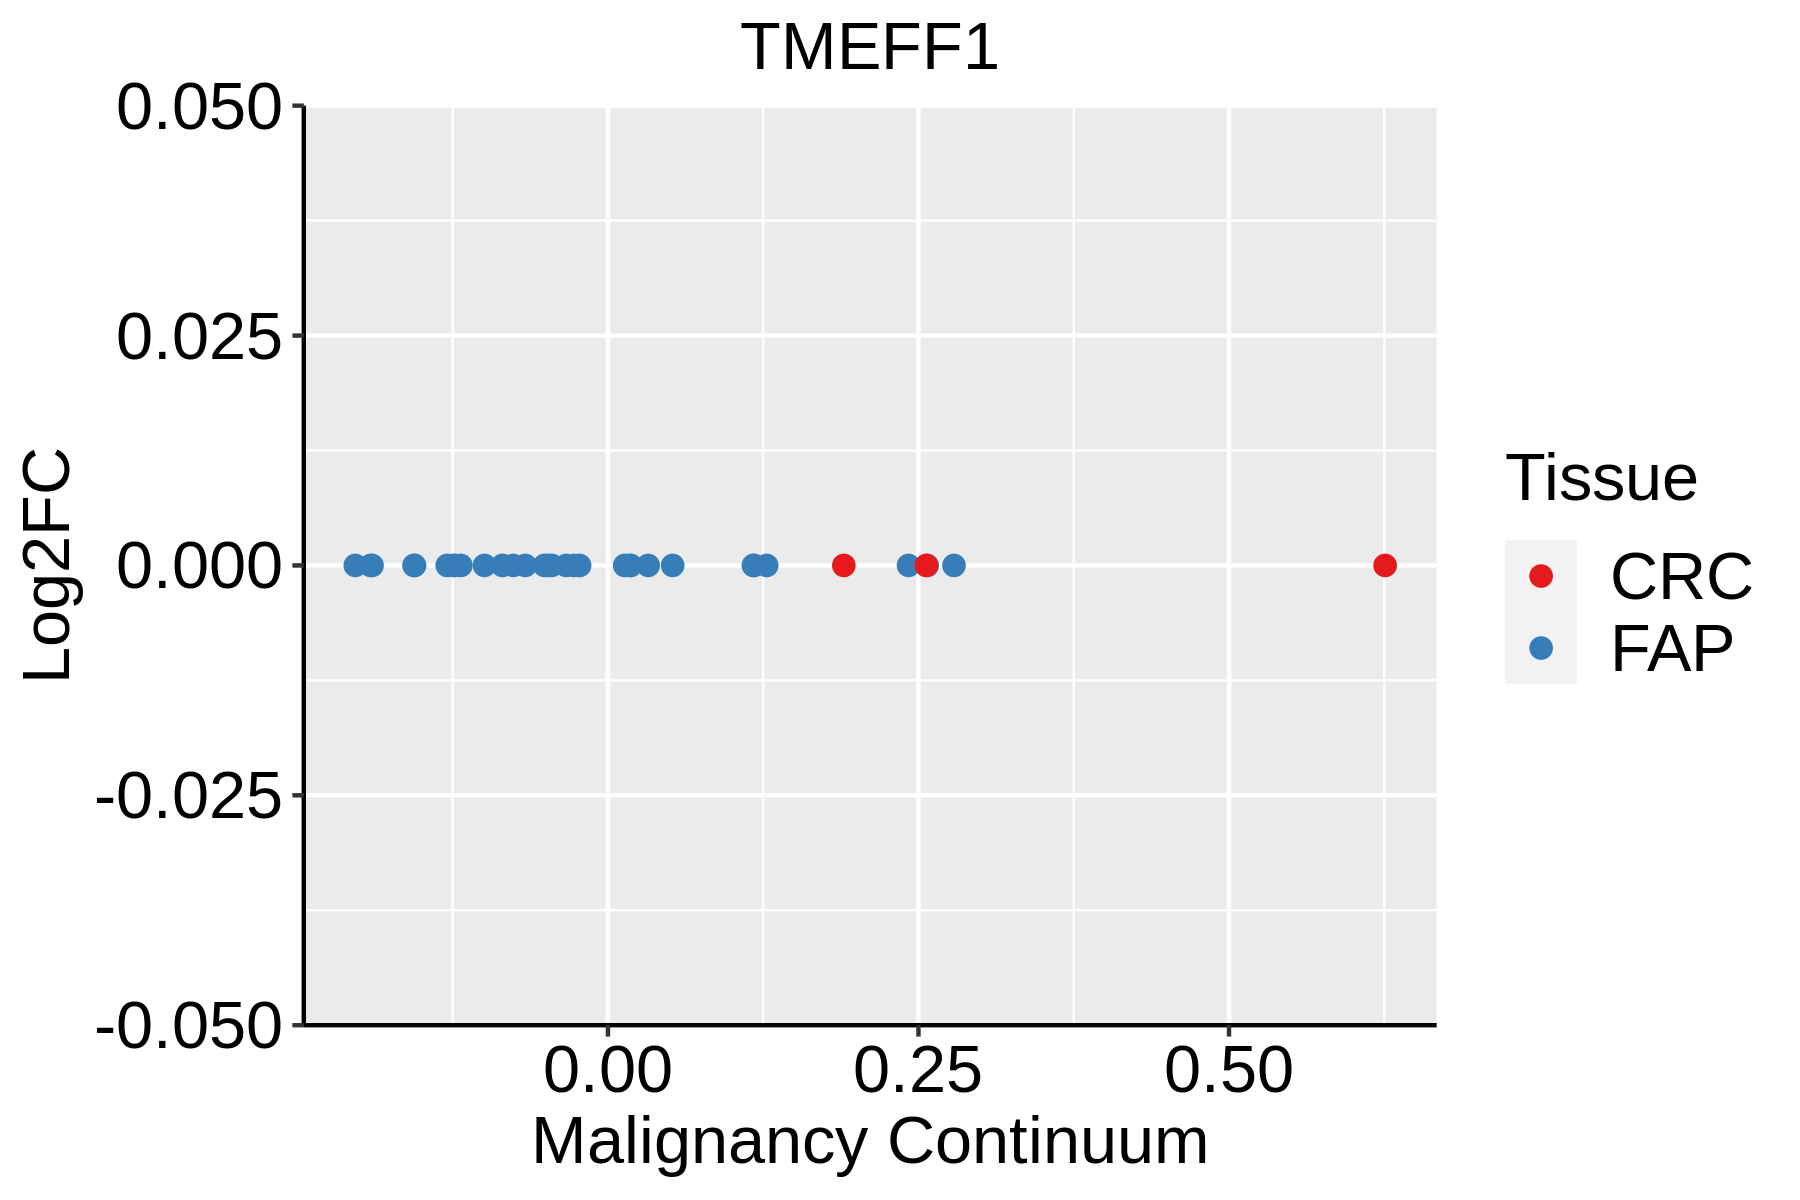 | FAP: Familial adenomatous polyposis |
| CRC: Colorectal cancer | ||
| Colorectum (HTA11) |  | AD: Adenomas |
| SER: Sessile serrated lesions | ||
| MSI-H: Microsatellite-high colorectal cancer | ||
| MSS: Microsatellite stable colorectal cancer |
| ∗log2FC in expression of this searched gene in stem-like cells from each diseased tissue sample relative to stem-like cells in normal samples in each tissue plotted against the malignancy continuum. Samples are colored based on if they are from different disease stage. |
Top |
Malignant transformation related pathway analysis |
| Find out the enriched GO biological processes and KEGG pathways involved in transition from healthy to precancer to cancer |
| Tissue | Disease Stage | Enriched GO biological Processes |
| Colorectum | AD |  |
| Colorectum | SER |  |
| Colorectum | MSS |  |
| Colorectum | MSI-H |  |
| Colorectum | FAP |  |
| ∗Top 15 enriched GO BP terms are showed in the bar plot of each disease state in each tissue. Each row represents a significant GO biological process which is colored according to the -log10(p.adjust). |
| Page: 1 2 3 4 5 6 7 8 9 |
| GO ID | Tissue | Disease Stage | Description | Gene Ratio | Bg Ratio | pvalue | p.adjust | Count |
| GO:0007409 | Colorectum | AD | axonogenesis | 122/3918 | 418/18723 | 3.36e-05 | 6.15e-04 | 122 |
| GO:0061564 | Colorectum | AD | axon development | 132/3918 | 467/18723 | 8.40e-05 | 1.31e-03 | 132 |
| GO:0016358 | Colorectum | AD | dendrite development | 69/3918 | 243/18723 | 3.32e-03 | 2.42e-02 | 69 |
| GO:0007411 | Colorectum | AD | axon guidance | 64/3918 | 227/18723 | 5.41e-03 | 3.55e-02 | 64 |
| GO:0097485 | Colorectum | AD | neuron projection guidance | 64/3918 | 228/18723 | 6.02e-03 | 3.78e-02 | 64 |
| GO:00163581 | Colorectum | SER | dendrite development | 58/2897 | 243/18723 | 3.82e-04 | 5.81e-03 | 58 |
| GO:00074111 | Colorectum | SER | axon guidance | 51/2897 | 227/18723 | 3.29e-03 | 2.82e-02 | 51 |
| GO:00974851 | Colorectum | SER | neuron projection guidance | 51/2897 | 228/18723 | 3.61e-03 | 3.03e-02 | 51 |
| GO:00615641 | Colorectum | SER | axon development | 94/2897 | 467/18723 | 3.78e-03 | 3.13e-02 | 94 |
| GO:00074091 | Colorectum | SER | axonogenesis | 84/2897 | 418/18723 | 6.20e-03 | 4.49e-02 | 84 |
| GO:00074092 | Colorectum | MSS | axonogenesis | 105/3467 | 418/18723 | 4.32e-04 | 5.23e-03 | 105 |
| GO:00615642 | Colorectum | MSS | axon development | 115/3467 | 467/18723 | 5.33e-04 | 6.00e-03 | 115 |
| GO:00163582 | Colorectum | MSS | dendrite development | 65/3467 | 243/18723 | 9.41e-04 | 9.50e-03 | 65 |
| Page: 1 |
| Pathway ID | Tissue | Disease Stage | Description | Gene Ratio | Bg Ratio | pvalue | p.adjust | qvalue | Count |
| Page: 1 |
Top |
Cell-cell communication analysis |
| Identification of potential cell-cell interactions between two cell types and their ligand-receptor pairs for different disease states |
| Ligand | Receptor | LRpair | Pathway | Tissue | Disease Stage |
| Page: 1 |
Top |
Single-cell gene regulatory network inference analysis |
| Find out the significant the regulons (TFs) and the target genes of each regulon across cell types for different disease states |
| TF | Cell Type | Tissue | Disease Stage | Target Gene | RSS | Regulon Activity |
| ∗The dot plots of a searched regulon are shown for all cell subpopulations in each disease state of each tissue based on the regulon specific score inferred using pySCENIC and by calculating the average expression. |
| Page: 1 |
Top |
Somatic mutation of malignant transformation related genes |
| Annotation of somatic variants for genes involved in malignant transformation |
| Hugo Symbol | Variant Class | Variant Classification | dbSNP RS | HGVSc | HGVSp | HGVSp Short | SWISSPROT | BIOTYPE | SIFT | PolyPhen | Tumor Sample Barcode | Tissue | Histology | Sex | Age | Stage | Therapy Types | Drugs | Outcome |
| TMEFF1 | SNV | Missense_Mutation | novel | c.928T>C | p.Cys310Arg | p.C310R | Q8IYR6 | protein_coding | deleterious(0) | probably_damaging(1) | TCGA-A8-A09Z-01 | Breast | breast invasive carcinoma | Female | >=65 | I/II | Unknown | Unknown | SD |
| TMEFF1 | SNV | Missense_Mutation | rs759318448 | c.799N>A | p.Val267Ile | p.V267I | Q8IYR6 | protein_coding | tolerated(0.4) | benign(0.003) | TCGA-AN-A046-01 | Breast | breast invasive carcinoma | Female | >=65 | I/II | Unknown | Unknown | SD |
| TMEFF1 | SNV | Missense_Mutation | rs541170958 | c.1088N>A | p.Arg363Gln | p.R363Q | Q8IYR6 | protein_coding | deleterious(0) | probably_damaging(0.976) | TCGA-2W-A8YY-01 | Cervix | cervical & endocervical cancer | Female | <65 | I/II | Chemotherapy | cisplatin | CR |
| TMEFF1 | SNV | Missense_Mutation | c.904G>A | p.Glu302Lys | p.E302K | Q8IYR6 | protein_coding | deleterious(0.02) | possibly_damaging(0.566) | TCGA-AA-A00N-01 | Colorectum | colon adenocarcinoma | Male | >=65 | I/II | Unknown | Unknown | PD | |
| TMEFF1 | SNV | Missense_Mutation | c.396G>T | p.Gln132His | p.Q132H | Q8IYR6 | protein_coding | deleterious(0.02) | benign(0.443) | TCGA-AA-A010-01 | Colorectum | colon adenocarcinoma | Female | <65 | I/II | Chemotherapy | folinic | CR | |
| TMEFF1 | SNV | Missense_Mutation | rs139218600 | c.1069N>C | p.Lys357Gln | p.K357Q | Q8IYR6 | protein_coding | deleterious(0.04) | probably_damaging(0.94) | TCGA-AA-A02R-01 | Colorectum | colon adenocarcinoma | Female | >=65 | I/II | Unknown | Unknown | PD |
| TMEFF1 | SNV | Missense_Mutation | novel | c.600N>G | p.Asn200Lys | p.N200K | Q8IYR6 | protein_coding | deleterious(0.04) | probably_damaging(0.992) | TCGA-AZ-4315-01 | Colorectum | colon adenocarcinoma | Male | <65 | I/II | Unknown | Unknown | SD |
| TMEFF1 | SNV | Missense_Mutation | novel | c.952N>T | p.Leu318Phe | p.L318F | Q8IYR6 | protein_coding | deleterious(0) | probably_damaging(0.992) | TCGA-AZ-4315-01 | Colorectum | colon adenocarcinoma | Male | <65 | I/II | Unknown | Unknown | SD |
| TMEFF1 | SNV | Missense_Mutation | rs541170958 | c.1088N>A | p.Arg363Gln | p.R363Q | Q8IYR6 | protein_coding | deleterious(0) | probably_damaging(0.976) | TCGA-AZ-4315-01 | Colorectum | colon adenocarcinoma | Male | <65 | I/II | Unknown | Unknown | SD |
| TMEFF1 | SNV | Missense_Mutation | novel | c.468G>T | p.Glu156Asp | p.E156D | Q8IYR6 | protein_coding | tolerated(0.91) | benign(0) | TCGA-CA-6717-01 | Colorectum | colon adenocarcinoma | Male | <65 | I/II | Chemotherapy | oxaliplatin | CR |
| Page: 1 2 3 4 5 |
Top |
Related drugs of malignant transformation related genes |
| Identification of chemicals and drugs interact with genes involved in malignant transfromation |
| (DGIdb 4.0) |
| Entrez ID | Symbol | Category | Interaction Types | Drug Claim Name | Drug Name | PMIDs |
| Page: 1 |

Copyright 2023-Present -The University of Texas Health Science Center at Houston |