
|
|||||
|
 | |
| |
| |
| |
| |
| |
|
Gene: TMED9 |
Gene summary for TMED9 |
| Gene information | Species | Human | Gene symbol | TMED9 | Gene ID | 54732 |
| Gene name | transmembrane p24 trafficking protein 9 | |
| Gene Alias | GMP25 | |
| Cytomap | 5q35.3 | |
| Gene Type | protein-coding | GO ID | GO:0006810 | UniProtAcc | A0A024R7M0 |
Top |
Malignant transformation analysis |
| Identification of the aberrant gene expression in precancerous and cancerous lesions by comparing the gene expression of stem-like cells in diseased tissues with normal stem cells |
| Entrez ID | Symbol | Replicates | Species | Organ | Tissue | Adj P-value | Log2FC | Malignancy |
| 54732 | TMED9 | GSM4909281 | Human | Breast | IDC | 4.74e-09 | 4.04e-01 | 0.21 |
| 54732 | TMED9 | GSM4909286 | Human | Breast | IDC | 1.47e-09 | -3.86e-01 | 0.1081 |
| 54732 | TMED9 | GSM4909288 | Human | Breast | IDC | 1.75e-06 | -4.25e-01 | 0.0988 |
| 54732 | TMED9 | GSM4909293 | Human | Breast | IDC | 1.83e-02 | -9.76e-02 | 0.1581 |
| 54732 | TMED9 | GSM4909294 | Human | Breast | IDC | 2.19e-04 | -2.40e-01 | 0.2022 |
| 54732 | TMED9 | GSM4909296 | Human | Breast | IDC | 1.73e-08 | 4.79e-02 | 0.1524 |
| 54732 | TMED9 | GSM4909297 | Human | Breast | IDC | 8.06e-17 | -1.92e-01 | 0.1517 |
| 54732 | TMED9 | GSM4909301 | Human | Breast | IDC | 4.36e-11 | -3.45e-01 | 0.1577 |
| 54732 | TMED9 | GSM4909308 | Human | Breast | IDC | 2.19e-02 | 2.59e-01 | 0.158 |
| 54732 | TMED9 | GSM4909309 | Human | Breast | IDC | 2.67e-02 | -9.92e-03 | 0.0483 |
| 54732 | TMED9 | GSM4909311 | Human | Breast | IDC | 3.15e-30 | -2.72e-01 | 0.1534 |
| 54732 | TMED9 | GSM4909312 | Human | Breast | IDC | 1.58e-13 | -3.49e-02 | 0.1552 |
| 54732 | TMED9 | GSM4909313 | Human | Breast | IDC | 3.34e-02 | -8.54e-02 | 0.0391 |
| 54732 | TMED9 | GSM4909316 | Human | Breast | IDC | 7.33e-03 | -1.70e-01 | 0.21 |
| 54732 | TMED9 | GSM4909318 | Human | Breast | IDC | 6.53e-03 | -1.52e-01 | 0.2031 |
| 54732 | TMED9 | GSM4909319 | Human | Breast | IDC | 1.26e-46 | -2.60e-02 | 0.1563 |
| 54732 | TMED9 | GSM4909320 | Human | Breast | IDC | 4.01e-12 | 2.41e-01 | 0.1575 |
| 54732 | TMED9 | GSM4909321 | Human | Breast | IDC | 4.46e-14 | 6.61e-02 | 0.1559 |
| 54732 | TMED9 | brca1 | Human | Breast | Precancer | 8.16e-17 | 5.24e-01 | -0.0338 |
| 54732 | TMED9 | brca2 | Human | Breast | Precancer | 8.34e-25 | 5.26e-01 | -0.024 |
| Page: 1 2 3 4 5 6 7 8 9 10 11 12 13 |
| Tissue | Expression Dynamics | Abbreviation |
| Breast | 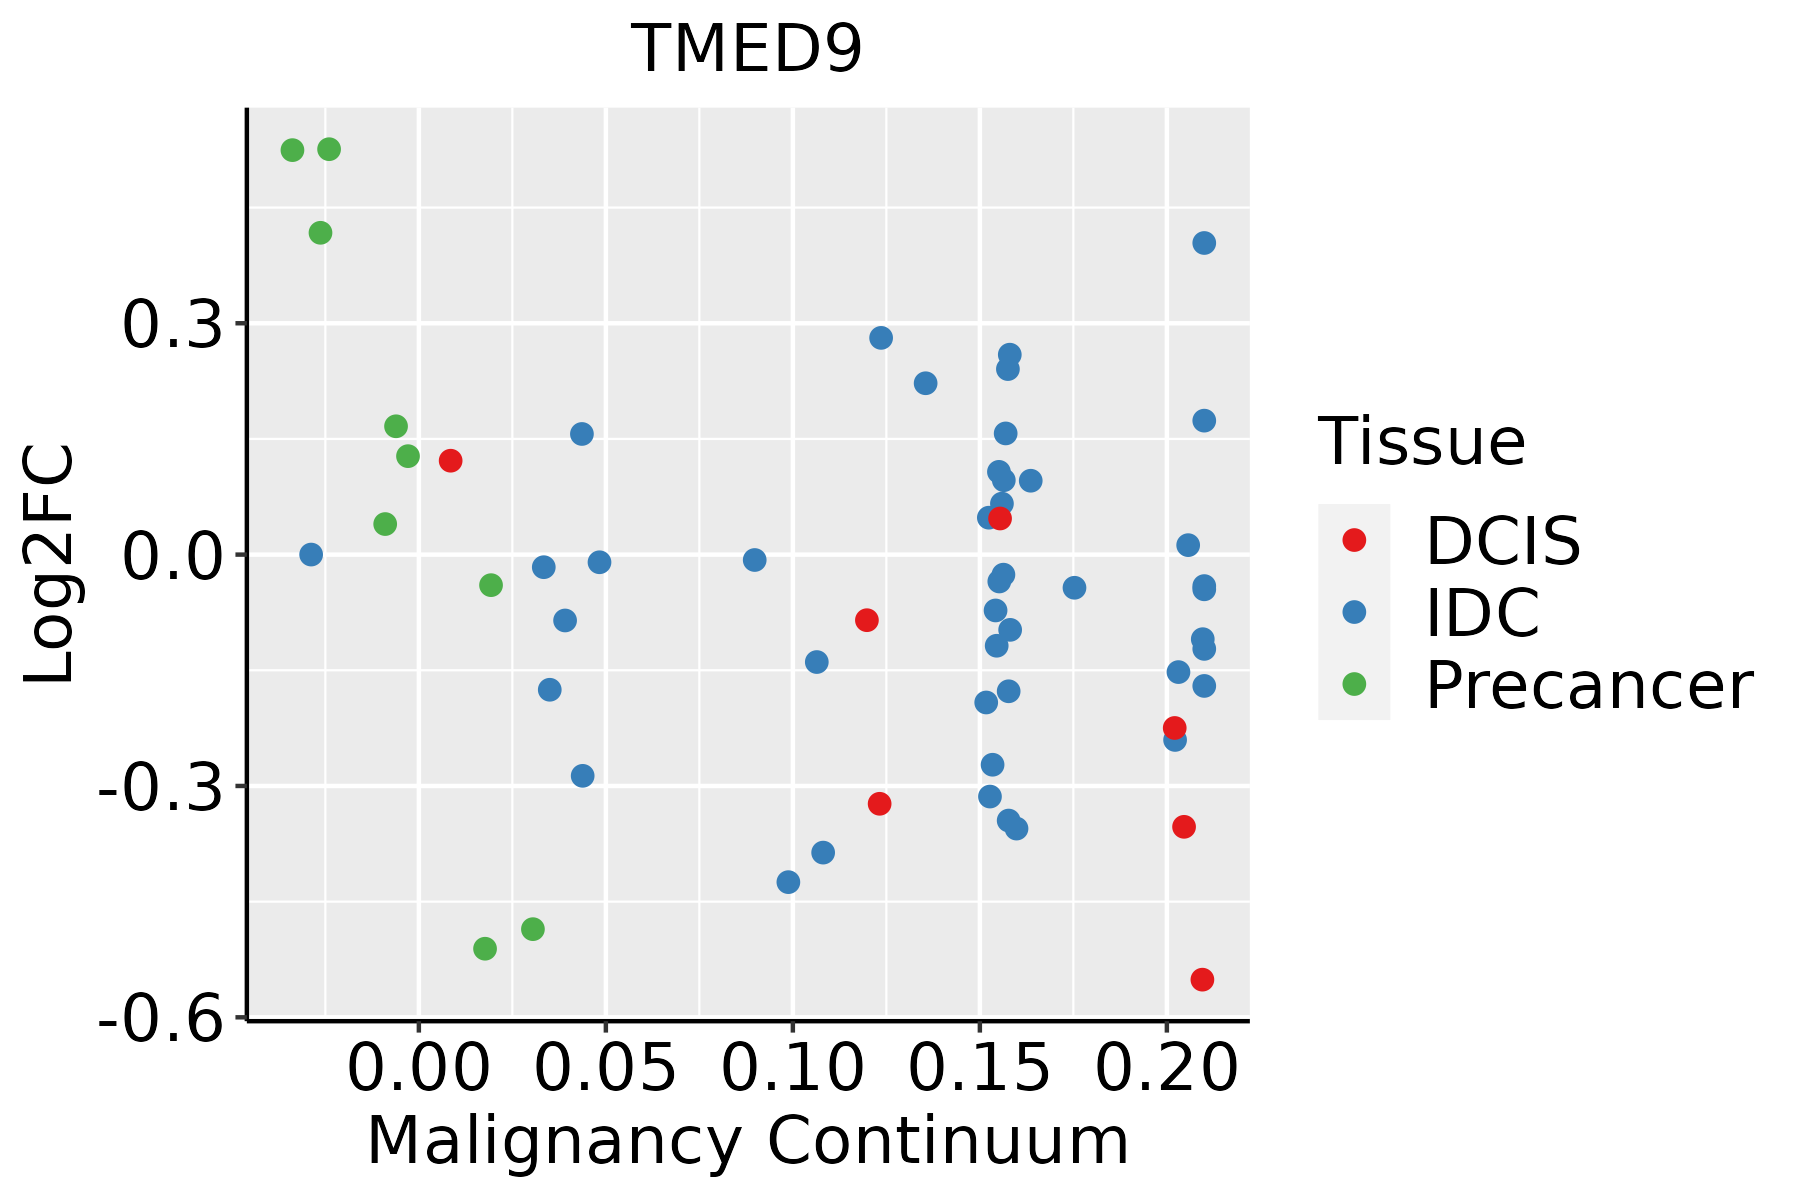 | IDC: Invasive ductal carcinoma |
| DCIS: Ductal carcinoma in situ | ||
| Precancer(BRCA1-mut): Precancerous lesion from BRCA1 mutation carriers | ||
| Colorectum (GSE201348) |  | FAP: Familial adenomatous polyposis |
| CRC: Colorectal cancer | ||
| Colorectum (HTA11) |  | AD: Adenomas |
| SER: Sessile serrated lesions | ||
| MSI-H: Microsatellite-high colorectal cancer | ||
| MSS: Microsatellite stable colorectal cancer | ||
| Endometrium | 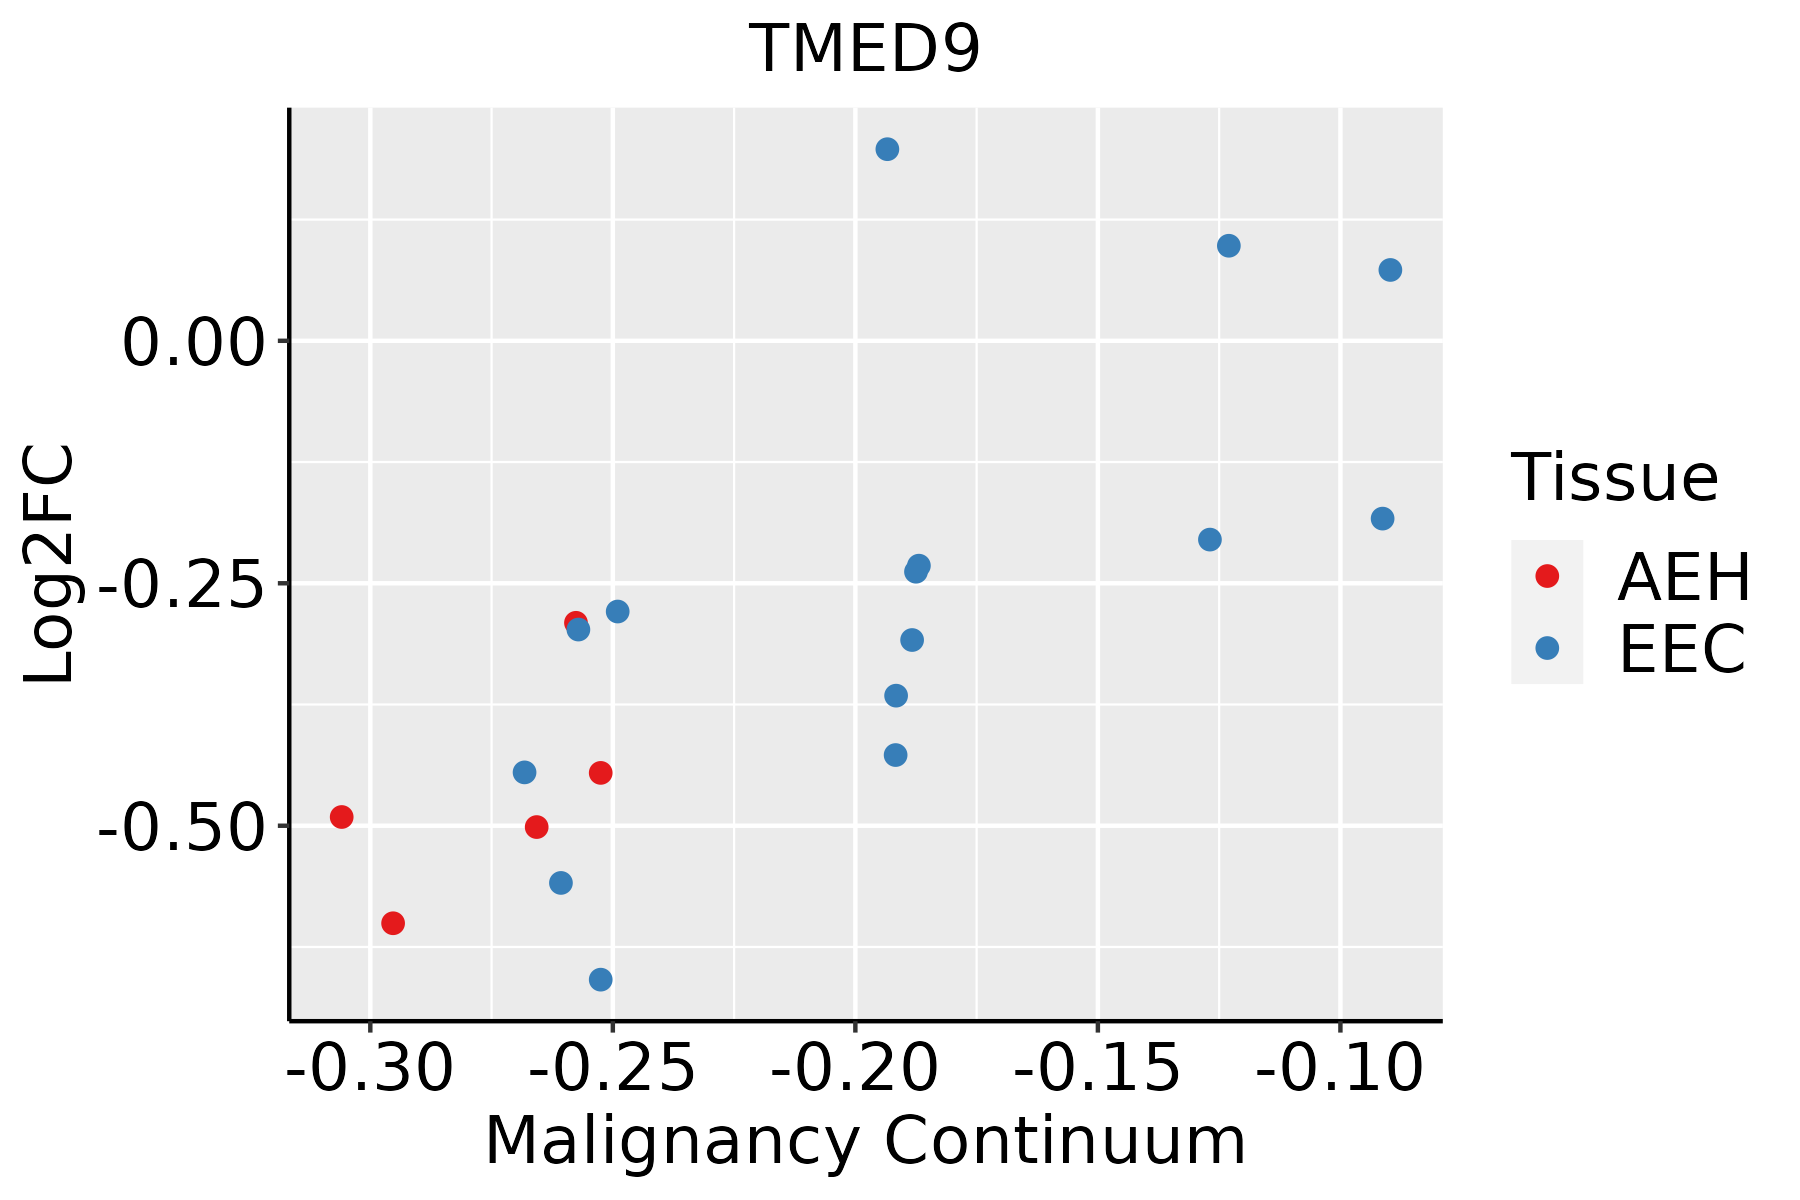 | AEH: Atypical endometrial hyperplasia |
| EEC: Endometrioid Cancer | ||
| Esophagus |  | ESCC: Esophageal squamous cell carcinoma |
| HGIN: High-grade intraepithelial neoplasias | ||
| LGIN: Low-grade intraepithelial neoplasias | ||
| Liver | 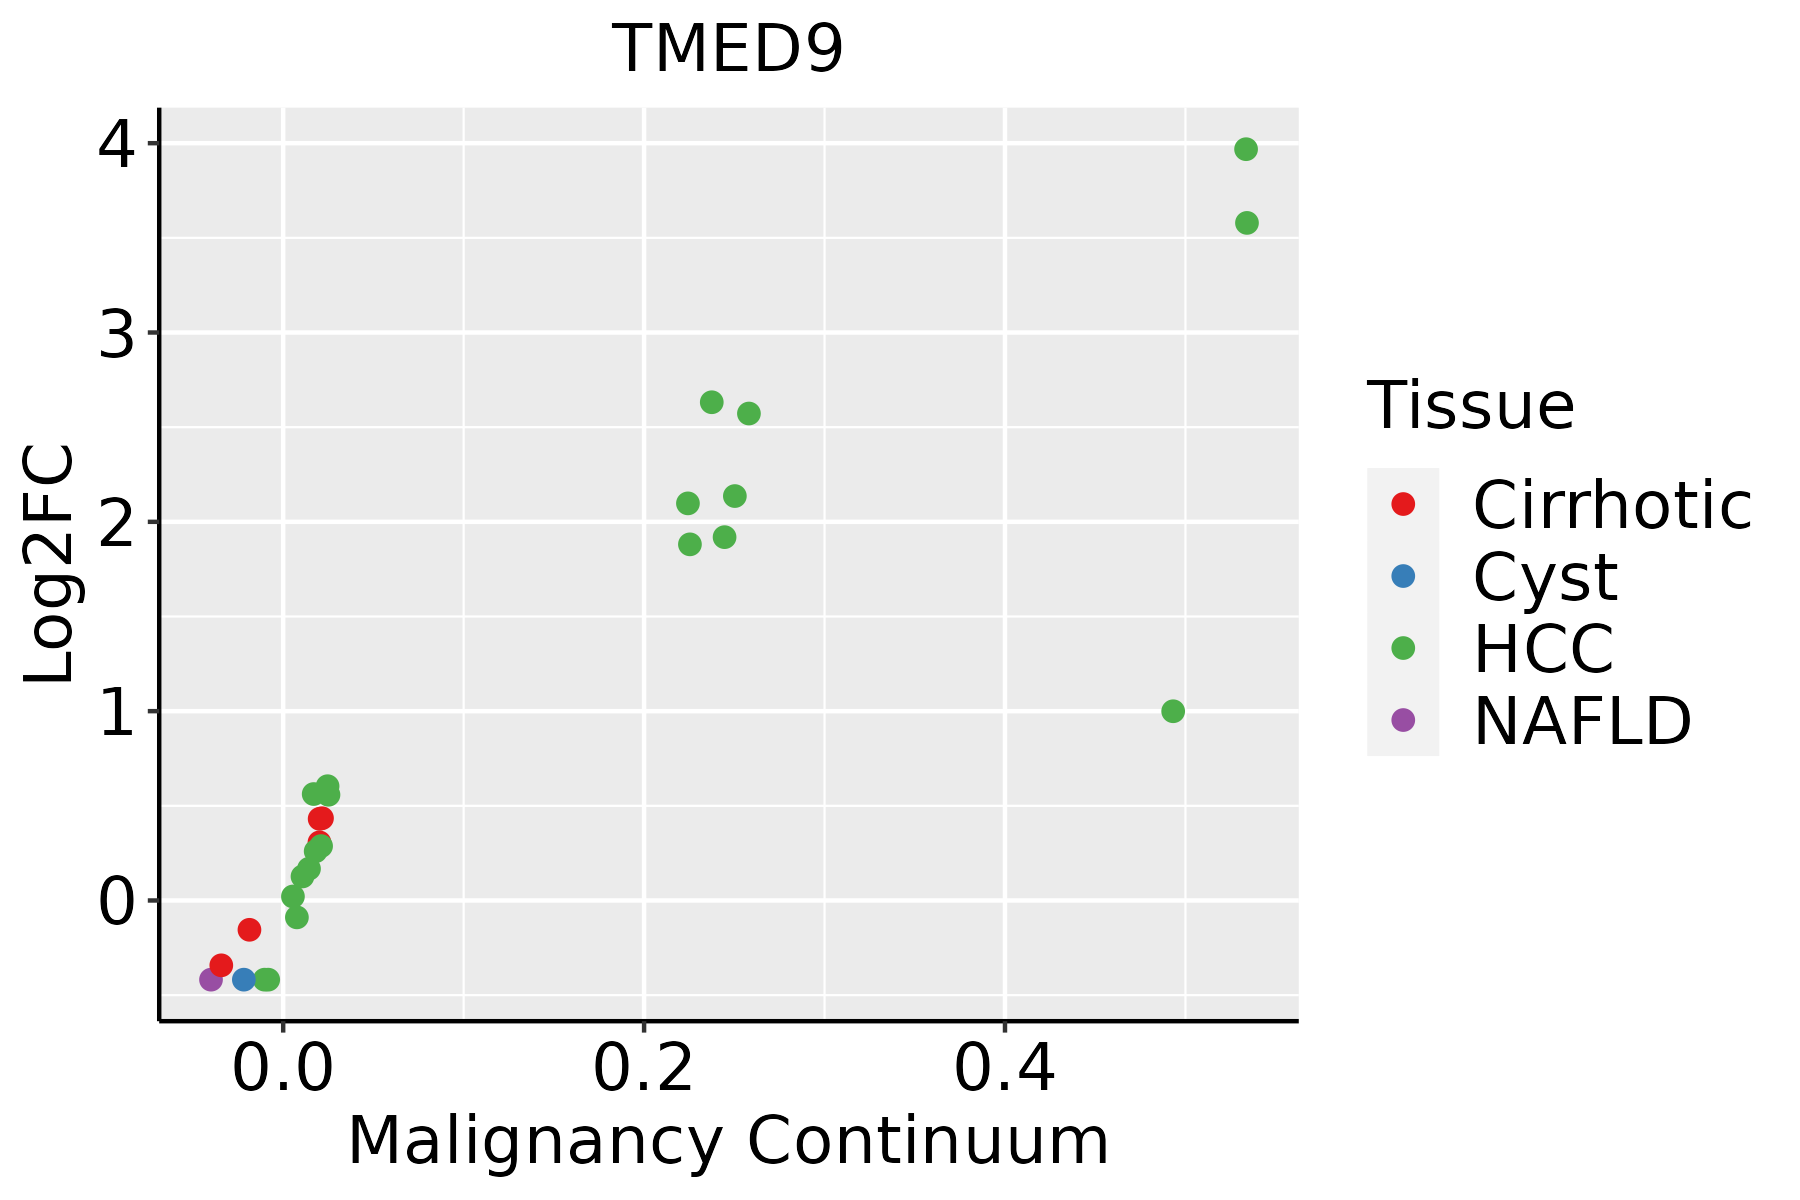 | HCC: Hepatocellular carcinoma |
| NAFLD: Non-alcoholic fatty liver disease | ||
| Lung |  | AAH: Atypical adenomatous hyperplasia |
| AIS: Adenocarcinoma in situ | ||
| IAC: Invasive lung adenocarcinoma | ||
| MIA: Minimally invasive adenocarcinoma | ||
| Oral Cavity | 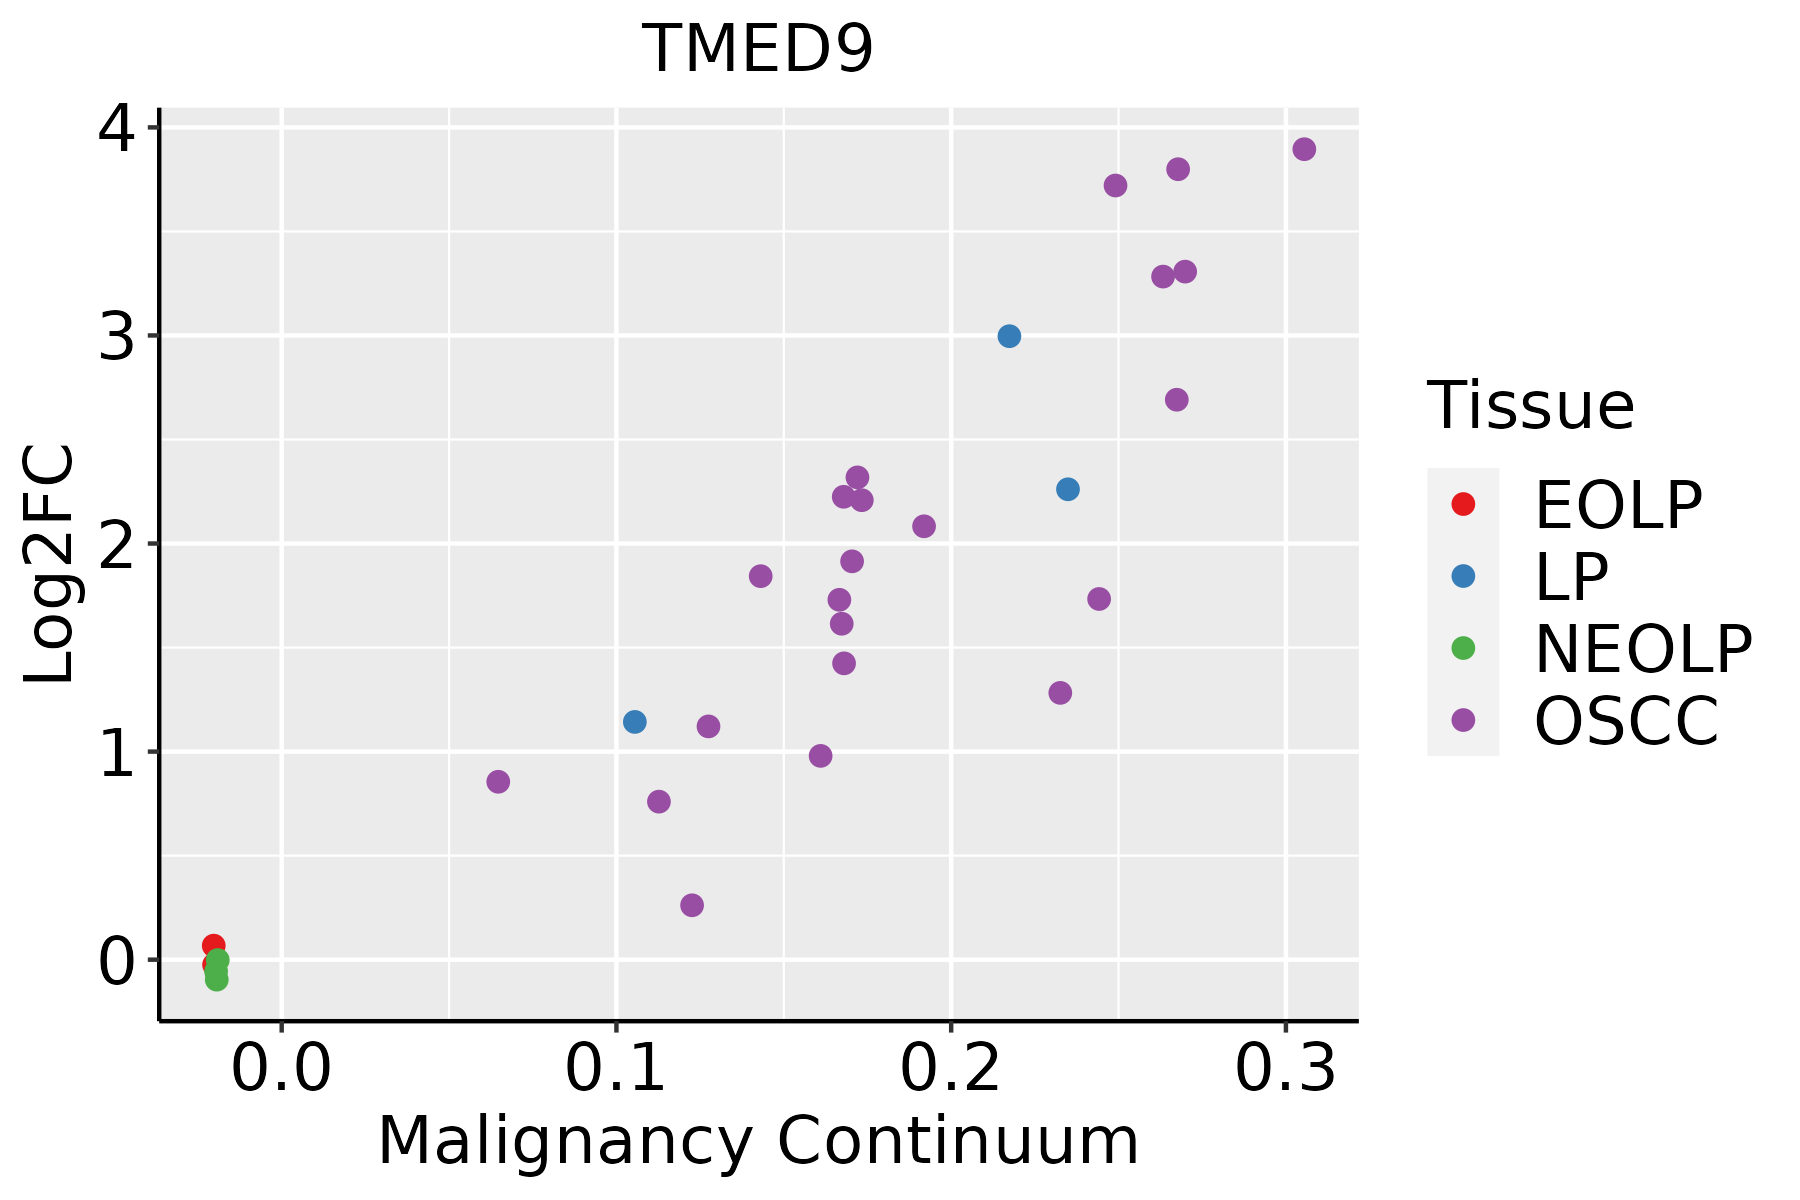 | EOLP: Erosive Oral lichen planus |
| LP: leukoplakia | ||
| NEOLP: Non-erosive oral lichen planus | ||
| OSCC: Oral squamous cell carcinoma | ||
| Prostate |  | BPH: Benign Prostatic Hyperplasia |
| Skin |  | AK: Actinic keratosis |
| cSCC: Cutaneous squamous cell carcinoma | ||
| SCCIS:squamous cell carcinoma in situ | ||
| Thyroid |  | ATC: Anaplastic thyroid cancer |
| HT: Hashimoto's thyroiditis | ||
| PTC: Papillary thyroid cancer |
| ∗log2FC in expression of this searched gene in stem-like cells from each diseased tissue sample relative to stem-like cells in normal samples in each tissue plotted against the malignancy continuum. Samples are colored based on if they are from different disease stage. |
Top |
Malignant transformation related pathway analysis |
| Find out the enriched GO biological processes and KEGG pathways involved in transition from healthy to precancer to cancer |
| Tissue | Disease Stage | Enriched GO biological Processes |
| Colorectum | AD |  |
| Colorectum | SER |  |
| Colorectum | MSS |  |
| Colorectum | MSI-H |  |
| Colorectum | FAP |  |
| ∗Top 15 enriched GO BP terms are showed in the bar plot of each disease state in each tissue. Each row represents a significant GO biological process which is colored according to the -log10(p.adjust). |
| Page: 1 2 3 4 5 6 7 8 9 |
| GO ID | Tissue | Disease Stage | Description | Gene Ratio | Bg Ratio | pvalue | p.adjust | Count |
| GO:00069009 | Breast | Precancer | vesicle budding from membrane | 12/1080 | 61/18723 | 1.61e-04 | 2.69e-03 | 12 |
| GO:00481992 | Breast | Precancer | vesicle targeting, to, from or within Golgi | 5/1080 | 21/18723 | 5.93e-03 | 4.21e-02 | 5 |
| GO:000690014 | Breast | IDC | vesicle budding from membrane | 12/1434 | 61/18723 | 2.01e-03 | 1.90e-02 | 12 |
| GO:000690022 | Breast | DCIS | vesicle budding from membrane | 12/1390 | 61/18723 | 1.54e-03 | 1.54e-02 | 12 |
| GO:0048193 | Colorectum | AD | Golgi vesicle transport | 109/3918 | 296/18723 | 1.80e-10 | 1.68e-08 | 109 |
| GO:0051656 | Colorectum | AD | establishment of organelle localization | 131/3918 | 390/18723 | 3.00e-09 | 2.06e-07 | 131 |
| GO:0006900 | Colorectum | AD | vesicle budding from membrane | 32/3918 | 61/18723 | 5.38e-08 | 2.81e-06 | 32 |
| GO:0016050 | Colorectum | AD | vesicle organization | 101/3918 | 300/18723 | 1.65e-07 | 7.17e-06 | 101 |
| GO:0051650 | Colorectum | AD | establishment of vesicle localization | 57/3918 | 161/18723 | 1.47e-05 | 3.15e-04 | 57 |
| GO:0051648 | Colorectum | AD | vesicle localization | 59/3918 | 177/18723 | 7.83e-05 | 1.25e-03 | 59 |
| GO:0006888 | Colorectum | AD | endoplasmic reticulum to Golgi vesicle-mediated transport | 44/3918 | 130/18723 | 4.13e-04 | 4.68e-03 | 44 |
| GO:0006903 | Colorectum | AD | vesicle targeting | 19/3918 | 45/18723 | 9.94e-04 | 9.28e-03 | 19 |
| GO:0048194 | Colorectum | AD | Golgi vesicle budding | 7/3918 | 10/18723 | 1.15e-03 | 1.04e-02 | 7 |
| GO:0006901 | Colorectum | AD | vesicle coating | 9/3918 | 17/18723 | 3.57e-03 | 2.57e-02 | 9 |
| GO:00516561 | Colorectum | SER | establishment of organelle localization | 100/2897 | 390/18723 | 1.11e-07 | 6.79e-06 | 100 |
| GO:00481931 | Colorectum | SER | Golgi vesicle transport | 79/2897 | 296/18723 | 4.20e-07 | 2.15e-05 | 79 |
| GO:00069001 | Colorectum | SER | vesicle budding from membrane | 23/2897 | 61/18723 | 1.95e-05 | 5.66e-04 | 23 |
| GO:00516501 | Colorectum | SER | establishment of vesicle localization | 42/2897 | 161/18723 | 3.38e-04 | 5.35e-03 | 42 |
| GO:00160501 | Colorectum | SER | vesicle organization | 69/2897 | 300/18723 | 3.59e-04 | 5.61e-03 | 69 |
| GO:00068881 | Colorectum | SER | endoplasmic reticulum to Golgi vesicle-mediated transport | 34/2897 | 130/18723 | 1.13e-03 | 1.29e-02 | 34 |
| Page: 1 2 3 4 5 6 7 8 9 10 |
| Pathway ID | Tissue | Disease Stage | Description | Gene Ratio | Bg Ratio | pvalue | p.adjust | qvalue | Count |
| Page: 1 |
Top |
Cell-cell communication analysis |
| Identification of potential cell-cell interactions between two cell types and their ligand-receptor pairs for different disease states |
| Ligand | Receptor | LRpair | Pathway | Tissue | Disease Stage |
| Page: 1 |
Top |
Single-cell gene regulatory network inference analysis |
| Find out the significant the regulons (TFs) and the target genes of each regulon across cell types for different disease states |
| TF | Cell Type | Tissue | Disease Stage | Target Gene | RSS | Regulon Activity |
| ∗The dot plots of a searched regulon are shown for all cell subpopulations in each disease state of each tissue based on the regulon specific score inferred using pySCENIC and by calculating the average expression. |
| Page: 1 |
Top |
Somatic mutation of malignant transformation related genes |
| Annotation of somatic variants for genes involved in malignant transformation |
| Hugo Symbol | Variant Class | Variant Classification | dbSNP RS | HGVSc | HGVSp | HGVSp Short | SWISSPROT | BIOTYPE | SIFT | PolyPhen | Tumor Sample Barcode | Tissue | Histology | Sex | Age | Stage | Therapy Types | Drugs | Outcome |
| TMED9 | SNV | Missense_Mutation | novel | c.696N>C | p.Lys232Asn | p.K232N | Q9BVK6 | protein_coding | deleterious(0) | probably_damaging(0.913) | TCGA-VS-A9V1-01 | Cervix | cervical & endocervical cancer | Female | <65 | I/II | Chemotherapy | cisplatin | PD |
| TMED9 | SNV | Missense_Mutation | c.475N>A | p.Asp159Asn | p.D159N | Q9BVK6 | protein_coding | deleterious(0.02) | benign(0.292) | TCGA-AA-3672-01 | Colorectum | colon adenocarcinoma | Female | >=65 | III/IV | Unknown | Unknown | SD | |
| TMED9 | SNV | Missense_Mutation | novel | c.506N>A | p.Arg169Gln | p.R169Q | Q9BVK6 | protein_coding | tolerated(0.24) | benign(0.206) | TCGA-AA-A00N-01 | Colorectum | colon adenocarcinoma | Male | >=65 | I/II | Unknown | Unknown | PD |
| TMED9 | SNV | Missense_Mutation | rs139247267 | c.70N>G | p.Thr24Ala | p.T24A | Q9BVK6 | protein_coding | tolerated(0.89) | benign(0) | TCGA-G4-6314-01 | Colorectum | colon adenocarcinoma | Female | >=65 | III/IV | Ancillary | leucovorin | SD |
| TMED9 | SNV | Missense_Mutation | novel | c.678N>T | p.Lys226Asn | p.K226N | Q9BVK6 | protein_coding | deleterious(0) | probably_damaging(0.984) | TCGA-A5-A0G2-01 | Endometrium | uterine corpus endometrioid carcinoma | Female | <65 | III/IV | Unknown | Unknown | SD |
| TMED9 | SNV | Missense_Mutation | novel | c.295N>A | p.Ala99Thr | p.A99T | Q9BVK6 | protein_coding | tolerated(0.07) | benign(0.02) | TCGA-AP-A1DK-01 | Endometrium | uterine corpus endometrioid carcinoma | Female | <65 | I/II | Unknown | Unknown | SD |
| TMED9 | SNV | Missense_Mutation | novel | c.451G>T | p.Asp151Tyr | p.D151Y | Q9BVK6 | protein_coding | deleterious(0) | possibly_damaging(0.619) | TCGA-AP-A1E0-01 | Endometrium | uterine corpus endometrioid carcinoma | Female | <65 | III/IV | Chemotherapy | paclitaxel | SD |
| TMED9 | SNV | Missense_Mutation | rs773806110 | c.604N>T | p.Arg202Trp | p.R202W | Q9BVK6 | protein_coding | deleterious(0) | probably_damaging(1) | TCGA-AX-A0IZ-01 | Endometrium | uterine corpus endometrioid carcinoma | Female | <65 | I/II | Unknown | Unknown | SD |
| TMED9 | SNV | Missense_Mutation | c.437G>A | p.Gly146Asp | p.G146D | Q9BVK6 | protein_coding | deleterious(0) | probably_damaging(0.983) | TCGA-BK-A13B-01 | Endometrium | uterine corpus endometrioid carcinoma | Female | <65 | I/II | Unknown | Unknown | PD | |
| TMED9 | SNV | Missense_Mutation | novel | c.158A>G | p.Glu53Gly | p.E53G | Q9BVK6 | protein_coding | deleterious(0) | probably_damaging(0.924) | TCGA-DF-A2KU-01 | Endometrium | uterine corpus endometrioid carcinoma | Female | Unknown | I/II | Unknown | Unknown | SD |
| Page: 1 2 |
Top |
Related drugs of malignant transformation related genes |
| Identification of chemicals and drugs interact with genes involved in malignant transfromation |
| (DGIdb 4.0) |
| Entrez ID | Symbol | Category | Interaction Types | Drug Claim Name | Drug Name | PMIDs |
| Page: 1 |

Copyright 2023-Present -The University of Texas Health Science Center at Houston |