
|
|||||
|
 | |
| |
| |
| |
| |
| |
|
Gene: TMED8 |
Gene summary for TMED8 |
| Gene information | Species | Human | Gene symbol | TMED8 | Gene ID | 283578 |
| Gene name | transmembrane p24 trafficking protein family member 8 | |
| Gene Alias | FAM15B | |
| Cytomap | 14q24.3 | |
| Gene Type | protein-coding | GO ID | GO:0003674 | UniProtAcc | Q6PL24 |
Top |
Malignant transformation analysis |
| Identification of the aberrant gene expression in precancerous and cancerous lesions by comparing the gene expression of stem-like cells in diseased tissues with normal stem cells |
| Entrez ID | Symbol | Replicates | Species | Organ | Tissue | Adj P-value | Log2FC | Malignancy |
| 283578 | TMED8 | LZE4T | Human | Esophagus | ESCC | 1.89e-02 | 1.24e-01 | 0.0811 |
| 283578 | TMED8 | LZE24T | Human | Esophagus | ESCC | 9.08e-04 | 8.57e-02 | 0.0596 |
| 283578 | TMED8 | P2T-E | Human | Esophagus | ESCC | 1.05e-10 | 1.87e-01 | 0.1177 |
| 283578 | TMED8 | P4T-E | Human | Esophagus | ESCC | 2.04e-03 | 1.01e-01 | 0.1323 |
| 283578 | TMED8 | P8T-E | Human | Esophagus | ESCC | 2.76e-15 | 1.10e-01 | 0.0889 |
| 283578 | TMED8 | P10T-E | Human | Esophagus | ESCC | 2.99e-17 | 2.50e-01 | 0.116 |
| 283578 | TMED8 | P11T-E | Human | Esophagus | ESCC | 1.18e-06 | 2.38e-01 | 0.1426 |
| 283578 | TMED8 | P12T-E | Human | Esophagus | ESCC | 6.78e-03 | 1.24e-01 | 0.1122 |
| 283578 | TMED8 | P15T-E | Human | Esophagus | ESCC | 1.62e-09 | 1.97e-01 | 0.1149 |
| 283578 | TMED8 | P16T-E | Human | Esophagus | ESCC | 9.58e-13 | 1.79e-01 | 0.1153 |
| 283578 | TMED8 | P17T-E | Human | Esophagus | ESCC | 6.38e-04 | 2.41e-01 | 0.1278 |
| 283578 | TMED8 | P20T-E | Human | Esophagus | ESCC | 4.41e-10 | 1.44e-01 | 0.1124 |
| 283578 | TMED8 | P21T-E | Human | Esophagus | ESCC | 2.02e-03 | 9.32e-02 | 0.1617 |
| 283578 | TMED8 | P22T-E | Human | Esophagus | ESCC | 3.43e-07 | 1.29e-01 | 0.1236 |
| 283578 | TMED8 | P23T-E | Human | Esophagus | ESCC | 2.54e-04 | 9.07e-02 | 0.108 |
| 283578 | TMED8 | P24T-E | Human | Esophagus | ESCC | 1.60e-05 | 1.08e-01 | 0.1287 |
| 283578 | TMED8 | P26T-E | Human | Esophagus | ESCC | 1.55e-06 | 1.25e-01 | 0.1276 |
| 283578 | TMED8 | P27T-E | Human | Esophagus | ESCC | 3.77e-08 | 2.01e-01 | 0.1055 |
| 283578 | TMED8 | P30T-E | Human | Esophagus | ESCC | 3.18e-06 | 2.14e-01 | 0.137 |
| 283578 | TMED8 | P31T-E | Human | Esophagus | ESCC | 1.85e-03 | 9.91e-02 | 0.1251 |
| Page: 1 2 3 |
| Tissue | Expression Dynamics | Abbreviation |
| Esophagus | 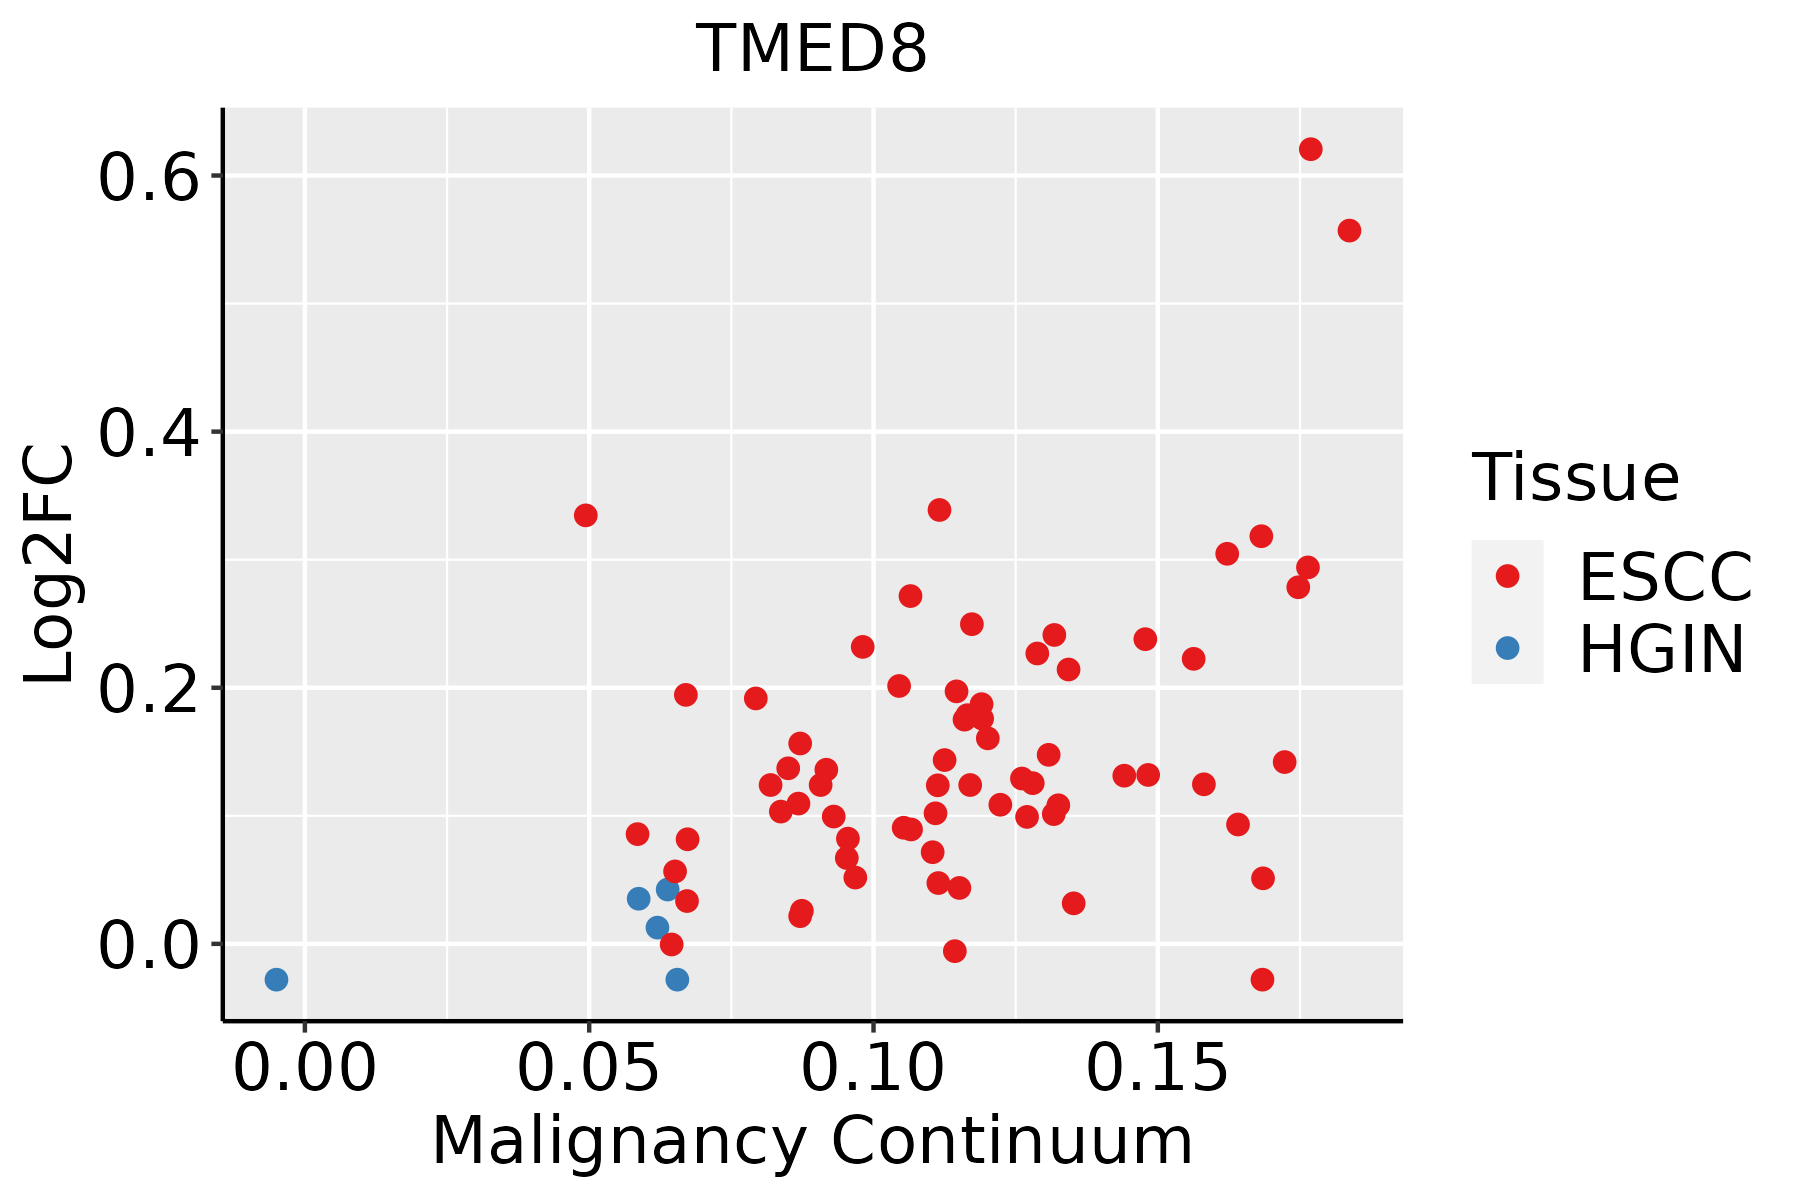 | ESCC: Esophageal squamous cell carcinoma |
| HGIN: High-grade intraepithelial neoplasias | ||
| LGIN: Low-grade intraepithelial neoplasias |
| ∗log2FC in expression of this searched gene in stem-like cells from each diseased tissue sample relative to stem-like cells in normal samples in each tissue plotted against the malignancy continuum. Samples are colored based on if they are from different disease stage. |
Top |
Malignant transformation related pathway analysis |
| Find out the enriched GO biological processes and KEGG pathways involved in transition from healthy to precancer to cancer |
| Tissue | Disease Stage | Enriched GO biological Processes |
| Colorectum | AD |  |
| Colorectum | SER |  |
| Colorectum | MSS |  |
| Colorectum | MSI-H |  |
| Colorectum | FAP |  |
| ∗Top 15 enriched GO BP terms are showed in the bar plot of each disease state in each tissue. Each row represents a significant GO biological process which is colored according to the -log10(p.adjust). |
| Page: 1 2 3 4 5 6 7 8 9 |
| GO ID | Tissue | Disease Stage | Description | Gene Ratio | Bg Ratio | pvalue | p.adjust | Count |
| Page: 1 |
| Pathway ID | Tissue | Disease Stage | Description | Gene Ratio | Bg Ratio | pvalue | p.adjust | qvalue | Count |
| Page: 1 |
Top |
Cell-cell communication analysis |
| Identification of potential cell-cell interactions between two cell types and their ligand-receptor pairs for different disease states |
| Ligand | Receptor | LRpair | Pathway | Tissue | Disease Stage |
| Page: 1 |
Top |
Single-cell gene regulatory network inference analysis |
| Find out the significant the regulons (TFs) and the target genes of each regulon across cell types for different disease states |
| TF | Cell Type | Tissue | Disease Stage | Target Gene | RSS | Regulon Activity |
| ∗The dot plots of a searched regulon are shown for all cell subpopulations in each disease state of each tissue based on the regulon specific score inferred using pySCENIC and by calculating the average expression. |
| Page: 1 |
Top |
Somatic mutation of malignant transformation related genes |
| Annotation of somatic variants for genes involved in malignant transformation |
| Hugo Symbol | Variant Class | Variant Classification | dbSNP RS | HGVSc | HGVSp | HGVSp Short | SWISSPROT | BIOTYPE | SIFT | PolyPhen | Tumor Sample Barcode | Tissue | Histology | Sex | Age | Stage | Therapy Types | Drugs | Outcome |
| TMED8 | SNV | Missense_Mutation | novel | c.881A>G | p.Asp294Gly | p.D294G | Q6PL24 | protein_coding | tolerated(0.06) | possibly_damaging(0.904) | TCGA-A1-A0SO-01 | Breast | breast invasive carcinoma | Female | >=65 | I/II | Chemotherapy | SD | |
| TMED8 | SNV | Missense_Mutation | rs556223514 | c.815G>A | p.Arg272His | p.R272H | Q6PL24 | protein_coding | tolerated(0.13) | benign(0.255) | TCGA-A8-A09Z-01 | Breast | breast invasive carcinoma | Female | >=65 | I/II | Unknown | Unknown | SD |
| TMED8 | SNV | Missense_Mutation | novel | c.872G>C | p.Gly291Ala | p.G291A | Q6PL24 | protein_coding | deleterious(0) | probably_damaging(1) | TCGA-B6-A0IE-01 | Breast | breast invasive carcinoma | Female | <65 | III/IV | Unknown | Unknown | PD |
| TMED8 | SNV | Missense_Mutation | c.513C>G | p.Phe171Leu | p.F171L | Q6PL24 | protein_coding | tolerated(0.11) | benign(0.1) | TCGA-BH-A1FU-01 | Breast | breast invasive carcinoma | Female | <65 | I/II | Unknown | Unknown | PD | |
| TMED8 | SNV | Missense_Mutation | c.157G>T | p.Ala53Ser | p.A53S | Q6PL24 | protein_coding | tolerated_low_confidence(0.16) | benign(0.025) | TCGA-D8-A1JJ-01 | Breast | breast invasive carcinoma | Female | <65 | I/II | Chemotherapy | doxorubicine | SD | |
| TMED8 | SNV | Missense_Mutation | novel | c.784N>C | p.Glu262Gln | p.E262Q | Q6PL24 | protein_coding | deleterious(0) | probably_damaging(0.993) | TCGA-C5-A7CK-01 | Cervix | cervical & endocervical cancer | Female | <65 | I/II | Chemotherapy | cisplatin | SD |
| TMED8 | SNV | Missense_Mutation | c.188N>T | p.Ser63Leu | p.S63L | Q6PL24 | protein_coding | tolerated_low_confidence(0.07) | benign(0.003) | TCGA-Q1-A5R2-01 | Cervix | cervical & endocervical cancer | Female | <65 | I/II | Chemotherapy | cisplatin | PR | |
| TMED8 | SNV | Missense_Mutation | novel | c.829N>T | p.Met277Leu | p.M277L | Q6PL24 | protein_coding | tolerated(0.26) | benign(0.026) | TCGA-ZJ-A8QR-01 | Cervix | cervical & endocervical cancer | Female | <65 | I/II | Unknown | Unknown | SD |
| TMED8 | SNV | Missense_Mutation | rs774060958 | c.626N>T | p.Ala209Val | p.A209V | Q6PL24 | protein_coding | deleterious(0) | probably_damaging(0.999) | TCGA-A6-6781-01 | Colorectum | colon adenocarcinoma | Male | <65 | III/IV | Chemotherapy | oxaliplatin | SD |
| TMED8 | SNV | Missense_Mutation | rs746380848 | c.845G>A | p.Arg282Gln | p.R282Q | Q6PL24 | protein_coding | tolerated(0.09) | possibly_damaging(0.572) | TCGA-AA-3663-01 | Colorectum | colon adenocarcinoma | Male | <65 | I/II | Unknown | Unknown | SD |
| Page: 1 2 3 4 |
Top |
Related drugs of malignant transformation related genes |
| Identification of chemicals and drugs interact with genes involved in malignant transfromation |
| (DGIdb 4.0) |
| Entrez ID | Symbol | Category | Interaction Types | Drug Claim Name | Drug Name | PMIDs |
| Page: 1 |

Copyright 2023-Present -The University of Texas Health Science Center at Houston |