
|
|||||
|
 | |
| |
| |
| |
| |
| |
|
Gene: TMED7 |
Gene summary for TMED7 |
| Gene information | Species | Human | Gene symbol | TMED7 | Gene ID | 51014 |
| Gene name | transmembrane p24 trafficking protein 7 | |
| Gene Alias | CGI-109 | |
| Cytomap | 5q22.3 | |
| Gene Type | protein-coding | GO ID | GO:0006810 | UniProtAcc | Q9Y3B3 |
Top |
Malignant transformation analysis |
| Identification of the aberrant gene expression in precancerous and cancerous lesions by comparing the gene expression of stem-like cells in diseased tissues with normal stem cells |
| Entrez ID | Symbol | Replicates | Species | Organ | Tissue | Adj P-value | Log2FC | Malignancy |
| 51014 | TMED7 | LZE4T | Human | Esophagus | ESCC | 1.46e-10 | 1.94e-01 | 0.0811 |
| 51014 | TMED7 | LZE5T | Human | Esophagus | ESCC | 9.71e-03 | 5.32e-02 | 0.0514 |
| 51014 | TMED7 | LZE20T | Human | Esophagus | ESCC | 2.51e-03 | -6.85e-02 | 0.0662 |
| 51014 | TMED7 | LZE24T | Human | Esophagus | ESCC | 1.43e-20 | 6.26e-01 | 0.0596 |
| 51014 | TMED7 | P1T-E | Human | Esophagus | ESCC | 1.02e-02 | -8.99e-02 | 0.0875 |
| 51014 | TMED7 | P2T-E | Human | Esophagus | ESCC | 1.09e-09 | -1.26e-01 | 0.1177 |
| 51014 | TMED7 | P4T-E | Human | Esophagus | ESCC | 9.45e-12 | 5.61e-03 | 0.1323 |
| 51014 | TMED7 | P5T-E | Human | Esophagus | ESCC | 1.42e-09 | -1.02e-01 | 0.1327 |
| 51014 | TMED7 | P8T-E | Human | Esophagus | ESCC | 3.54e-19 | 1.18e-01 | 0.0889 |
| 51014 | TMED7 | P9T-E | Human | Esophagus | ESCC | 5.76e-08 | -7.92e-02 | 0.1131 |
| 51014 | TMED7 | P10T-E | Human | Esophagus | ESCC | 6.45e-10 | -3.79e-02 | 0.116 |
| 51014 | TMED7 | P12T-E | Human | Esophagus | ESCC | 2.15e-14 | -6.08e-02 | 0.1122 |
| 51014 | TMED7 | P15T-E | Human | Esophagus | ESCC | 2.74e-14 | 1.26e-01 | 0.1149 |
| 51014 | TMED7 | P16T-E | Human | Esophagus | ESCC | 1.41e-04 | -1.92e-01 | 0.1153 |
| 51014 | TMED7 | P20T-E | Human | Esophagus | ESCC | 3.79e-03 | -1.54e-01 | 0.1124 |
| 51014 | TMED7 | P21T-E | Human | Esophagus | ESCC | 5.05e-12 | 1.08e-01 | 0.1617 |
| 51014 | TMED7 | P22T-E | Human | Esophagus | ESCC | 1.00e-12 | -5.77e-03 | 0.1236 |
| 51014 | TMED7 | P23T-E | Human | Esophagus | ESCC | 8.91e-09 | -3.37e-02 | 0.108 |
| 51014 | TMED7 | P24T-E | Human | Esophagus | ESCC | 1.04e-06 | -1.25e-01 | 0.1287 |
| 51014 | TMED7 | P26T-E | Human | Esophagus | ESCC | 1.73e-06 | -1.59e-01 | 0.1276 |
| Page: 1 2 3 4 5 6 |
| Tissue | Expression Dynamics | Abbreviation |
| Esophagus | 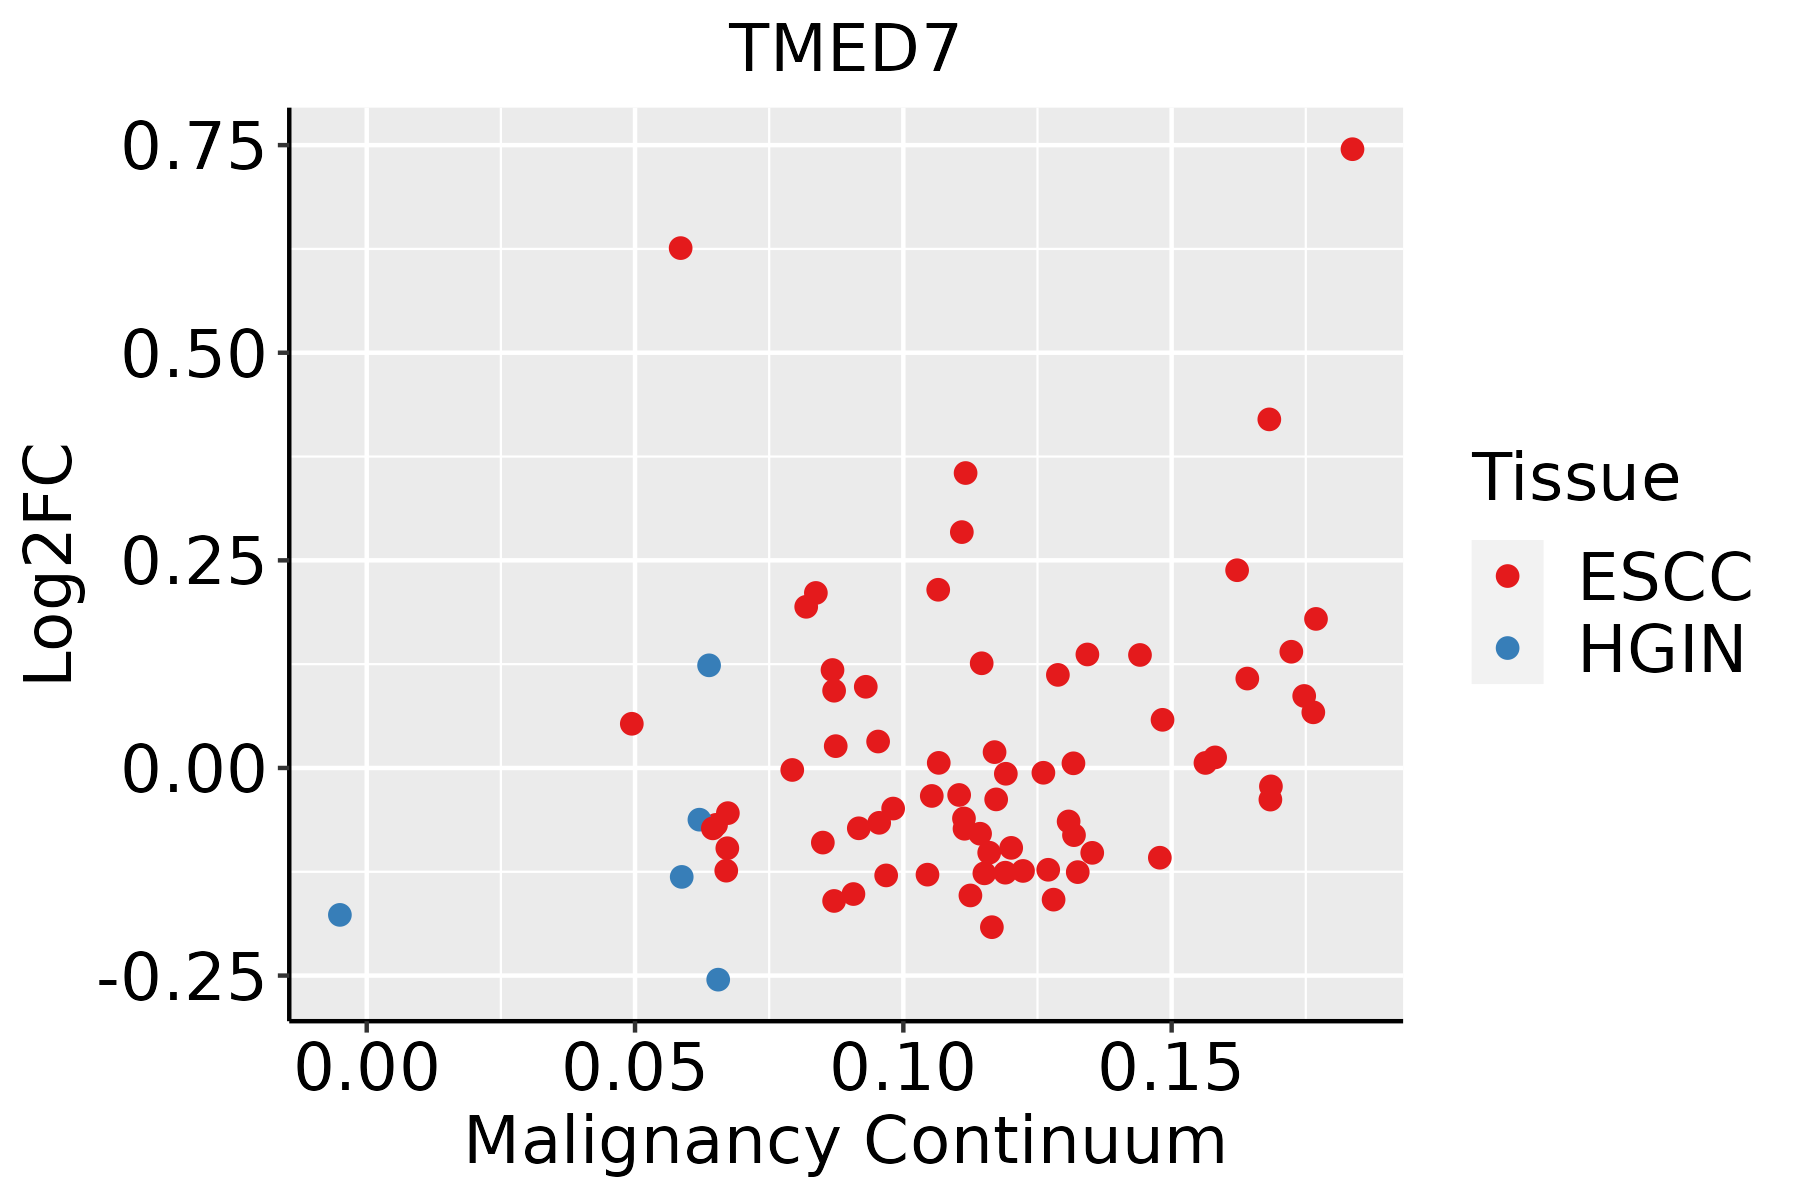 | ESCC: Esophageal squamous cell carcinoma |
| HGIN: High-grade intraepithelial neoplasias | ||
| LGIN: Low-grade intraepithelial neoplasias | ||
| Liver | 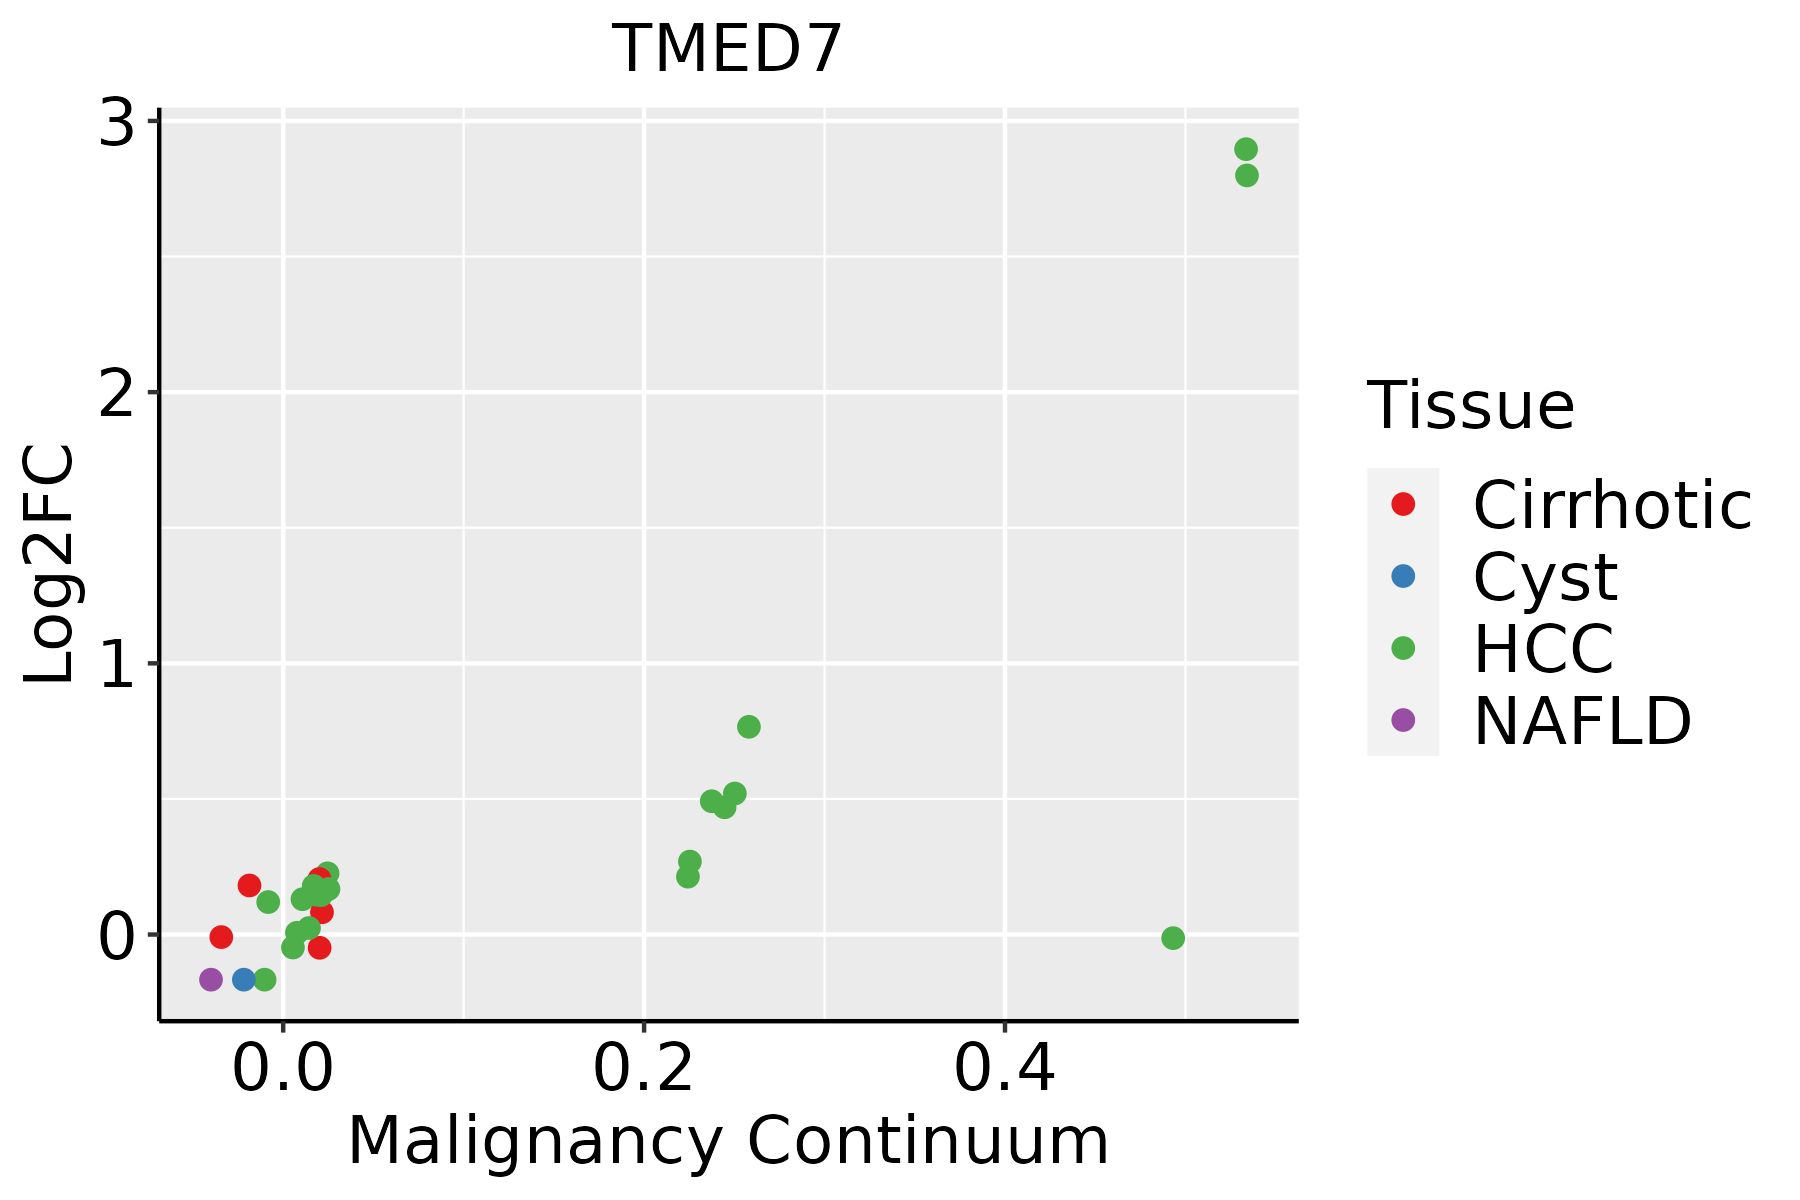 | HCC: Hepatocellular carcinoma |
| NAFLD: Non-alcoholic fatty liver disease | ||
| Oral Cavity | 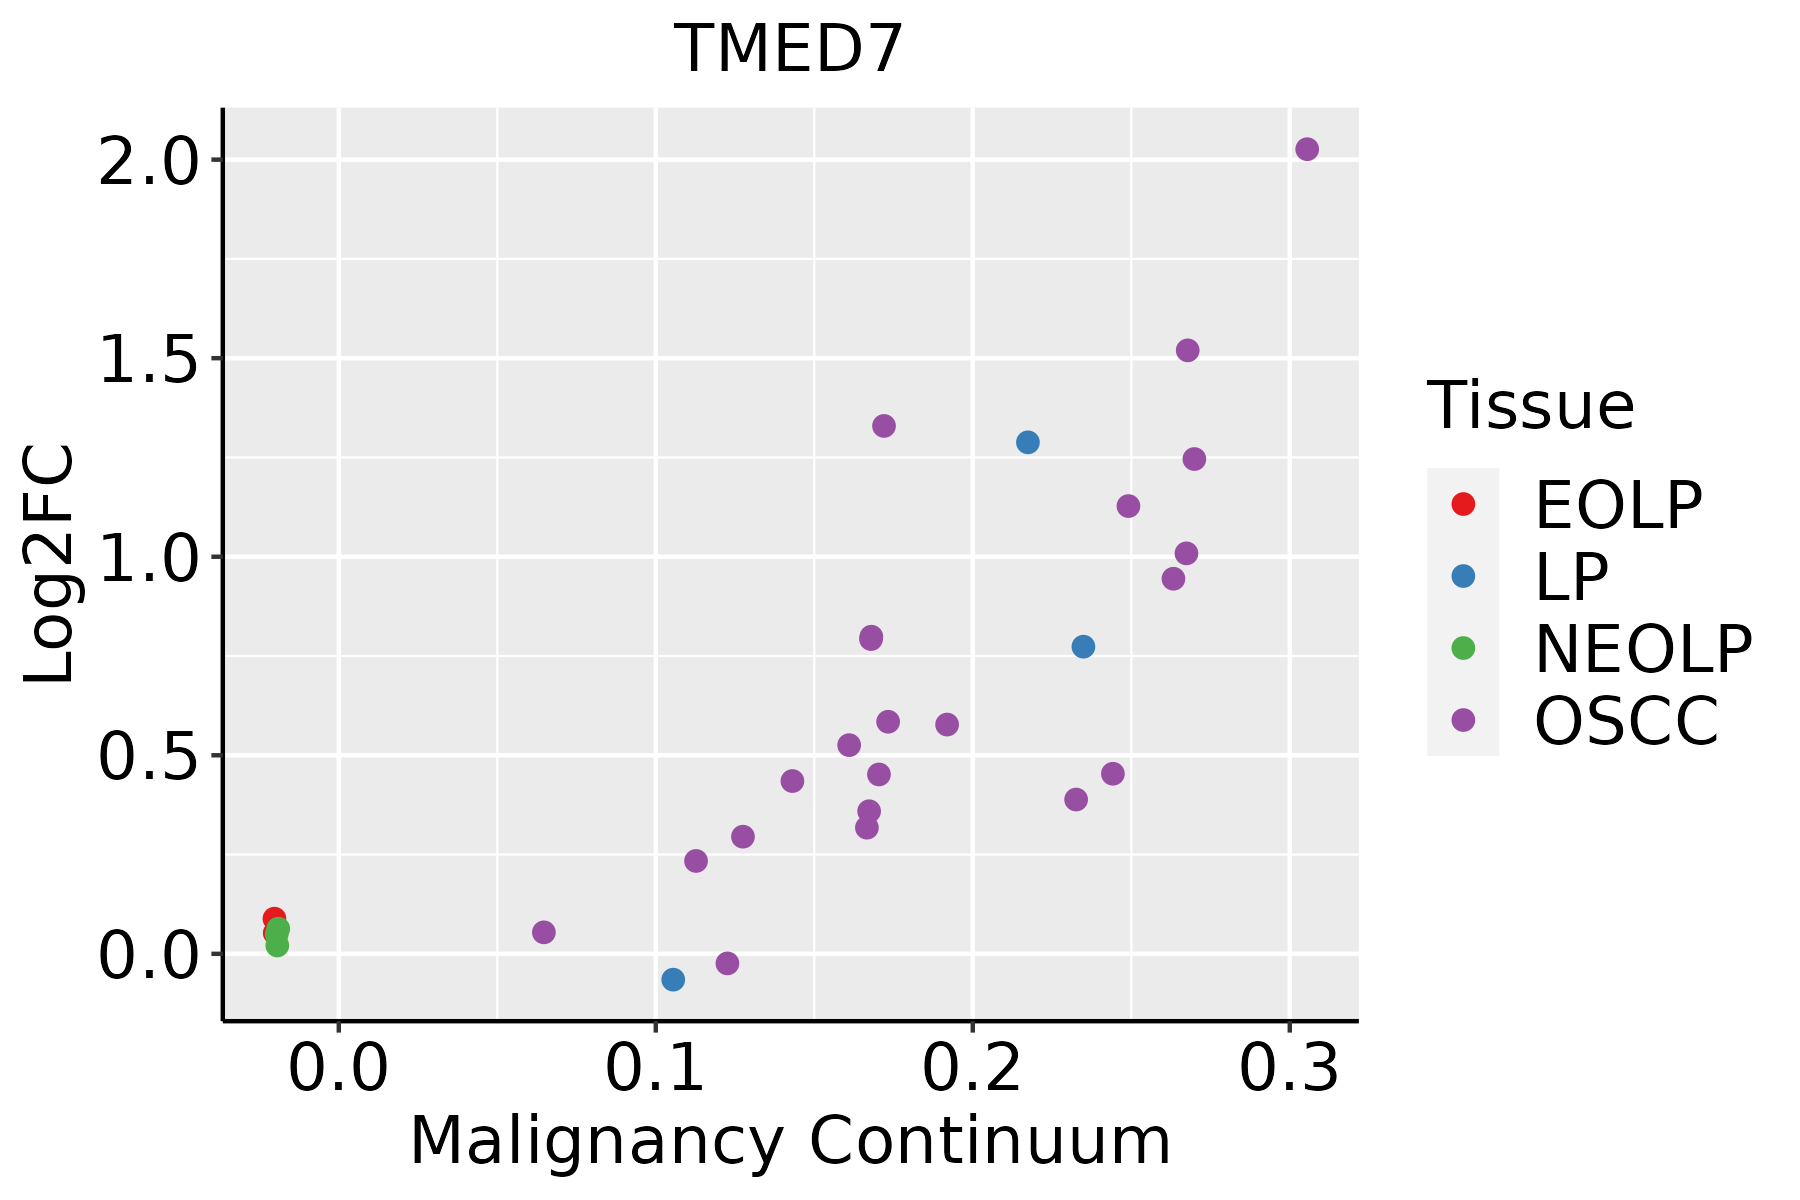 | EOLP: Erosive Oral lichen planus |
| LP: leukoplakia | ||
| NEOLP: Non-erosive oral lichen planus | ||
| OSCC: Oral squamous cell carcinoma | ||
| Skin | 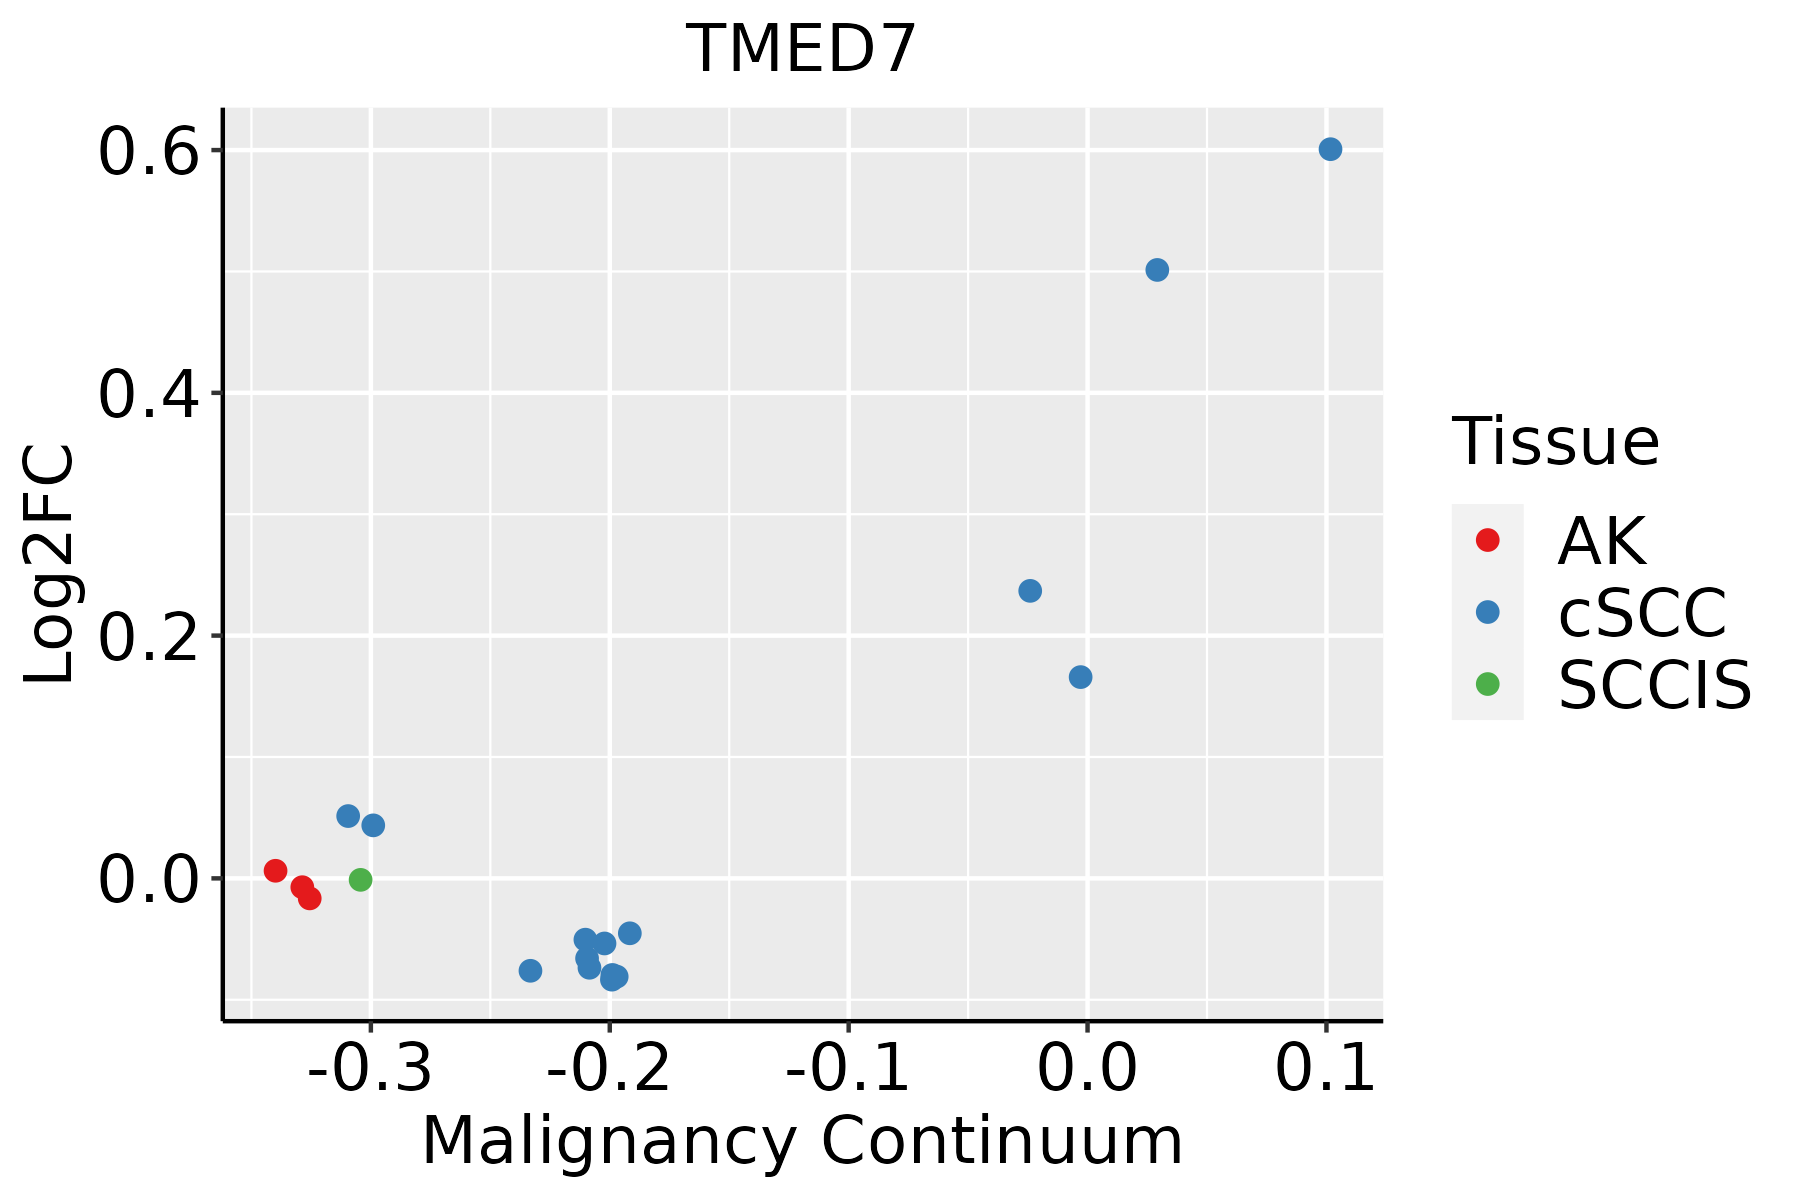 | AK: Actinic keratosis |
| cSCC: Cutaneous squamous cell carcinoma | ||
| SCCIS:squamous cell carcinoma in situ | ||
| Thyroid | 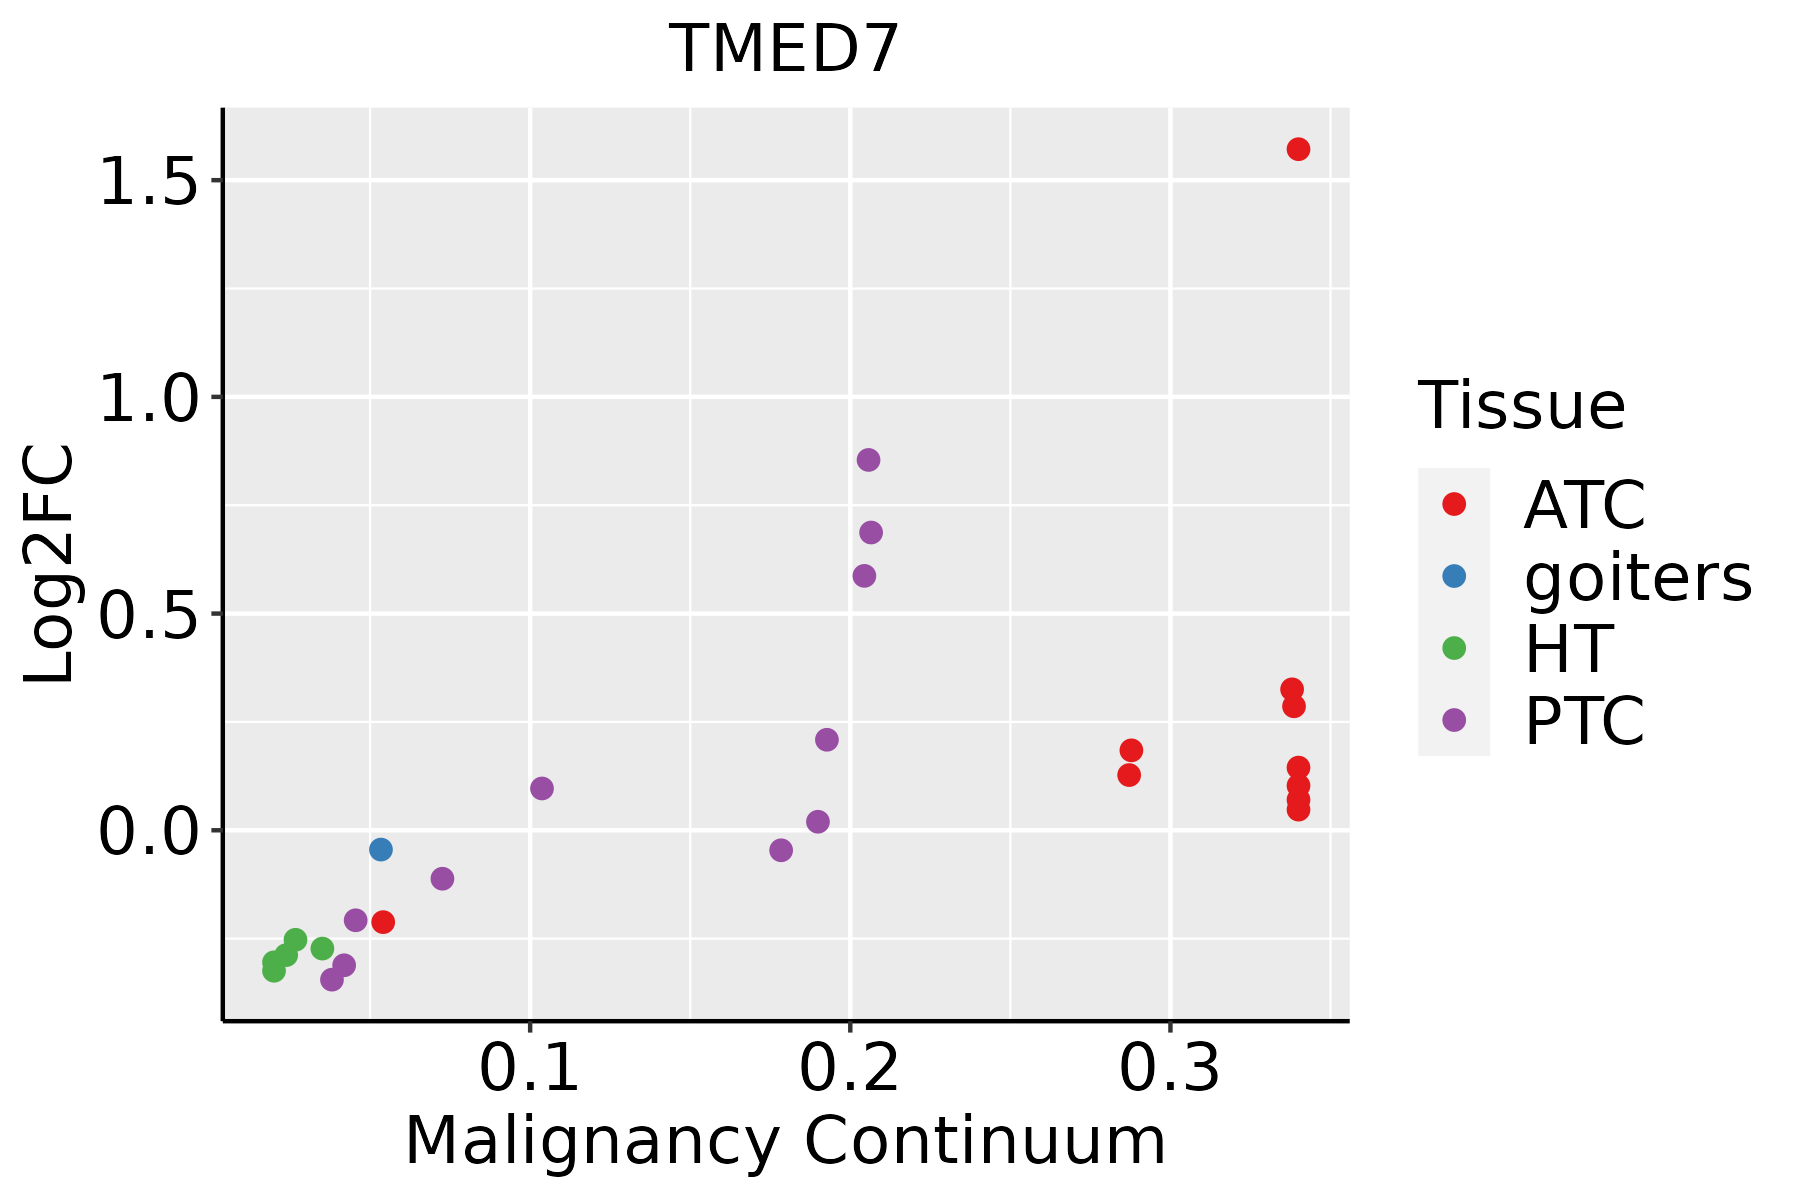 | ATC: Anaplastic thyroid cancer |
| HT: Hashimoto's thyroiditis | ||
| PTC: Papillary thyroid cancer |
| ∗log2FC in expression of this searched gene in stem-like cells from each diseased tissue sample relative to stem-like cells in normal samples in each tissue plotted against the malignancy continuum. Samples are colored based on if they are from different disease stage. |
Top |
Malignant transformation related pathway analysis |
| Find out the enriched GO biological processes and KEGG pathways involved in transition from healthy to precancer to cancer |
| Tissue | Disease Stage | Enriched GO biological Processes |
| Colorectum | AD |  |
| Colorectum | SER |  |
| Colorectum | MSS |  |
| Colorectum | MSI-H |  |
| Colorectum | FAP |  |
| ∗Top 15 enriched GO BP terms are showed in the bar plot of each disease state in each tissue. Each row represents a significant GO biological process which is colored according to the -log10(p.adjust). |
| Page: 1 2 3 4 5 6 7 8 9 |
| GO ID | Tissue | Disease Stage | Description | Gene Ratio | Bg Ratio | pvalue | p.adjust | Count |
| GO:004819318 | Esophagus | ESCC | Golgi vesicle transport | 231/8552 | 296/18723 | 1.82e-30 | 9.63e-28 | 231 |
| GO:000688815 | Esophagus | ESCC | endoplasmic reticulum to Golgi vesicle-mediated transport | 102/8552 | 130/18723 | 1.73e-14 | 9.22e-13 | 102 |
| GO:00070308 | Esophagus | ESCC | Golgi organization | 101/8552 | 157/18723 | 1.78e-06 | 2.10e-05 | 101 |
| GO:004819311 | Liver | Cirrhotic | Golgi vesicle transport | 153/4634 | 296/18723 | 1.02e-23 | 6.43e-21 | 153 |
| GO:000688811 | Liver | Cirrhotic | endoplasmic reticulum to Golgi vesicle-mediated transport | 77/4634 | 130/18723 | 5.78e-17 | 7.56e-15 | 77 |
| GO:00070301 | Liver | Cirrhotic | Golgi organization | 68/4634 | 157/18723 | 2.57e-07 | 6.41e-06 | 68 |
| GO:004819321 | Liver | HCC | Golgi vesicle transport | 217/7958 | 296/18723 | 2.58e-27 | 1.02e-24 | 217 |
| GO:000688821 | Liver | HCC | endoplasmic reticulum to Golgi vesicle-mediated transport | 100/7958 | 130/18723 | 1.15e-15 | 8.67e-14 | 100 |
| GO:00070302 | Liver | HCC | Golgi organization | 99/7958 | 157/18723 | 1.54e-07 | 2.85e-06 | 99 |
| GO:004819315 | Oral cavity | OSCC | Golgi vesicle transport | 209/7305 | 296/18723 | 1.39e-28 | 6.30e-26 | 209 |
| GO:00068888 | Oral cavity | OSCC | endoplasmic reticulum to Golgi vesicle-mediated transport | 97/7305 | 130/18723 | 1.42e-16 | 1.15e-14 | 97 |
| GO:00070307 | Oral cavity | OSCC | Golgi organization | 92/7305 | 157/18723 | 4.96e-07 | 7.27e-06 | 92 |
| GO:004819316 | Oral cavity | LP | Golgi vesicle transport | 141/4623 | 296/18723 | 6.11e-18 | 1.06e-15 | 141 |
| GO:000688814 | Oral cavity | LP | endoplasmic reticulum to Golgi vesicle-mediated transport | 67/4623 | 130/18723 | 3.74e-11 | 2.39e-09 | 67 |
| GO:0048193110 | Skin | cSCC | Golgi vesicle transport | 153/4864 | 296/18723 | 1.85e-21 | 3.41e-19 | 153 |
| GO:000688810 | Skin | cSCC | endoplasmic reticulum to Golgi vesicle-mediated transport | 73/4864 | 130/18723 | 2.60e-13 | 1.57e-11 | 73 |
| GO:00070309 | Skin | cSCC | Golgi organization | 64/4864 | 157/18723 | 3.53e-05 | 3.83e-04 | 64 |
| GO:000688816 | Thyroid | HT | endoplasmic reticulum to Golgi vesicle-mediated transport | 17/1272 | 130/18723 | 6.97e-03 | 4.22e-02 | 17 |
| GO:004819320 | Thyroid | PTC | Golgi vesicle transport | 186/5968 | 296/18723 | 3.09e-28 | 1.22e-25 | 186 |
| GO:000688817 | Thyroid | PTC | endoplasmic reticulum to Golgi vesicle-mediated transport | 83/5968 | 130/18723 | 6.19e-14 | 3.52e-12 | 83 |
| Page: 1 2 |
| Pathway ID | Tissue | Disease Stage | Description | Gene Ratio | Bg Ratio | pvalue | p.adjust | qvalue | Count |
| Page: 1 |
Top |
Cell-cell communication analysis |
| Identification of potential cell-cell interactions between two cell types and their ligand-receptor pairs for different disease states |
| Ligand | Receptor | LRpair | Pathway | Tissue | Disease Stage |
| Page: 1 |
Top |
Single-cell gene regulatory network inference analysis |
| Find out the significant the regulons (TFs) and the target genes of each regulon across cell types for different disease states |
| TF | Cell Type | Tissue | Disease Stage | Target Gene | RSS | Regulon Activity |
| ∗The dot plots of a searched regulon are shown for all cell subpopulations in each disease state of each tissue based on the regulon specific score inferred using pySCENIC and by calculating the average expression. |
| Page: 1 |
Top |
Somatic mutation of malignant transformation related genes |
| Annotation of somatic variants for genes involved in malignant transformation |
| Hugo Symbol | Variant Class | Variant Classification | dbSNP RS | HGVSc | HGVSp | HGVSp Short | SWISSPROT | BIOTYPE | SIFT | PolyPhen | Tumor Sample Barcode | Tissue | Histology | Sex | Age | Stage | Therapy Types | Drugs | Outcome |
| TMED7 | SNV | Missense_Mutation | novel | c.619N>A | p.Leu207Ile | p.L207I | Q9Y3B3 | protein_coding | tolerated(0.43) | benign(0.336) | TCGA-A5-A2K5-01 | Endometrium | uterine corpus endometrioid carcinoma | Female | >=65 | I/II | Unknown | Unknown | SD |
| TMED7 | SNV | Missense_Mutation | c.602N>A | p.Ser201Asn | p.S201N | Q9Y3B3 | protein_coding | deleterious(0.04) | probably_damaging(0.928) | TCGA-AP-A059-01 | Endometrium | uterine corpus endometrioid carcinoma | Female | >=65 | I/II | Unknown | Unknown | SD | |
| TMED7 | SNV | Missense_Mutation | novel | c.629G>A | p.Ser210Asn | p.S210N | Q9Y3B3 | protein_coding | tolerated(0.32) | possibly_damaging(0.677) | TCGA-EO-A22U-01 | Endometrium | uterine corpus endometrioid carcinoma | Female | >=65 | I/II | Unknown | Unknown | SD |
| Page: 1 |
Top |
Related drugs of malignant transformation related genes |
| Identification of chemicals and drugs interact with genes involved in malignant transfromation |
| (DGIdb 4.0) |
| Entrez ID | Symbol | Category | Interaction Types | Drug Claim Name | Drug Name | PMIDs |
| Page: 1 |

Copyright 2023-Present -The University of Texas Health Science Center at Houston |