
|
|||||
|
 | |
| |
| |
| |
| |
| |
|
Gene: TMED5 |
Gene summary for TMED5 |
| Gene information | Species | Human | Gene symbol | TMED5 | Gene ID | 50999 |
| Gene name | transmembrane p24 trafficking protein 5 | |
| Gene Alias | CGI-100 | |
| Cytomap | 1p22.1 | |
| Gene Type | protein-coding | GO ID | GO:0006810 | UniProtAcc | Q9Y3A6 |
Top |
Malignant transformation analysis |
| Identification of the aberrant gene expression in precancerous and cancerous lesions by comparing the gene expression of stem-like cells in diseased tissues with normal stem cells |
| Entrez ID | Symbol | Replicates | Species | Organ | Tissue | Adj P-value | Log2FC | Malignancy |
| 50999 | TMED5 | LZE4T | Human | Esophagus | ESCC | 2.29e-13 | 4.14e-01 | 0.0811 |
| 50999 | TMED5 | LZE8T | Human | Esophagus | ESCC | 8.31e-10 | 1.76e-01 | 0.067 |
| 50999 | TMED5 | LZE20T | Human | Esophagus | ESCC | 4.20e-11 | 1.69e-01 | 0.0662 |
| 50999 | TMED5 | LZE24T | Human | Esophagus | ESCC | 5.50e-16 | 4.52e-01 | 0.0596 |
| 50999 | TMED5 | LZE6T | Human | Esophagus | ESCC | 4.05e-04 | 1.56e-01 | 0.0845 |
| 50999 | TMED5 | P2T-E | Human | Esophagus | ESCC | 2.10e-26 | 4.39e-01 | 0.1177 |
| 50999 | TMED5 | P4T-E | Human | Esophagus | ESCC | 1.11e-17 | 4.56e-01 | 0.1323 |
| 50999 | TMED5 | P5T-E | Human | Esophagus | ESCC | 3.82e-16 | 3.63e-01 | 0.1327 |
| 50999 | TMED5 | P8T-E | Human | Esophagus | ESCC | 1.70e-23 | 4.30e-01 | 0.0889 |
| 50999 | TMED5 | P9T-E | Human | Esophagus | ESCC | 8.60e-17 | 4.26e-01 | 0.1131 |
| 50999 | TMED5 | P10T-E | Human | Esophagus | ESCC | 4.05e-24 | 4.62e-01 | 0.116 |
| 50999 | TMED5 | P11T-E | Human | Esophagus | ESCC | 5.98e-15 | 4.93e-01 | 0.1426 |
| 50999 | TMED5 | P12T-E | Human | Esophagus | ESCC | 3.71e-78 | 2.10e+00 | 0.1122 |
| 50999 | TMED5 | P15T-E | Human | Esophagus | ESCC | 9.95e-21 | 4.69e-01 | 0.1149 |
| 50999 | TMED5 | P16T-E | Human | Esophagus | ESCC | 2.42e-16 | 1.17e-01 | 0.1153 |
| 50999 | TMED5 | P17T-E | Human | Esophagus | ESCC | 2.60e-11 | 3.97e-01 | 0.1278 |
| 50999 | TMED5 | P19T-E | Human | Esophagus | ESCC | 4.79e-02 | 6.04e-01 | 0.1662 |
| 50999 | TMED5 | P20T-E | Human | Esophagus | ESCC | 7.65e-19 | 5.02e-01 | 0.1124 |
| 50999 | TMED5 | P21T-E | Human | Esophagus | ESCC | 1.47e-42 | 1.02e+00 | 0.1617 |
| 50999 | TMED5 | P22T-E | Human | Esophagus | ESCC | 2.21e-15 | 1.77e-01 | 0.1236 |
| Page: 1 2 3 4 5 6 |
| Tissue | Expression Dynamics | Abbreviation |
| Esophagus |  | ESCC: Esophageal squamous cell carcinoma |
| HGIN: High-grade intraepithelial neoplasias | ||
| LGIN: Low-grade intraepithelial neoplasias | ||
| Liver |  | HCC: Hepatocellular carcinoma |
| NAFLD: Non-alcoholic fatty liver disease | ||
| Oral Cavity | 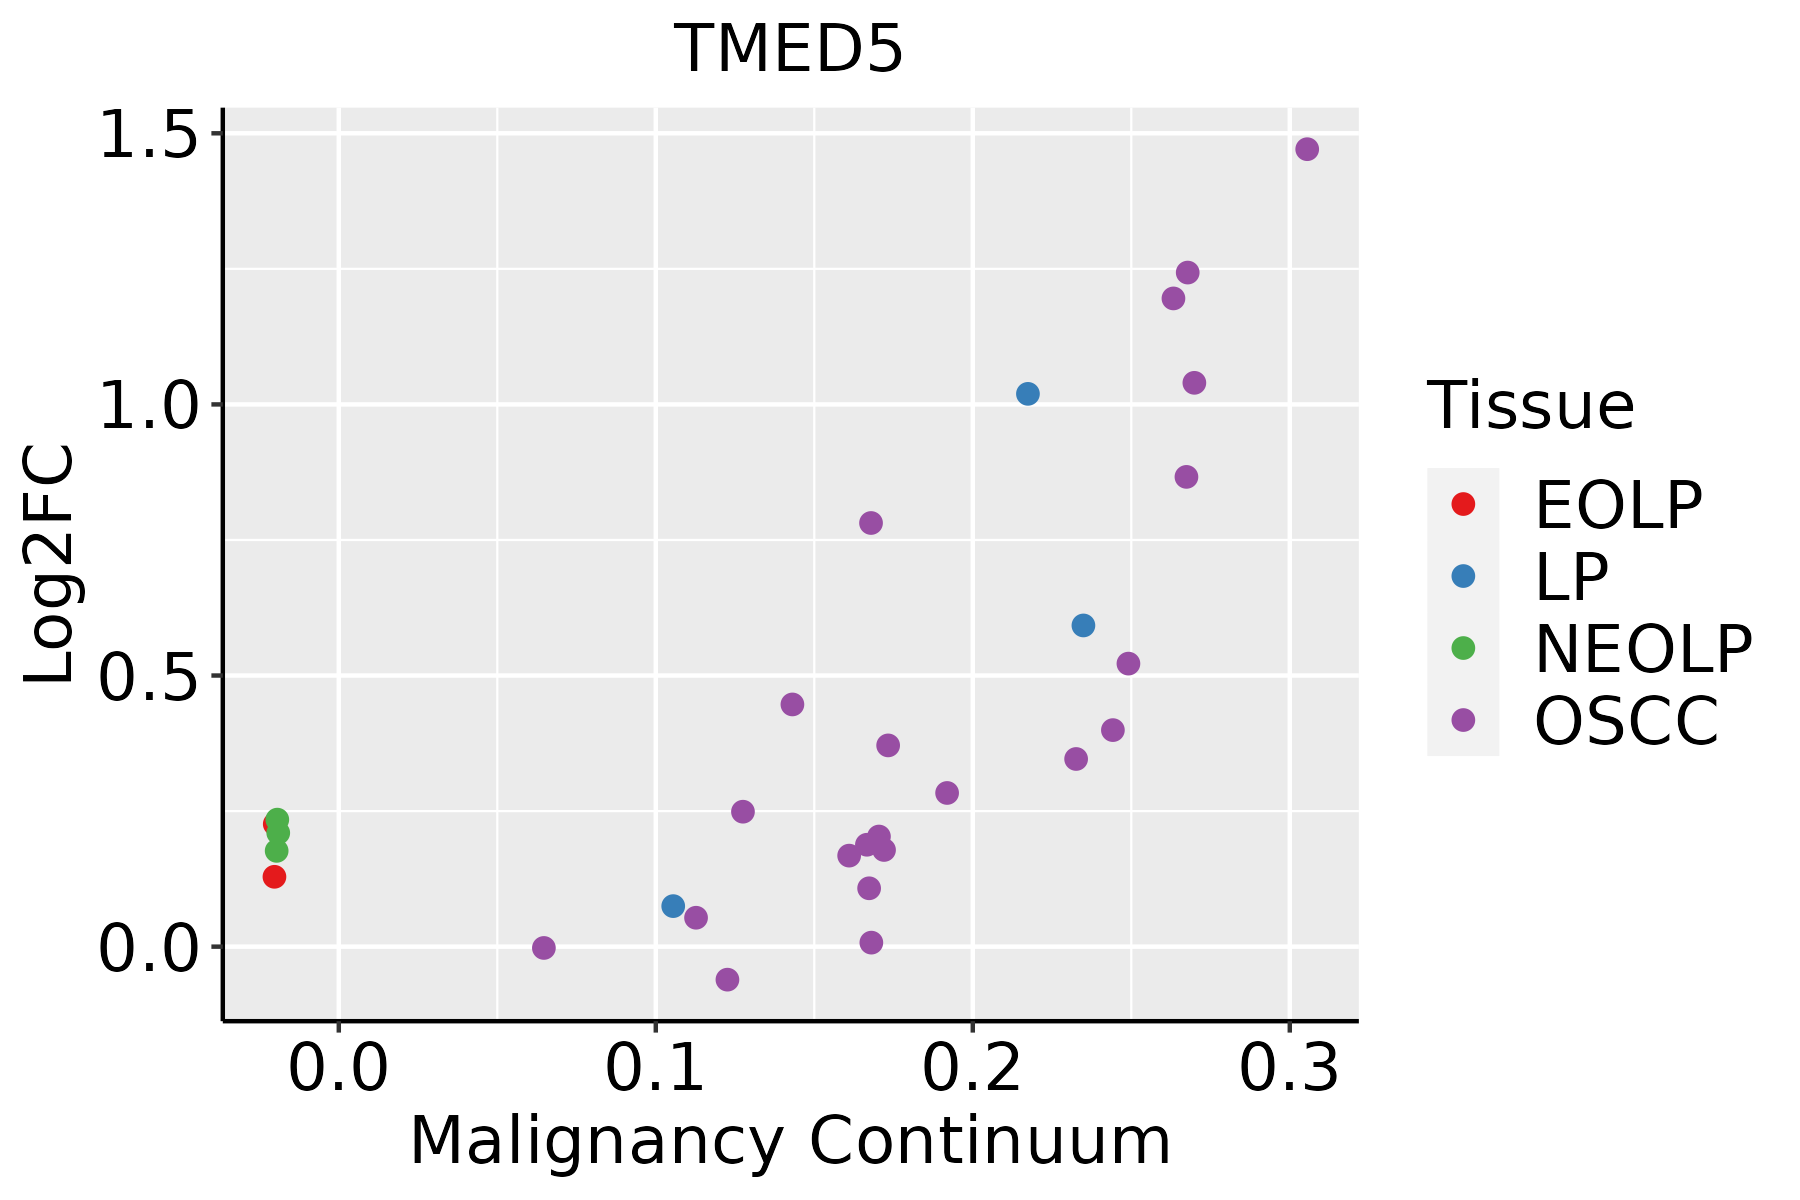 | EOLP: Erosive Oral lichen planus |
| LP: leukoplakia | ||
| NEOLP: Non-erosive oral lichen planus | ||
| OSCC: Oral squamous cell carcinoma | ||
| Prostate | 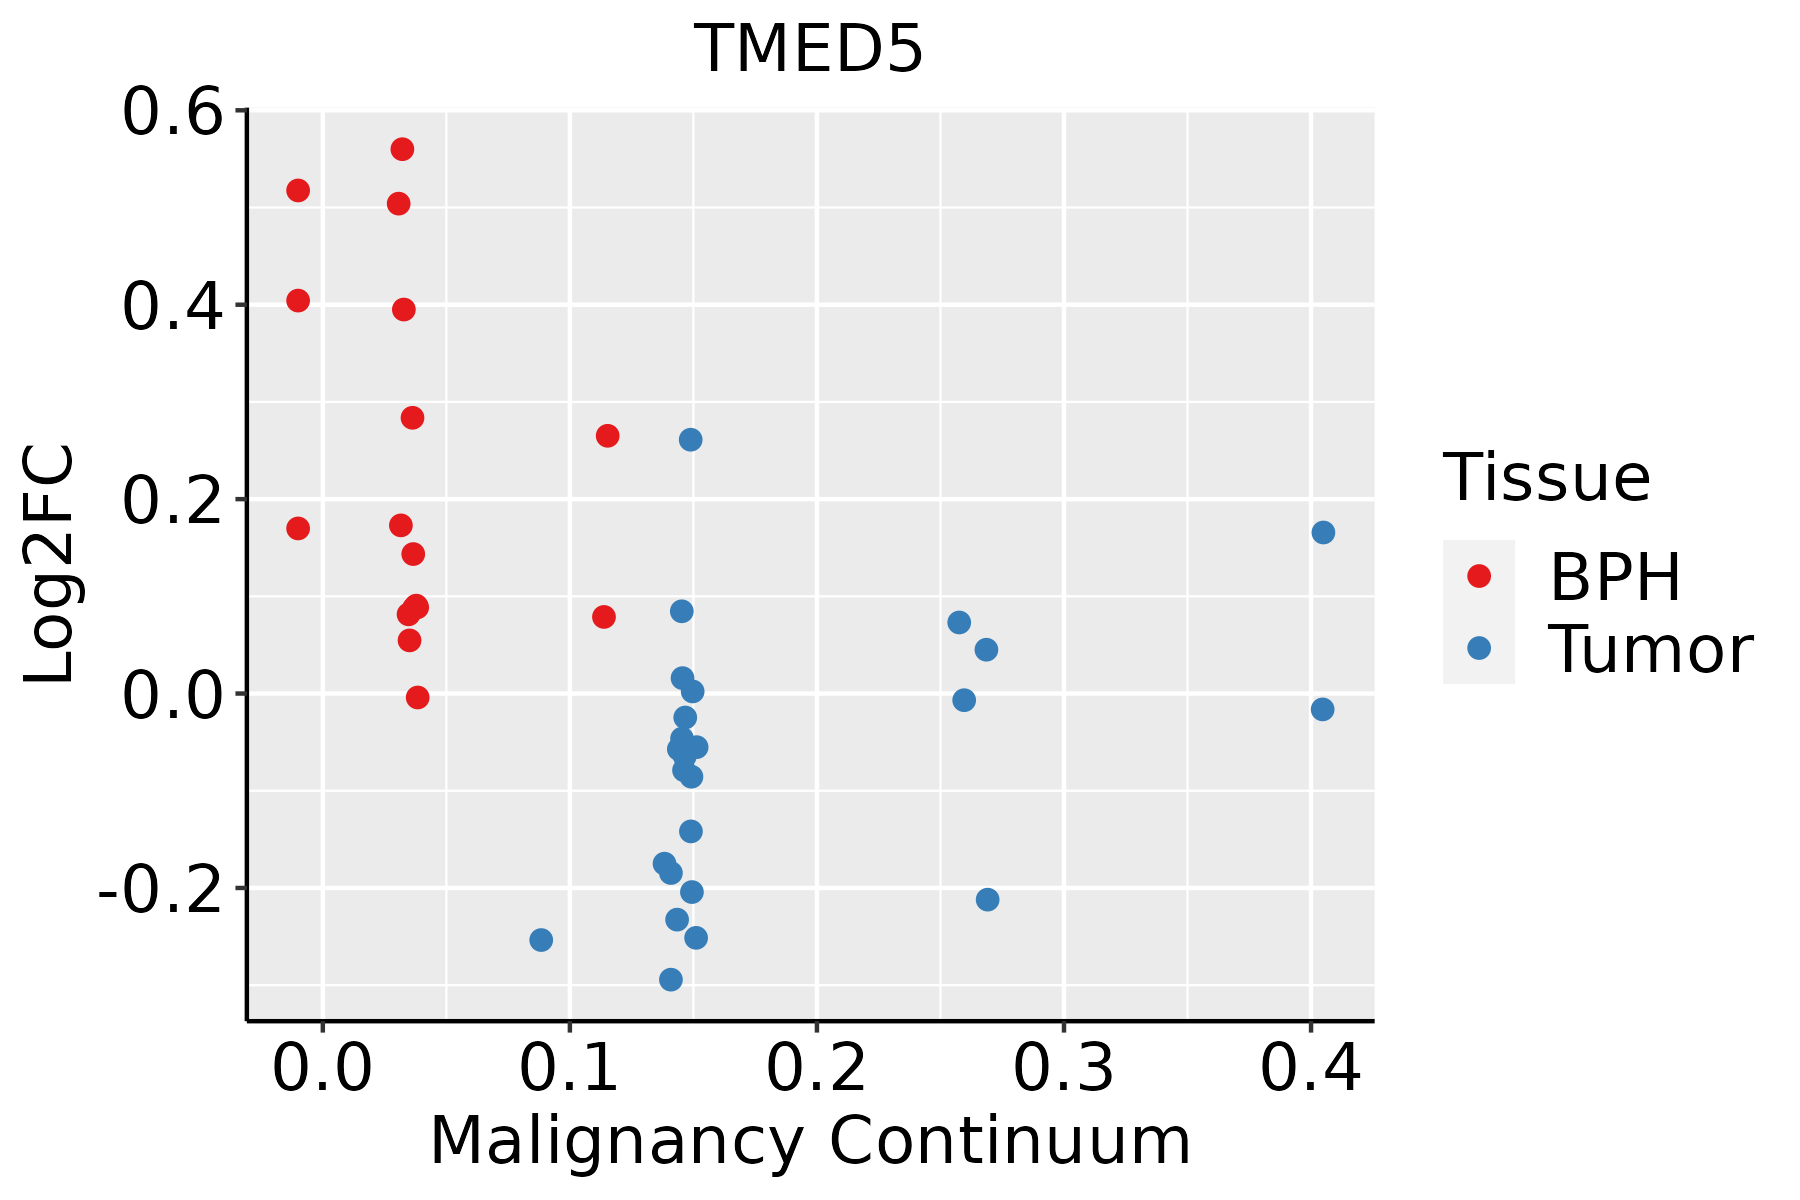 | BPH: Benign Prostatic Hyperplasia |
| Skin | 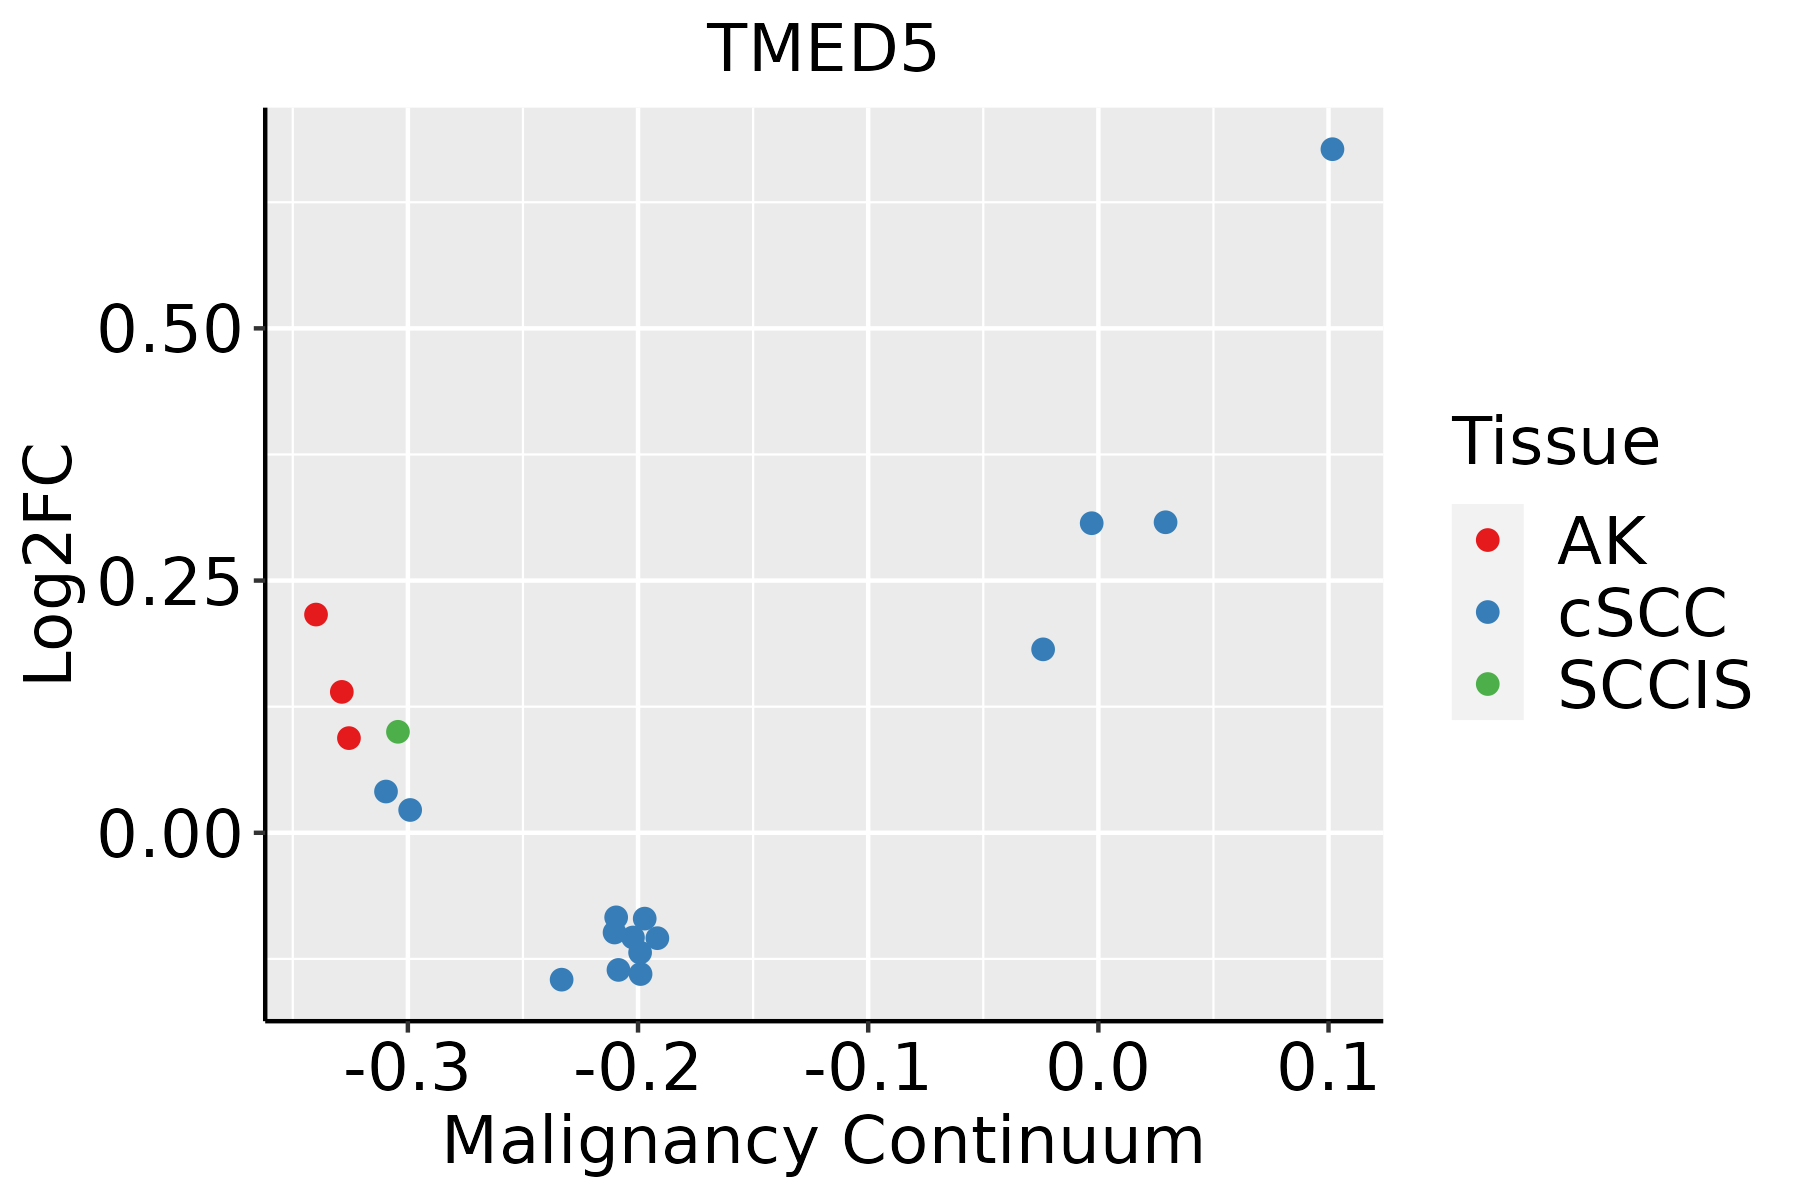 | AK: Actinic keratosis |
| cSCC: Cutaneous squamous cell carcinoma | ||
| SCCIS:squamous cell carcinoma in situ |
| ∗log2FC in expression of this searched gene in stem-like cells from each diseased tissue sample relative to stem-like cells in normal samples in each tissue plotted against the malignancy continuum. Samples are colored based on if they are from different disease stage. |
Top |
Malignant transformation related pathway analysis |
| Find out the enriched GO biological processes and KEGG pathways involved in transition from healthy to precancer to cancer |
| Tissue | Disease Stage | Enriched GO biological Processes |
| Colorectum | AD |  |
| Colorectum | SER |  |
| Colorectum | MSS |  |
| Colorectum | MSI-H |  |
| Colorectum | FAP |  |
| ∗Top 15 enriched GO BP terms are showed in the bar plot of each disease state in each tissue. Each row represents a significant GO biological process which is colored according to the -log10(p.adjust). |
| Page: 1 2 3 4 5 6 7 8 9 |
| GO ID | Tissue | Disease Stage | Description | Gene Ratio | Bg Ratio | pvalue | p.adjust | Count |
| GO:004819318 | Esophagus | ESCC | Golgi vesicle transport | 231/8552 | 296/18723 | 1.82e-30 | 9.63e-28 | 231 |
| GO:000688815 | Esophagus | ESCC | endoplasmic reticulum to Golgi vesicle-mediated transport | 102/8552 | 130/18723 | 1.73e-14 | 9.22e-13 | 102 |
| GO:00070308 | Esophagus | ESCC | Golgi organization | 101/8552 | 157/18723 | 1.78e-06 | 2.10e-05 | 101 |
| GO:00901614 | Esophagus | ESCC | Golgi ribbon formation | 11/8552 | 13/18723 | 4.76e-03 | 1.85e-02 | 11 |
| GO:004819311 | Liver | Cirrhotic | Golgi vesicle transport | 153/4634 | 296/18723 | 1.02e-23 | 6.43e-21 | 153 |
| GO:000688811 | Liver | Cirrhotic | endoplasmic reticulum to Golgi vesicle-mediated transport | 77/4634 | 130/18723 | 5.78e-17 | 7.56e-15 | 77 |
| GO:00070301 | Liver | Cirrhotic | Golgi organization | 68/4634 | 157/18723 | 2.57e-07 | 6.41e-06 | 68 |
| GO:00901611 | Liver | Cirrhotic | Golgi ribbon formation | 9/4634 | 13/18723 | 9.10e-04 | 6.49e-03 | 9 |
| GO:004819321 | Liver | HCC | Golgi vesicle transport | 217/7958 | 296/18723 | 2.58e-27 | 1.02e-24 | 217 |
| GO:000688821 | Liver | HCC | endoplasmic reticulum to Golgi vesicle-mediated transport | 100/7958 | 130/18723 | 1.15e-15 | 8.67e-14 | 100 |
| GO:00070302 | Liver | HCC | Golgi organization | 99/7958 | 157/18723 | 1.54e-07 | 2.85e-06 | 99 |
| GO:00901612 | Liver | HCC | Golgi ribbon formation | 11/7958 | 13/18723 | 2.38e-03 | 1.16e-02 | 11 |
| GO:004819315 | Oral cavity | OSCC | Golgi vesicle transport | 209/7305 | 296/18723 | 1.39e-28 | 6.30e-26 | 209 |
| GO:00068888 | Oral cavity | OSCC | endoplasmic reticulum to Golgi vesicle-mediated transport | 97/7305 | 130/18723 | 1.42e-16 | 1.15e-14 | 97 |
| GO:00070307 | Oral cavity | OSCC | Golgi organization | 92/7305 | 157/18723 | 4.96e-07 | 7.27e-06 | 92 |
| GO:00901613 | Oral cavity | OSCC | Golgi ribbon formation | 11/7305 | 13/18723 | 1.02e-03 | 5.29e-03 | 11 |
| GO:004819322 | Oral cavity | EOLP | Golgi vesicle transport | 72/2218 | 296/18723 | 1.43e-09 | 9.55e-08 | 72 |
| GO:000703014 | Oral cavity | EOLP | Golgi organization | 37/2218 | 157/18723 | 2.83e-05 | 4.12e-04 | 37 |
| GO:009016111 | Oral cavity | EOLP | Golgi ribbon formation | 7/2218 | 13/18723 | 2.90e-04 | 2.74e-03 | 7 |
| GO:000688822 | Oral cavity | EOLP | endoplasmic reticulum to Golgi vesicle-mediated transport | 29/2218 | 130/18723 | 5.29e-04 | 4.56e-03 | 29 |
| Page: 1 2 |
| Pathway ID | Tissue | Disease Stage | Description | Gene Ratio | Bg Ratio | pvalue | p.adjust | qvalue | Count |
| Page: 1 |
Top |
Cell-cell communication analysis |
| Identification of potential cell-cell interactions between two cell types and their ligand-receptor pairs for different disease states |
| Ligand | Receptor | LRpair | Pathway | Tissue | Disease Stage |
| Page: 1 |
Top |
Single-cell gene regulatory network inference analysis |
| Find out the significant the regulons (TFs) and the target genes of each regulon across cell types for different disease states |
| TF | Cell Type | Tissue | Disease Stage | Target Gene | RSS | Regulon Activity |
| ∗The dot plots of a searched regulon are shown for all cell subpopulations in each disease state of each tissue based on the regulon specific score inferred using pySCENIC and by calculating the average expression. |
| Page: 1 |
Top |
Somatic mutation of malignant transformation related genes |
| Annotation of somatic variants for genes involved in malignant transformation |
| Hugo Symbol | Variant Class | Variant Classification | dbSNP RS | HGVSc | HGVSp | HGVSp Short | SWISSPROT | BIOTYPE | SIFT | PolyPhen | Tumor Sample Barcode | Tissue | Histology | Sex | Age | Stage | Therapy Types | Drugs | Outcome |
| TMED5 | SNV | Missense_Mutation | c.637N>G | p.Gln213Glu | p.Q213E | Q9Y3A6 | protein_coding | deleterious(0) | probably_damaging(0.999) | TCGA-DG-A2KM-01 | Cervix | cervical & endocervical cancer | Female | <65 | I/II | Chemotherapy | cisplatin | SD | |
| TMED5 | SNV | Missense_Mutation | c.420N>C | p.Lys140Asn | p.K140N | Q9Y3A6 | protein_coding | tolerated(0.18) | possibly_damaging(0.837) | TCGA-JW-A5VL-01 | Cervix | cervical & endocervical cancer | Female | <65 | I/II | Unknown | Unknown | SD | |
| TMED5 | SNV | Missense_Mutation | novel | c.65N>C | p.Leu22Pro | p.L22P | Q9Y3A6 | protein_coding | tolerated(0.11) | benign(0.001) | TCGA-5M-AAT6-01 | Colorectum | colon adenocarcinoma | Female | <65 | III/IV | Unknown | Unknown | PD |
| TMED5 | SNV | Missense_Mutation | c.363C>A | p.Phe121Leu | p.F121L | Q9Y3A6 | protein_coding | deleterious(0) | probably_damaging(0.992) | TCGA-AA-3510-01 | Colorectum | colon adenocarcinoma | Male | >=65 | I/II | Unknown | Unknown | SD | |
| TMED5 | SNV | Missense_Mutation | novel | c.589N>G | p.Phe197Val | p.F197V | Q9Y3A6 | protein_coding | deleterious(0.01) | probably_damaging(0.973) | TCGA-CA-6717-01 | Colorectum | colon adenocarcinoma | Male | <65 | I/II | Chemotherapy | oxaliplatin | CR |
| TMED5 | SNV | Missense_Mutation | novel | c.454A>G | p.Lys152Glu | p.K152E | Q9Y3A6 | protein_coding | deleterious(0) | possibly_damaging(0.897) | TCGA-AG-A002-01 | Colorectum | rectum adenocarcinoma | Male | <65 | I/II | Unknown | Unknown | SD |
| TMED5 | SNV | Missense_Mutation | novel | c.678N>C | p.Lys226Asn | p.K226N | Q9Y3A6 | protein_coding | deleterious(0.02) | possibly_damaging(0.635) | TCGA-AX-A05Z-01 | Endometrium | uterine corpus endometrioid carcinoma | Female | <65 | III/IV | Chemotherapy | adriamycin | SD |
| TMED5 | SNV | Missense_Mutation | novel | c.641N>C | p.Val214Ala | p.V214A | Q9Y3A6 | protein_coding | deleterious(0) | probably_damaging(0.991) | TCGA-AX-A06F-01 | Endometrium | uterine corpus endometrioid carcinoma | Female | <65 | III/IV | Chemotherapy | carboplatin | SD |
| TMED5 | SNV | Missense_Mutation | c.411A>C | p.Glu137Asp | p.E137D | Q9Y3A6 | protein_coding | tolerated(0.4) | benign(0.023) | TCGA-D1-A17Q-01 | Endometrium | uterine corpus endometrioid carcinoma | Female | <65 | I/II | Unknown | Unknown | SD | |
| TMED5 | SNV | Missense_Mutation | novel | c.412N>A | p.Asp138Asn | p.D138N | Q9Y3A6 | protein_coding | tolerated(0.28) | benign(0.058) | TCGA-E6-A1LX-01 | Endometrium | uterine corpus endometrioid carcinoma | Female | <65 | I/II | Unknown | Unknown | SD |
| Page: 1 2 |
Top |
Related drugs of malignant transformation related genes |
| Identification of chemicals and drugs interact with genes involved in malignant transfromation |
| (DGIdb 4.0) |
| Entrez ID | Symbol | Category | Interaction Types | Drug Claim Name | Drug Name | PMIDs |
| Page: 1 |

Copyright 2023-Present -The University of Texas Health Science Center at Houston |