
|
|||||
|
 | |
| |
| |
| |
| |
| |
|
Gene: TMED4 |
Gene summary for TMED4 |
| Gene information | Species | Human | Gene symbol | TMED4 | Gene ID | 222068 |
| Gene name | transmembrane p24 trafficking protein 4 | |
| Gene Alias | ERS25 | |
| Cytomap | 7p13 | |
| Gene Type | protein-coding | GO ID | GO:0006810 | UniProtAcc | Q7Z7H5 |
Top |
Malignant transformation analysis |
| Identification of the aberrant gene expression in precancerous and cancerous lesions by comparing the gene expression of stem-like cells in diseased tissues with normal stem cells |
| Entrez ID | Symbol | Replicates | Species | Organ | Tissue | Adj P-value | Log2FC | Malignancy |
| 222068 | TMED4 | HTA11_2487_2000001011 | Human | Colorectum | SER | 5.05e-04 | 3.76e-01 | -0.1808 |
| 222068 | TMED4 | HTA11_1938_2000001011 | Human | Colorectum | AD | 6.23e-05 | 4.73e-01 | -0.0811 |
| 222068 | TMED4 | HTA11_78_2000001011 | Human | Colorectum | AD | 9.34e-06 | 4.37e-01 | -0.1088 |
| 222068 | TMED4 | HTA11_347_2000001011 | Human | Colorectum | AD | 1.72e-16 | 5.89e-01 | -0.1954 |
| 222068 | TMED4 | HTA11_696_2000001011 | Human | Colorectum | AD | 3.13e-10 | 3.94e-01 | -0.1464 |
| 222068 | TMED4 | HTA11_1391_2000001011 | Human | Colorectum | AD | 2.65e-07 | 4.46e-01 | -0.059 |
| 222068 | TMED4 | HTA11_546_2000001011 | Human | Colorectum | AD | 3.15e-02 | 3.07e-01 | -0.0842 |
| 222068 | TMED4 | HTA11_866_3004761011 | Human | Colorectum | AD | 7.38e-10 | 4.42e-01 | 0.096 |
| 222068 | TMED4 | HTA11_99999970781_79442 | Human | Colorectum | MSS | 2.10e-07 | 3.91e-01 | 0.294 |
| 222068 | TMED4 | HTA11_99999965062_69753 | Human | Colorectum | MSI-H | 7.93e-03 | 9.28e-01 | 0.3487 |
| 222068 | TMED4 | HTA11_99999965104_69814 | Human | Colorectum | MSS | 4.23e-06 | 4.30e-01 | 0.281 |
| 222068 | TMED4 | HTA11_99999971662_82457 | Human | Colorectum | MSS | 1.17e-14 | 5.83e-01 | 0.3859 |
| 222068 | TMED4 | HTA11_99999974143_84620 | Human | Colorectum | MSS | 3.38e-08 | 4.06e-01 | 0.3005 |
| 222068 | TMED4 | A002-C-116 | Human | Colorectum | FAP | 2.00e-05 | -9.70e-02 | -0.0452 |
| 222068 | TMED4 | AEH-subject1 | Human | Endometrium | AEH | 1.80e-08 | -3.59e-01 | -0.3059 |
| 222068 | TMED4 | AEH-subject2 | Human | Endometrium | AEH | 8.06e-13 | -3.77e-01 | -0.2525 |
| 222068 | TMED4 | AEH-subject3 | Human | Endometrium | AEH | 3.11e-14 | -3.47e-01 | -0.2576 |
| 222068 | TMED4 | AEH-subject4 | Human | Endometrium | AEH | 2.17e-05 | -3.17e-01 | -0.2657 |
| 222068 | TMED4 | AEH-subject5 | Human | Endometrium | AEH | 8.71e-08 | -3.86e-01 | -0.2953 |
| 222068 | TMED4 | EEC-subject1 | Human | Endometrium | EEC | 2.53e-14 | -3.27e-01 | -0.2682 |
| Page: 1 2 3 4 5 6 7 8 9 |
| Tissue | Expression Dynamics | Abbreviation |
| Colorectum (GSE201348) |  | FAP: Familial adenomatous polyposis |
| CRC: Colorectal cancer | ||
| Colorectum (HTA11) |  | AD: Adenomas |
| SER: Sessile serrated lesions | ||
| MSI-H: Microsatellite-high colorectal cancer | ||
| MSS: Microsatellite stable colorectal cancer | ||
| Endometrium | 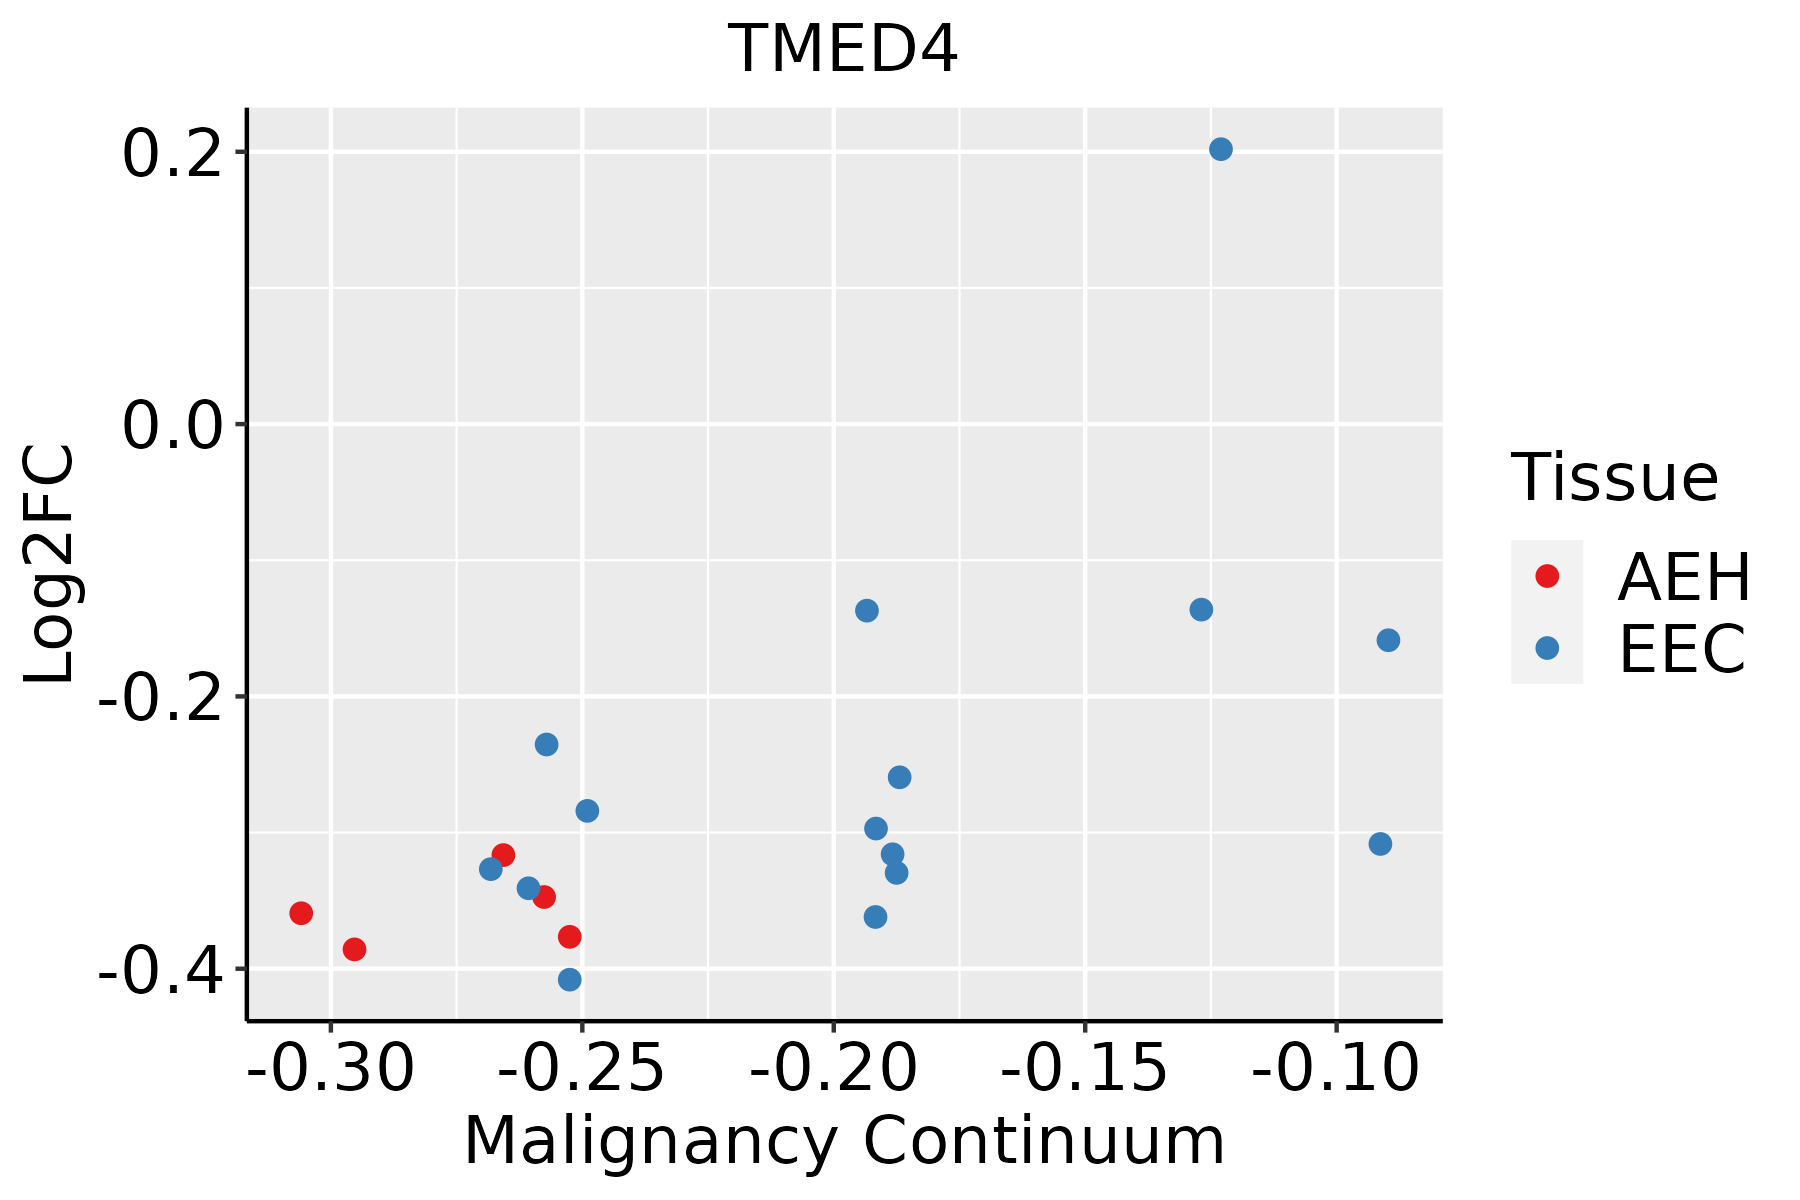 | AEH: Atypical endometrial hyperplasia |
| EEC: Endometrioid Cancer | ||
| Esophagus |  | ESCC: Esophageal squamous cell carcinoma |
| HGIN: High-grade intraepithelial neoplasias | ||
| LGIN: Low-grade intraepithelial neoplasias | ||
| Liver | 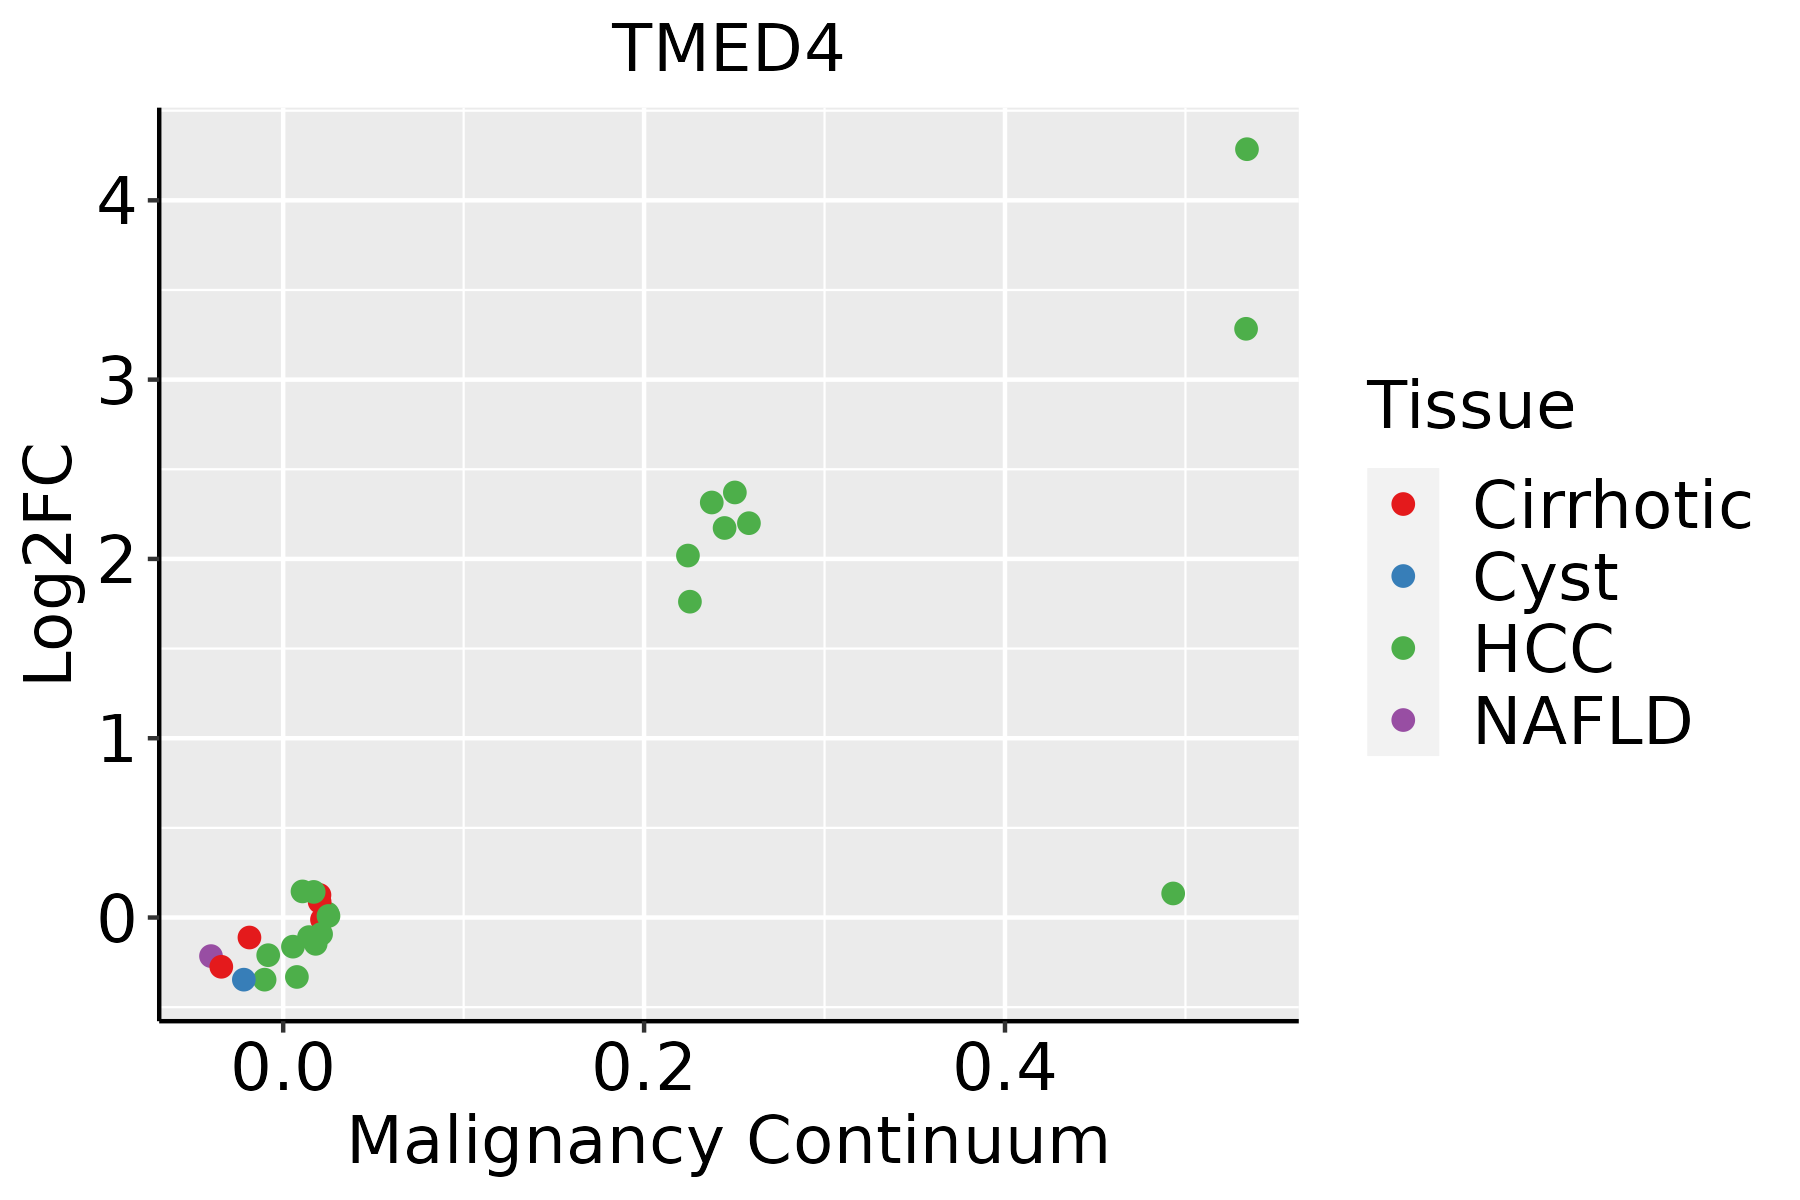 | HCC: Hepatocellular carcinoma |
| NAFLD: Non-alcoholic fatty liver disease | ||
| Oral Cavity | 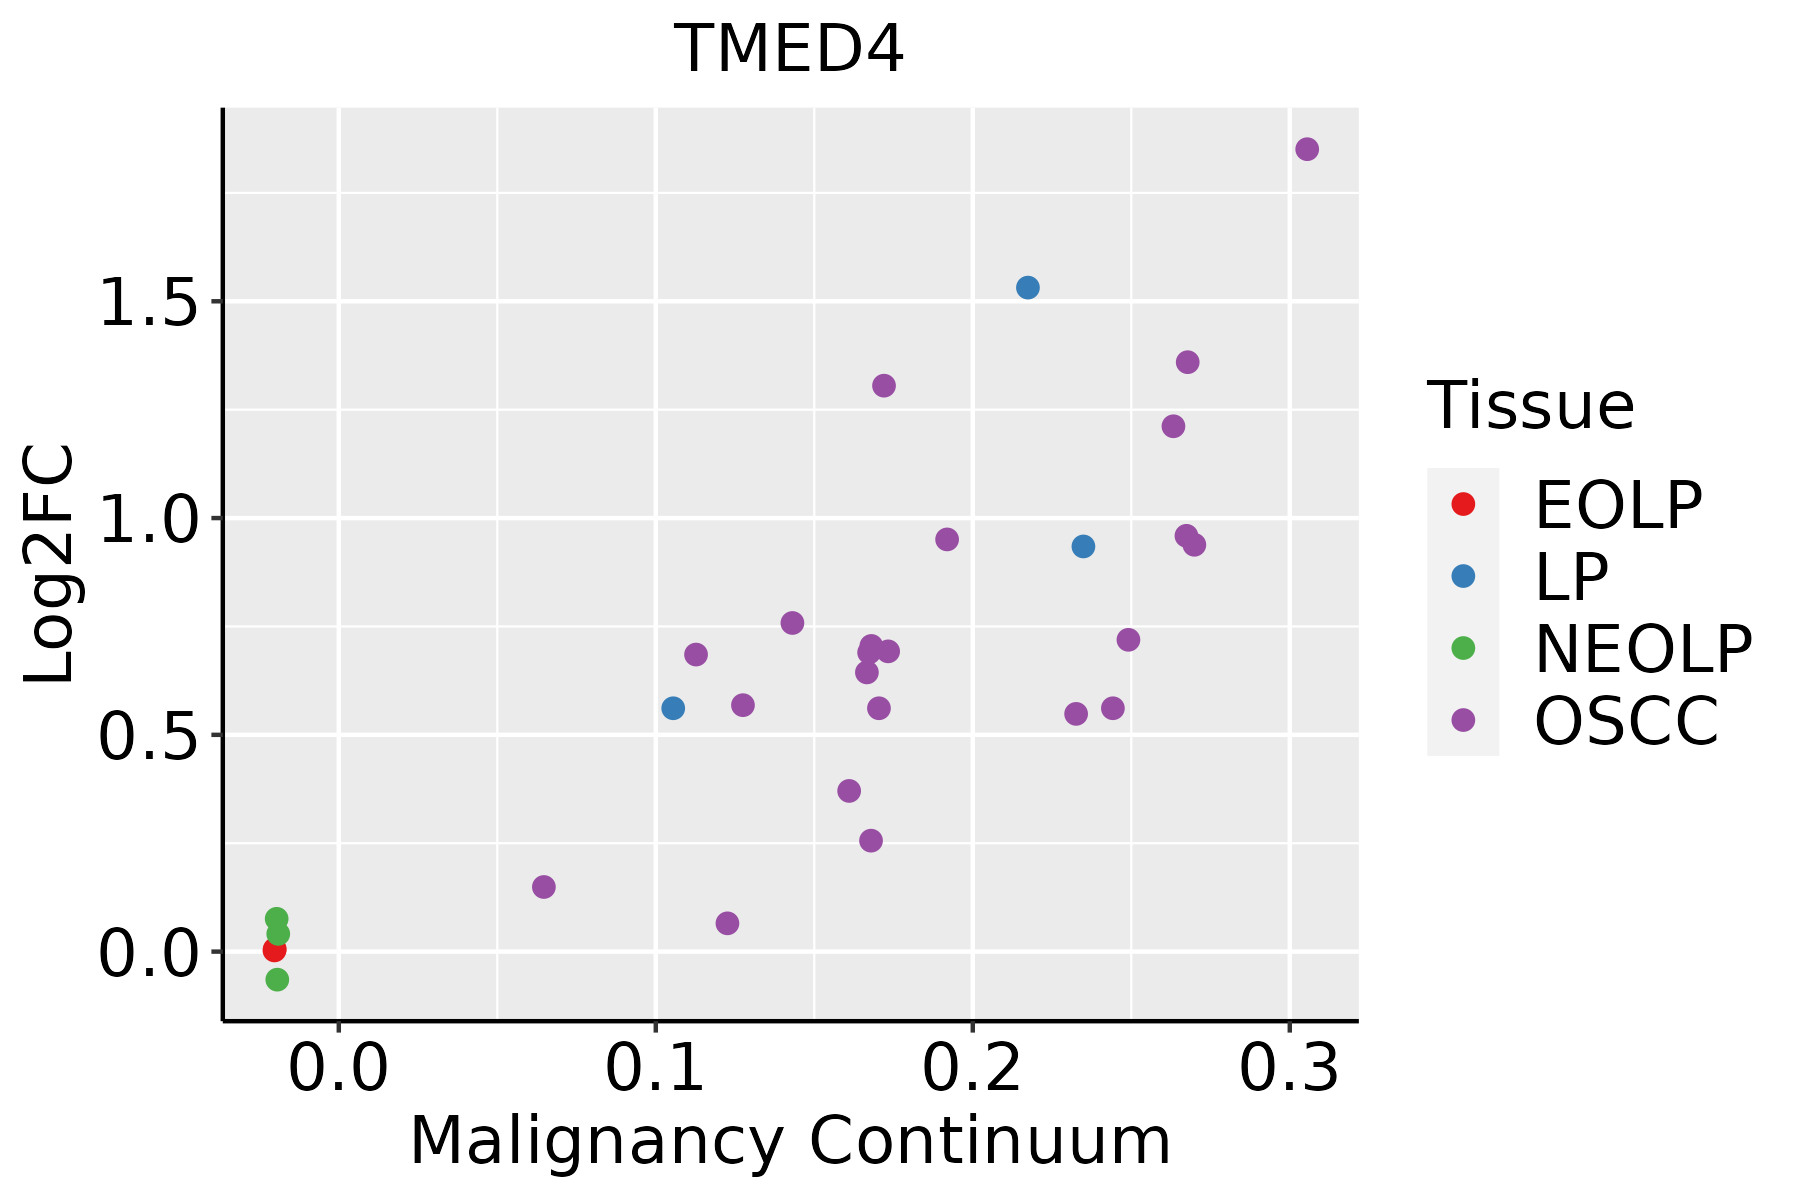 | EOLP: Erosive Oral lichen planus |
| LP: leukoplakia | ||
| NEOLP: Non-erosive oral lichen planus | ||
| OSCC: Oral squamous cell carcinoma | ||
| Prostate | 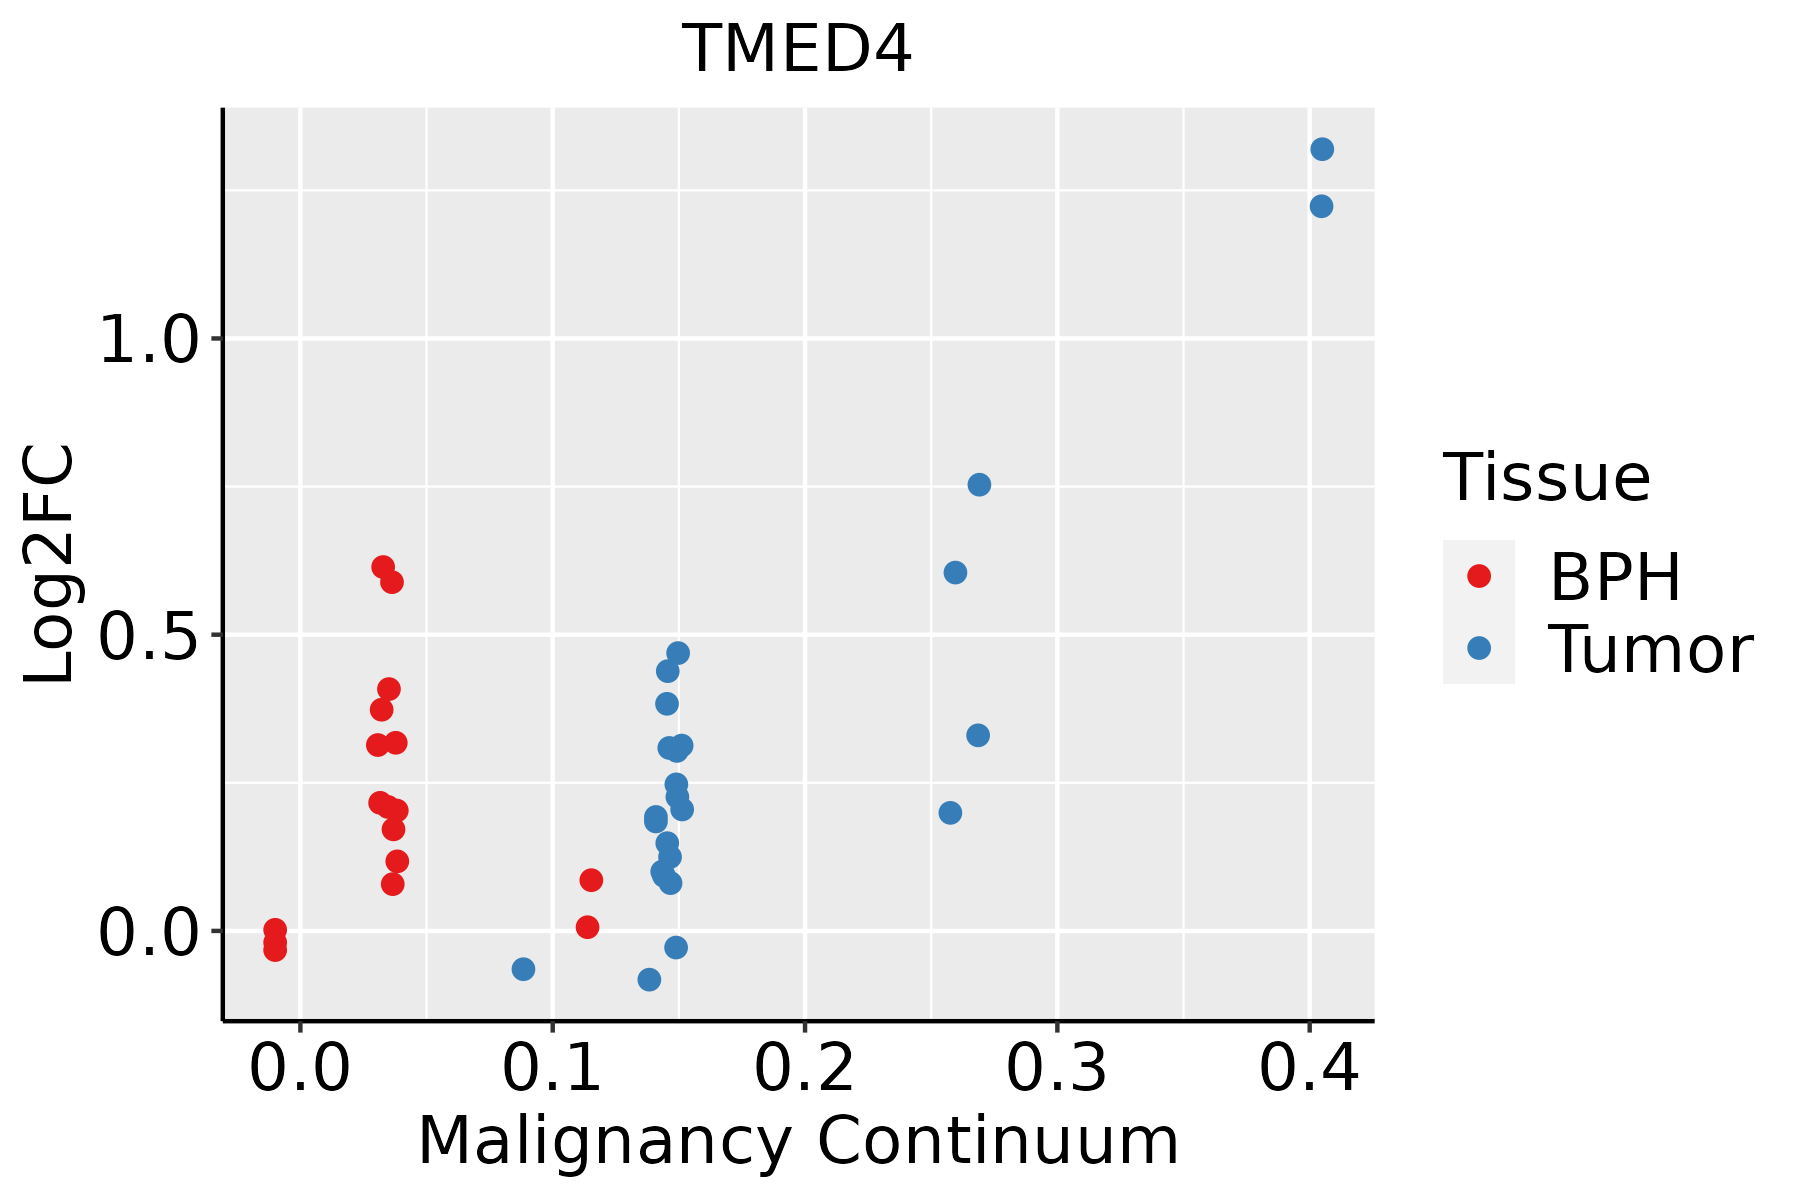 | BPH: Benign Prostatic Hyperplasia |
| Skin | 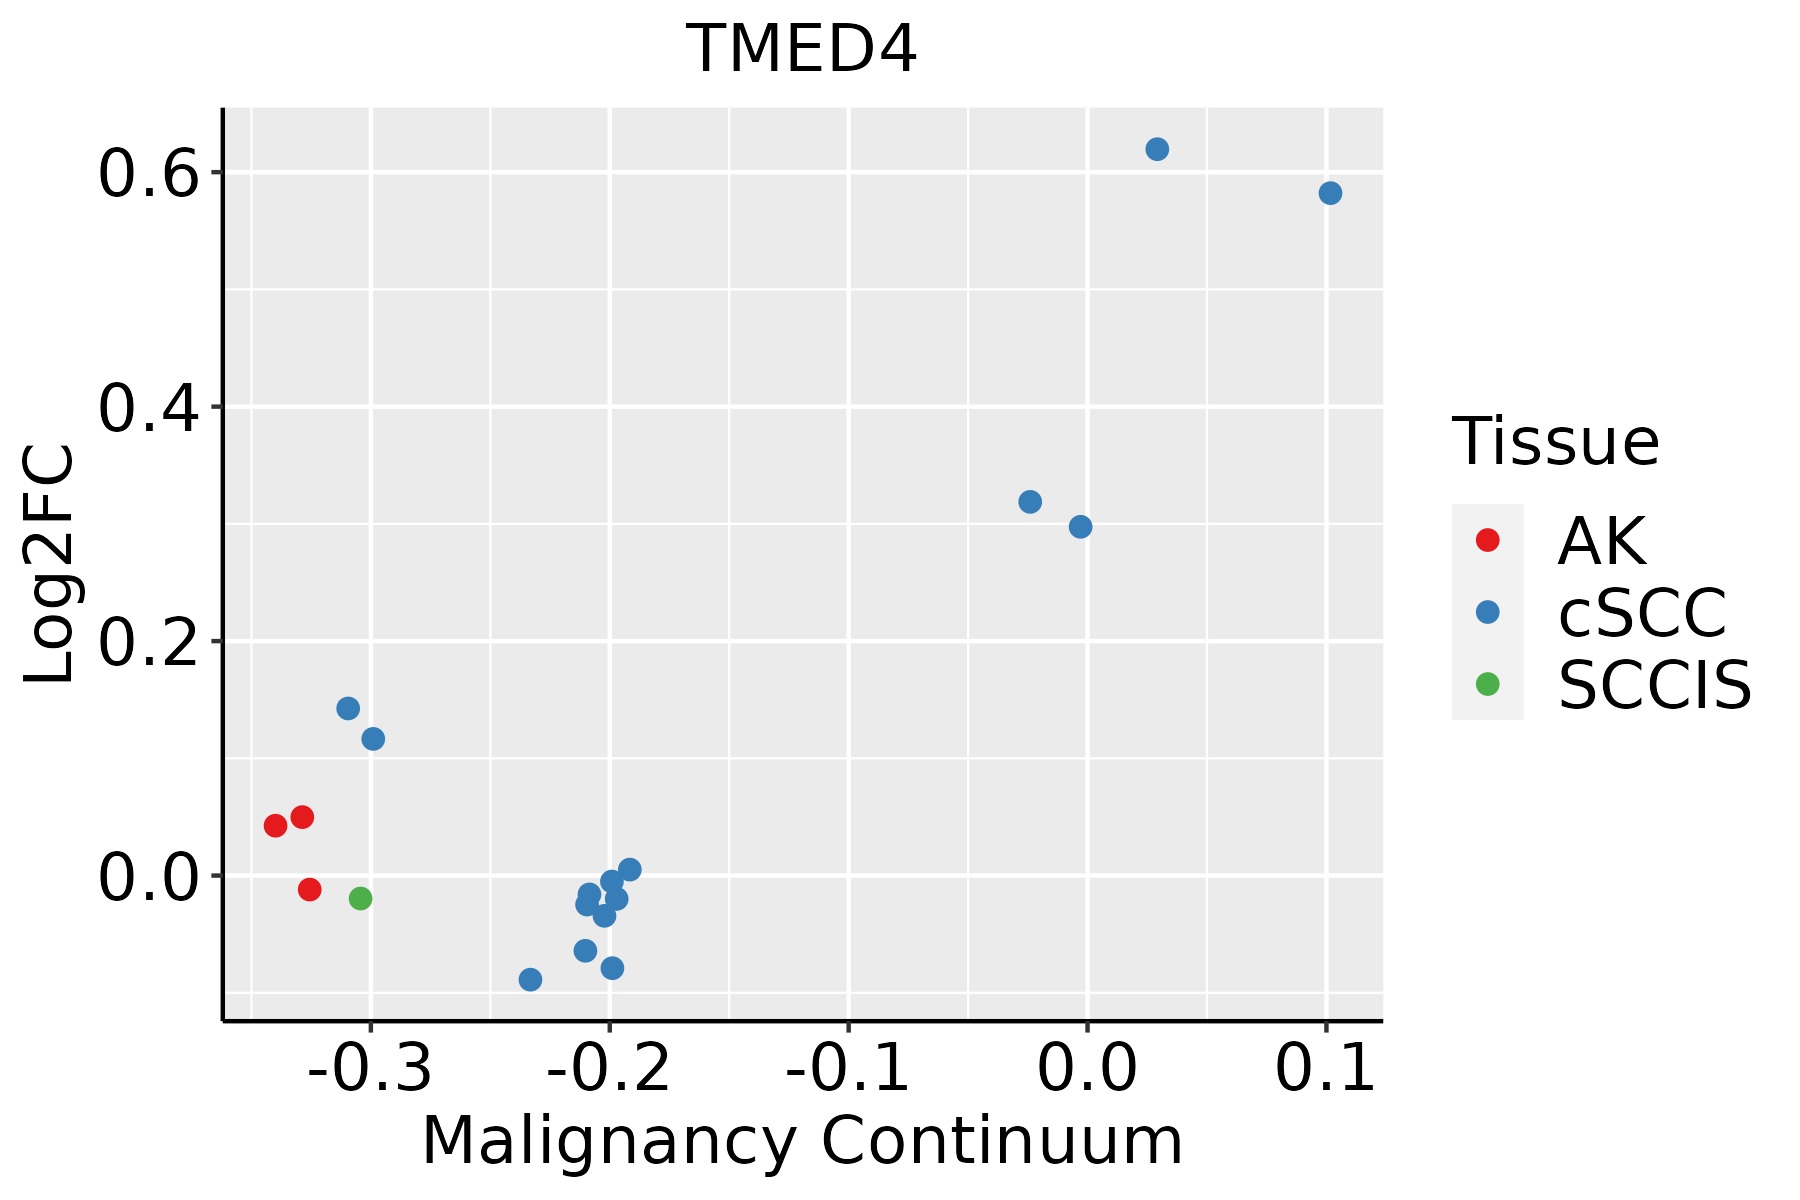 | AK: Actinic keratosis |
| cSCC: Cutaneous squamous cell carcinoma | ||
| SCCIS:squamous cell carcinoma in situ | ||
| Thyroid | 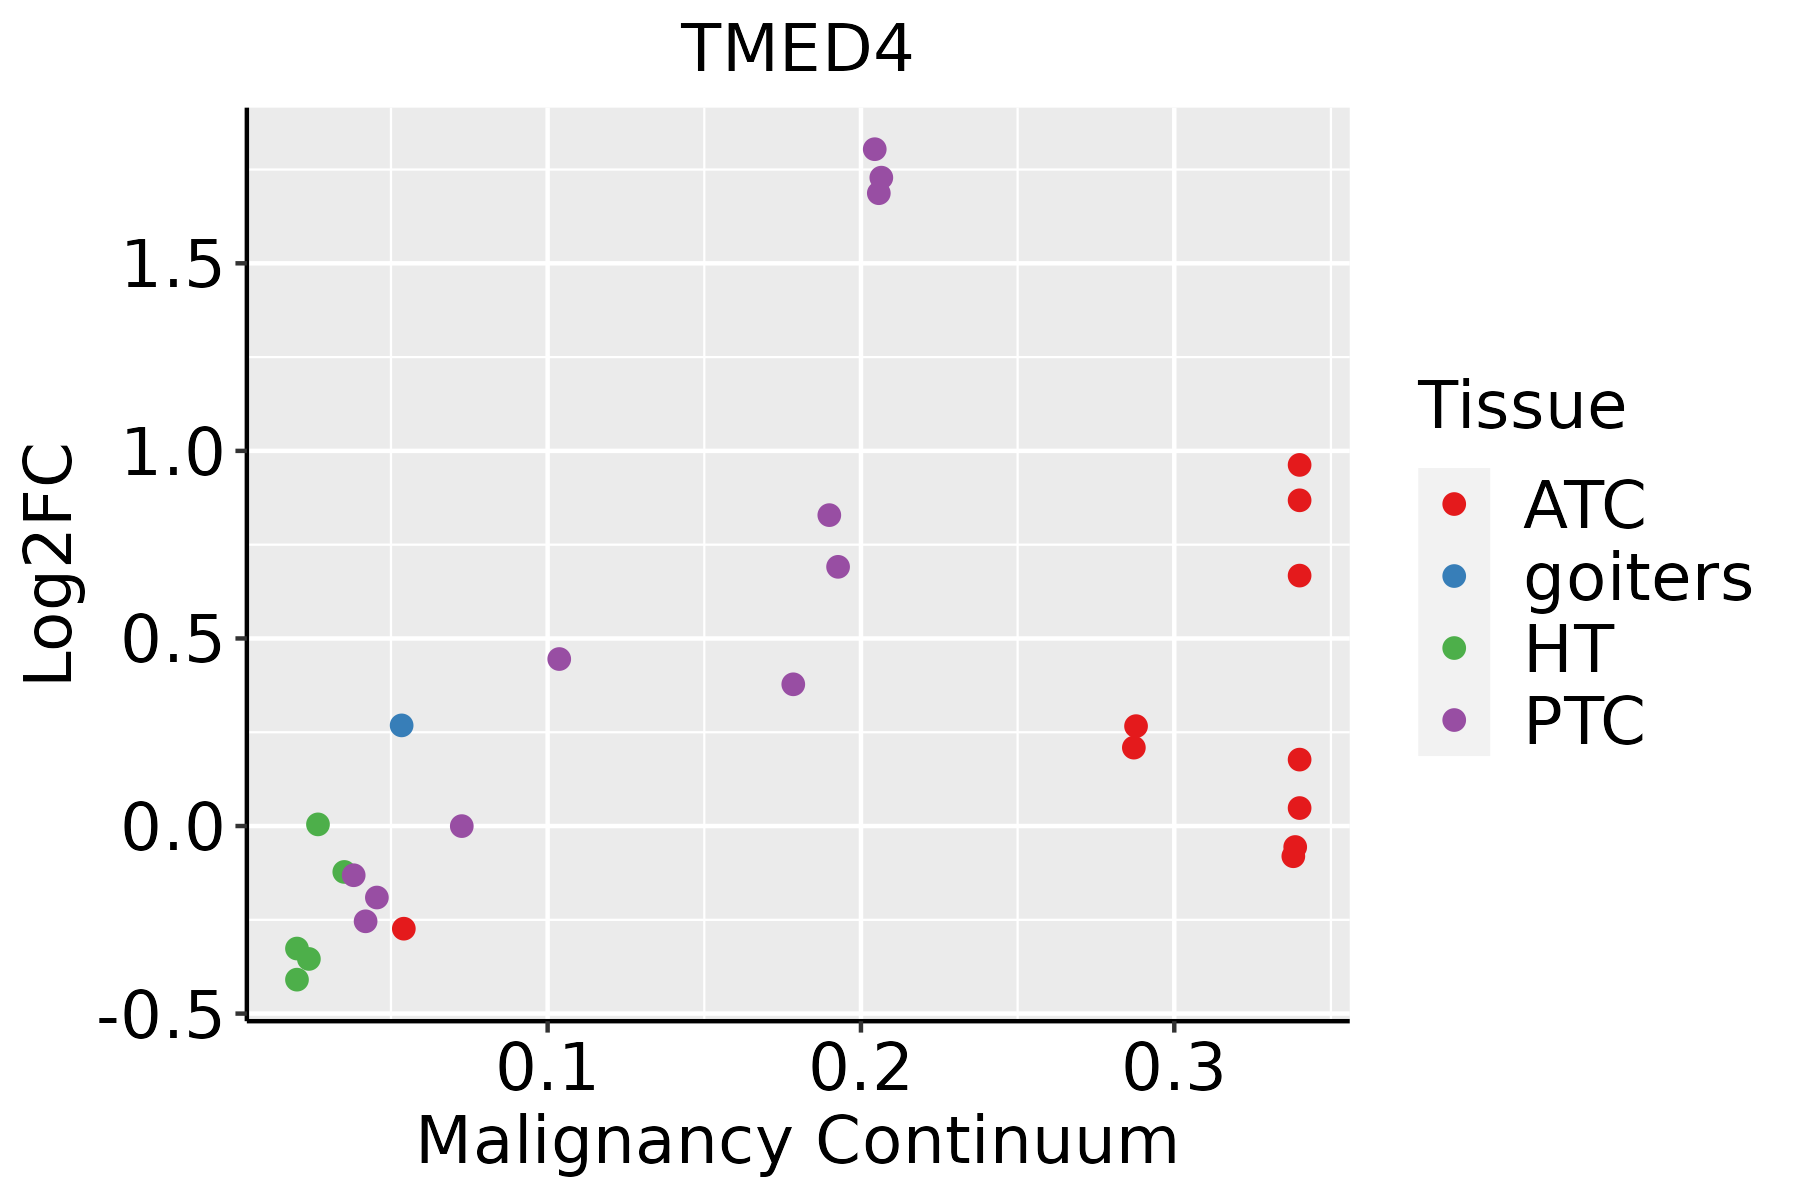 | ATC: Anaplastic thyroid cancer |
| HT: Hashimoto's thyroiditis | ||
| PTC: Papillary thyroid cancer |
| ∗log2FC in expression of this searched gene in stem-like cells from each diseased tissue sample relative to stem-like cells in normal samples in each tissue plotted against the malignancy continuum. Samples are colored based on if they are from different disease stage. |
Top |
Malignant transformation related pathway analysis |
| Find out the enriched GO biological processes and KEGG pathways involved in transition from healthy to precancer to cancer |
| Tissue | Disease Stage | Enriched GO biological Processes |
| Colorectum | AD |  |
| Colorectum | SER |  |
| Colorectum | MSS |  |
| Colorectum | MSI-H |  |
| Colorectum | FAP |  |
| ∗Top 15 enriched GO BP terms are showed in the bar plot of each disease state in each tissue. Each row represents a significant GO biological process which is colored according to the -log10(p.adjust). |
| Page: 1 2 3 4 5 6 7 8 9 |
| GO ID | Tissue | Disease Stage | Description | Gene Ratio | Bg Ratio | pvalue | p.adjust | Count |
| GO:0048193 | Colorectum | AD | Golgi vesicle transport | 109/3918 | 296/18723 | 1.80e-10 | 1.68e-08 | 109 |
| GO:0043123 | Colorectum | AD | positive regulation of I-kappaB kinase/NF-kappaB signaling | 60/3918 | 186/18723 | 1.91e-04 | 2.56e-03 | 60 |
| GO:0043122 | Colorectum | AD | regulation of I-kappaB kinase/NF-kappaB signaling | 76/3918 | 249/18723 | 2.17e-04 | 2.85e-03 | 76 |
| GO:0006888 | Colorectum | AD | endoplasmic reticulum to Golgi vesicle-mediated transport | 44/3918 | 130/18723 | 4.13e-04 | 4.68e-03 | 44 |
| GO:0007249 | Colorectum | AD | I-kappaB kinase/NF-kappaB signaling | 82/3918 | 281/18723 | 6.09e-04 | 6.40e-03 | 82 |
| GO:00481931 | Colorectum | SER | Golgi vesicle transport | 79/2897 | 296/18723 | 4.20e-07 | 2.15e-05 | 79 |
| GO:00068881 | Colorectum | SER | endoplasmic reticulum to Golgi vesicle-mediated transport | 34/2897 | 130/18723 | 1.13e-03 | 1.29e-02 | 34 |
| GO:00481932 | Colorectum | MSS | Golgi vesicle transport | 101/3467 | 296/18723 | 9.09e-11 | 9.77e-09 | 101 |
| GO:00068882 | Colorectum | MSS | endoplasmic reticulum to Golgi vesicle-mediated transport | 44/3467 | 130/18723 | 2.17e-05 | 4.60e-04 | 44 |
| GO:00431221 | Colorectum | MSS | regulation of I-kappaB kinase/NF-kappaB signaling | 71/3467 | 249/18723 | 7.12e-05 | 1.21e-03 | 71 |
| GO:00072491 | Colorectum | MSS | I-kappaB kinase/NF-kappaB signaling | 77/3467 | 281/18723 | 1.51e-04 | 2.19e-03 | 77 |
| GO:00431231 | Colorectum | MSS | positive regulation of I-kappaB kinase/NF-kappaB signaling | 55/3467 | 186/18723 | 1.60e-04 | 2.29e-03 | 55 |
| GO:00068883 | Colorectum | MSI-H | endoplasmic reticulum to Golgi vesicle-mediated transport | 22/1319 | 130/18723 | 1.05e-04 | 3.24e-03 | 22 |
| GO:00481933 | Colorectum | MSI-H | Golgi vesicle transport | 39/1319 | 296/18723 | 1.17e-04 | 3.51e-03 | 39 |
| GO:00481934 | Colorectum | FAP | Golgi vesicle transport | 77/2622 | 296/18723 | 2.86e-08 | 2.62e-06 | 77 |
| GO:00431222 | Colorectum | FAP | regulation of I-kappaB kinase/NF-kappaB signaling | 56/2622 | 249/18723 | 1.82e-04 | 2.69e-03 | 56 |
| GO:00431232 | Colorectum | FAP | positive regulation of I-kappaB kinase/NF-kappaB signaling | 42/2622 | 186/18723 | 1.01e-03 | 9.89e-03 | 42 |
| GO:00072492 | Colorectum | FAP | I-kappaB kinase/NF-kappaB signaling | 58/2622 | 281/18723 | 1.37e-03 | 1.24e-02 | 58 |
| GO:00068884 | Colorectum | FAP | endoplasmic reticulum to Golgi vesicle-mediated transport | 30/2622 | 130/18723 | 3.51e-03 | 2.53e-02 | 30 |
| GO:00481939 | Endometrium | AEH | Golgi vesicle transport | 60/2100 | 296/18723 | 3.65e-06 | 9.79e-05 | 60 |
| Page: 1 2 3 4 5 |
| Pathway ID | Tissue | Disease Stage | Description | Gene Ratio | Bg Ratio | pvalue | p.adjust | qvalue | Count |
| Page: 1 |
Top |
Cell-cell communication analysis |
| Identification of potential cell-cell interactions between two cell types and their ligand-receptor pairs for different disease states |
| Ligand | Receptor | LRpair | Pathway | Tissue | Disease Stage |
| Page: 1 |
Top |
Single-cell gene regulatory network inference analysis |
| Find out the significant the regulons (TFs) and the target genes of each regulon across cell types for different disease states |
| TF | Cell Type | Tissue | Disease Stage | Target Gene | RSS | Regulon Activity |
| ∗The dot plots of a searched regulon are shown for all cell subpopulations in each disease state of each tissue based on the regulon specific score inferred using pySCENIC and by calculating the average expression. |
| Page: 1 |
Top |
Somatic mutation of malignant transformation related genes |
| Annotation of somatic variants for genes involved in malignant transformation |
| Hugo Symbol | Variant Class | Variant Classification | dbSNP RS | HGVSc | HGVSp | HGVSp Short | SWISSPROT | BIOTYPE | SIFT | PolyPhen | Tumor Sample Barcode | Tissue | Histology | Sex | Age | Stage | Therapy Types | Drugs | Outcome |
| TMED4 | SNV | Missense_Mutation | rs778062787 | c.643N>T | p.Arg215Cys | p.R215C | Q7Z7H5 | protein_coding | deleterious(0) | possibly_damaging(0.901) | TCGA-BH-A18G-01 | Breast | breast invasive carcinoma | Female | >=65 | I/II | Unknown | Unknown | SD |
| TMED4 | deletion | Frame_Shift_Del | novel | c.189_196delNNNNNNNN | p.Gln64GlyfsTer43 | p.Q64Gfs*43 | Q7Z7H5 | protein_coding | TCGA-BH-A0HB-01 | Breast | breast invasive carcinoma | Female | <65 | I/II | Chemotherapy | docetaxel | SD | ||
| TMED4 | SNV | Missense_Mutation | rs761985992 | c.443C>T | p.Ala148Val | p.A148V | Q7Z7H5 | protein_coding | deleterious(0.03) | possibly_damaging(0.6) | TCGA-AA-3710-01 | Colorectum | colon adenocarcinoma | Female | >=65 | I/II | Unknown | Unknown | SD |
| TMED4 | SNV | Missense_Mutation | rs752654966 | c.554N>A | p.Arg185Gln | p.R185Q | Q7Z7H5 | protein_coding | deleterious(0.01) | probably_damaging(0.982) | TCGA-AZ-6598-01 | Colorectum | colon adenocarcinoma | Female | >=65 | I/II | Unknown | Unknown | SD |
| TMED4 | SNV | Missense_Mutation | rs545808069 | c.560N>T | p.Thr187Met | p.T187M | Q7Z7H5 | protein_coding | deleterious(0.02) | probably_damaging(0.93) | TCGA-AJ-A3BG-01 | Endometrium | uterine corpus endometrioid carcinoma | Female | >=65 | I/II | Chemotherapy | carboplatin | PD |
| TMED4 | SNV | Missense_Mutation | novel | c.672N>T | p.Lys224Asn | p.K224N | Q7Z7H5 | protein_coding | deleterious(0) | probably_damaging(0.972) | TCGA-AP-A1DV-01 | Endometrium | uterine corpus endometrioid carcinoma | Female | <65 | I/II | Unknown | Unknown | SD |
| TMED4 | SNV | Missense_Mutation | c.304T>C | p.Phe102Leu | p.F102L | Q7Z7H5 | protein_coding | deleterious(0.03) | probably_damaging(0.942) | TCGA-AX-A0J0-01 | Endometrium | uterine corpus endometrioid carcinoma | Female | <65 | I/II | Unknown | Unknown | SD | |
| TMED4 | SNV | Missense_Mutation | novel | c.451N>T | p.Asp151Tyr | p.D151Y | Q7Z7H5 | protein_coding | deleterious(0) | benign(0.413) | TCGA-E6-A1LX-01 | Endometrium | uterine corpus endometrioid carcinoma | Female | <65 | I/II | Unknown | Unknown | SD |
| TMED4 | SNV | Missense_Mutation | c.639N>C | p.Gln213His | p.Q213H | Q7Z7H5 | protein_coding | deleterious(0) | probably_damaging(0.989) | TCGA-69-7978-01 | Lung | lung adenocarcinoma | Male | <65 | I/II | Unknown | Unknown | SD | |
| TMED4 | SNV | Missense_Mutation | novel | c.475N>A | p.Arg159Ser | p.R159S | Q7Z7H5 | protein_coding | deleterious(0.03) | benign(0.233) | TCGA-18-3416-01 | Lung | lung squamous cell carcinoma | Male | >=65 | I/II | Unknown | Unknown | PD |
| Page: 1 2 |
Top |
Related drugs of malignant transformation related genes |
| Identification of chemicals and drugs interact with genes involved in malignant transfromation |
| (DGIdb 4.0) |
| Entrez ID | Symbol | Category | Interaction Types | Drug Claim Name | Drug Name | PMIDs |
| Page: 1 |

Copyright 2023-Present -The University of Texas Health Science Center at Houston |