
|
|||||
|
 | |
| |
| |
| |
| |
| |
|
Gene: TMED3 |
Gene summary for TMED3 |
| Gene information | Species | Human | Gene symbol | TMED3 | Gene ID | 23423 |
| Gene name | transmembrane p24 trafficking protein 3 | |
| Gene Alias | C15orf22 | |
| Cytomap | 15q25.1 | |
| Gene Type | protein-coding | GO ID | GO:0006810 | UniProtAcc | B4E277 |
Top |
Malignant transformation analysis |
| Identification of the aberrant gene expression in precancerous and cancerous lesions by comparing the gene expression of stem-like cells in diseased tissues with normal stem cells |
| Entrez ID | Symbol | Replicates | Species | Organ | Tissue | Adj P-value | Log2FC | Malignancy |
| 23423 | TMED3 | HTA11_3410_2000001011 | Human | Colorectum | AD | 7.80e-08 | 3.49e-01 | 0.0155 |
| 23423 | TMED3 | HTA11_2487_2000001011 | Human | Colorectum | SER | 3.52e-05 | 5.89e-01 | -0.1808 |
| 23423 | TMED3 | HTA11_2951_2000001011 | Human | Colorectum | AD | 6.89e-03 | 3.06e-01 | 0.0216 |
| 23423 | TMED3 | HTA11_1938_2000001011 | Human | Colorectum | AD | 2.82e-20 | 9.19e-01 | -0.0811 |
| 23423 | TMED3 | HTA11_78_2000001011 | Human | Colorectum | AD | 1.25e-04 | 4.34e-01 | -0.1088 |
| 23423 | TMED3 | HTA11_347_2000001011 | Human | Colorectum | AD | 8.77e-16 | 6.68e-01 | -0.1954 |
| 23423 | TMED3 | HTA11_411_2000001011 | Human | Colorectum | SER | 4.42e-07 | 1.14e+00 | -0.2602 |
| 23423 | TMED3 | HTA11_2112_2000001011 | Human | Colorectum | SER | 6.97e-08 | 1.25e+00 | -0.2196 |
| 23423 | TMED3 | HTA11_3361_2000001011 | Human | Colorectum | AD | 5.99e-03 | 5.00e-01 | -0.1207 |
| 23423 | TMED3 | HTA11_83_2000001011 | Human | Colorectum | SER | 3.99e-03 | 4.42e-01 | -0.1526 |
| 23423 | TMED3 | HTA11_696_2000001011 | Human | Colorectum | AD | 3.71e-35 | 1.18e+00 | -0.1464 |
| 23423 | TMED3 | HTA11_866_2000001011 | Human | Colorectum | AD | 1.06e-13 | 5.47e-01 | -0.1001 |
| 23423 | TMED3 | HTA11_1391_2000001011 | Human | Colorectum | AD | 2.12e-25 | 1.05e+00 | -0.059 |
| 23423 | TMED3 | HTA11_2992_2000001011 | Human | Colorectum | SER | 1.74e-04 | 8.36e-01 | -0.1706 |
| 23423 | TMED3 | HTA11_546_2000001011 | Human | Colorectum | AD | 2.25e-08 | 6.26e-01 | -0.0842 |
| 23423 | TMED3 | HTA11_7862_2000001011 | Human | Colorectum | AD | 3.58e-07 | 5.88e-01 | -0.0179 |
| 23423 | TMED3 | HTA11_866_3004761011 | Human | Colorectum | AD | 8.29e-21 | 7.37e-01 | 0.096 |
| 23423 | TMED3 | HTA11_4255_2000001011 | Human | Colorectum | SER | 6.08e-05 | 8.30e-01 | 0.0446 |
| 23423 | TMED3 | HTA11_7663_2000001011 | Human | Colorectum | SER | 2.61e-02 | 6.51e-01 | 0.0131 |
| 23423 | TMED3 | HTA11_6801_2000001011 | Human | Colorectum | SER | 1.77e-02 | 2.71e-01 | 0.0171 |
| Page: 1 2 3 4 5 6 7 8 9 |
| Tissue | Expression Dynamics | Abbreviation |
| Colorectum (GSE201348) |  | FAP: Familial adenomatous polyposis |
| CRC: Colorectal cancer | ||
| Colorectum (HTA11) |  | AD: Adenomas |
| SER: Sessile serrated lesions | ||
| MSI-H: Microsatellite-high colorectal cancer | ||
| MSS: Microsatellite stable colorectal cancer | ||
| Endometrium |  | AEH: Atypical endometrial hyperplasia |
| EEC: Endometrioid Cancer | ||
| Esophagus | 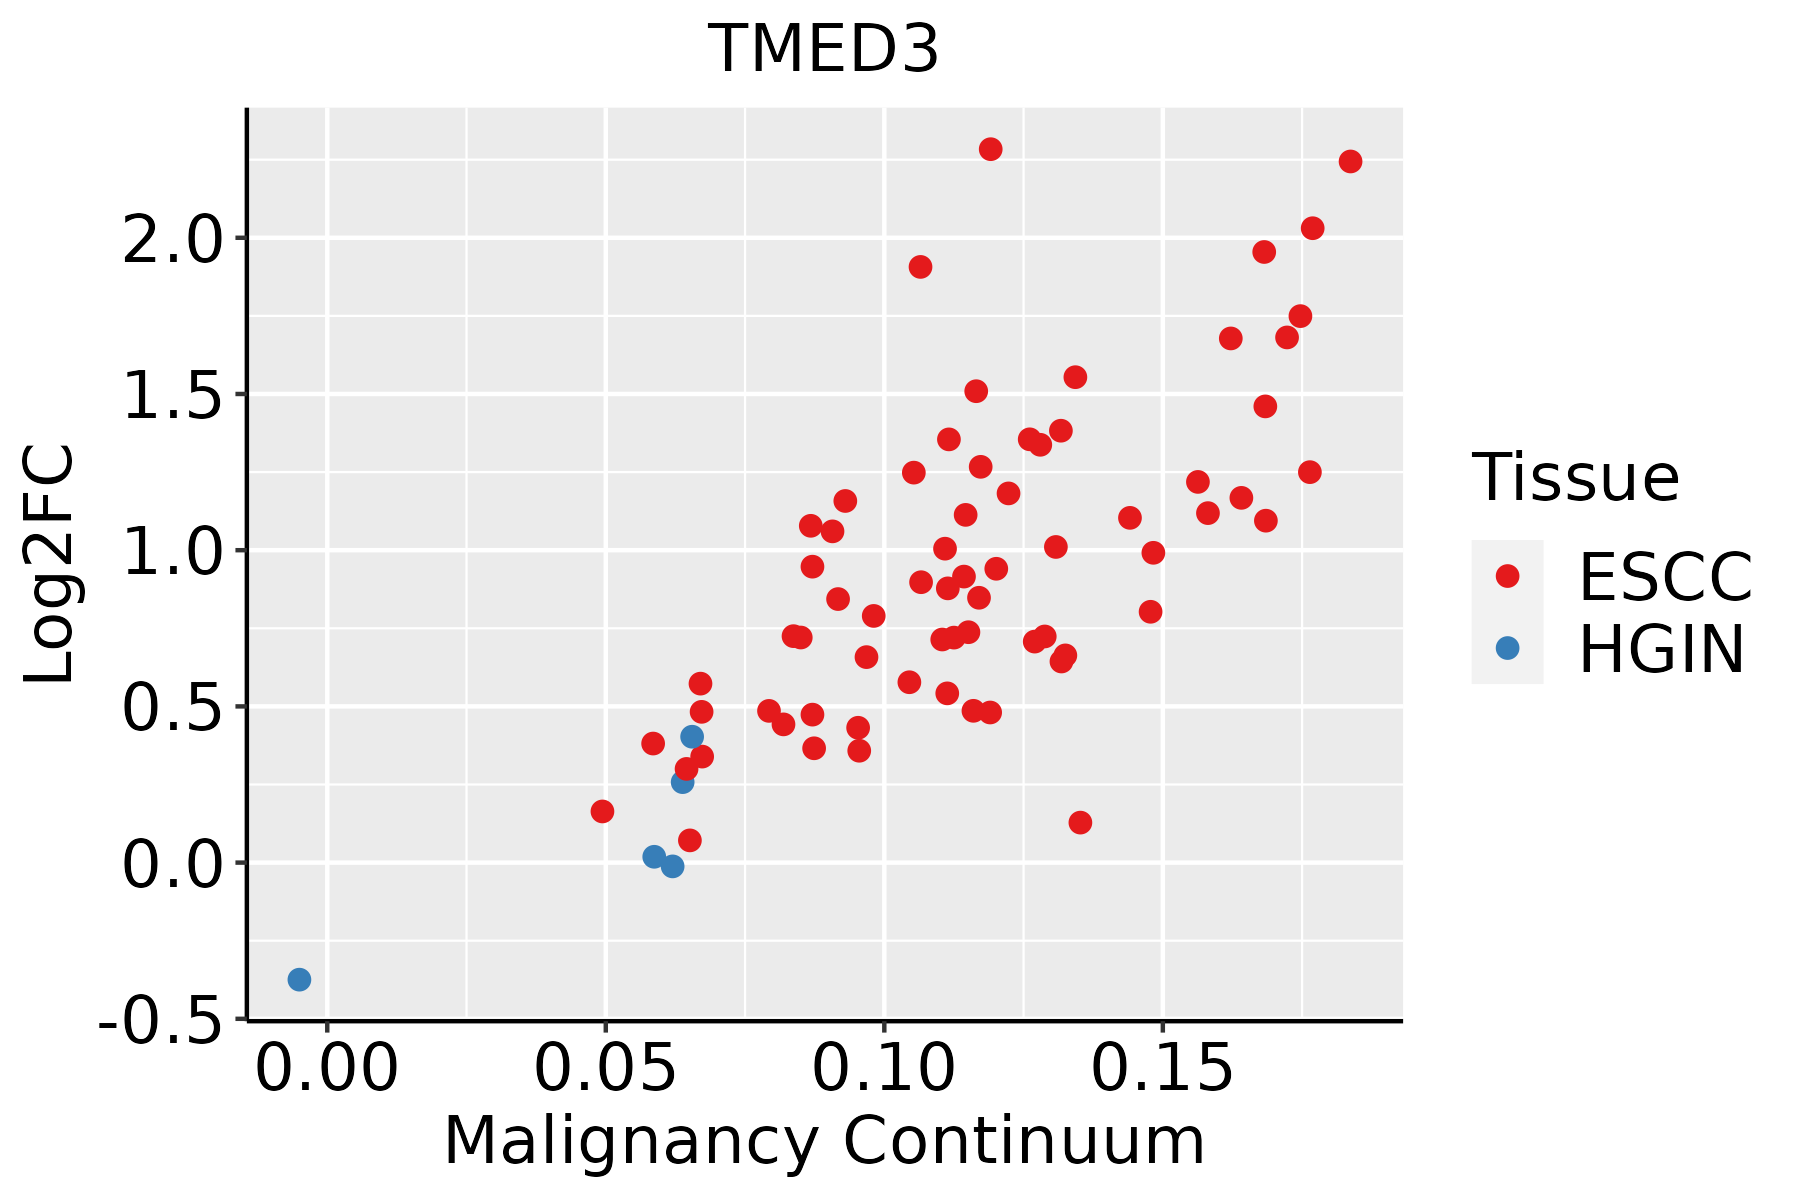 | ESCC: Esophageal squamous cell carcinoma |
| HGIN: High-grade intraepithelial neoplasias | ||
| LGIN: Low-grade intraepithelial neoplasias | ||
| Liver |  | HCC: Hepatocellular carcinoma |
| NAFLD: Non-alcoholic fatty liver disease | ||
| Oral Cavity | 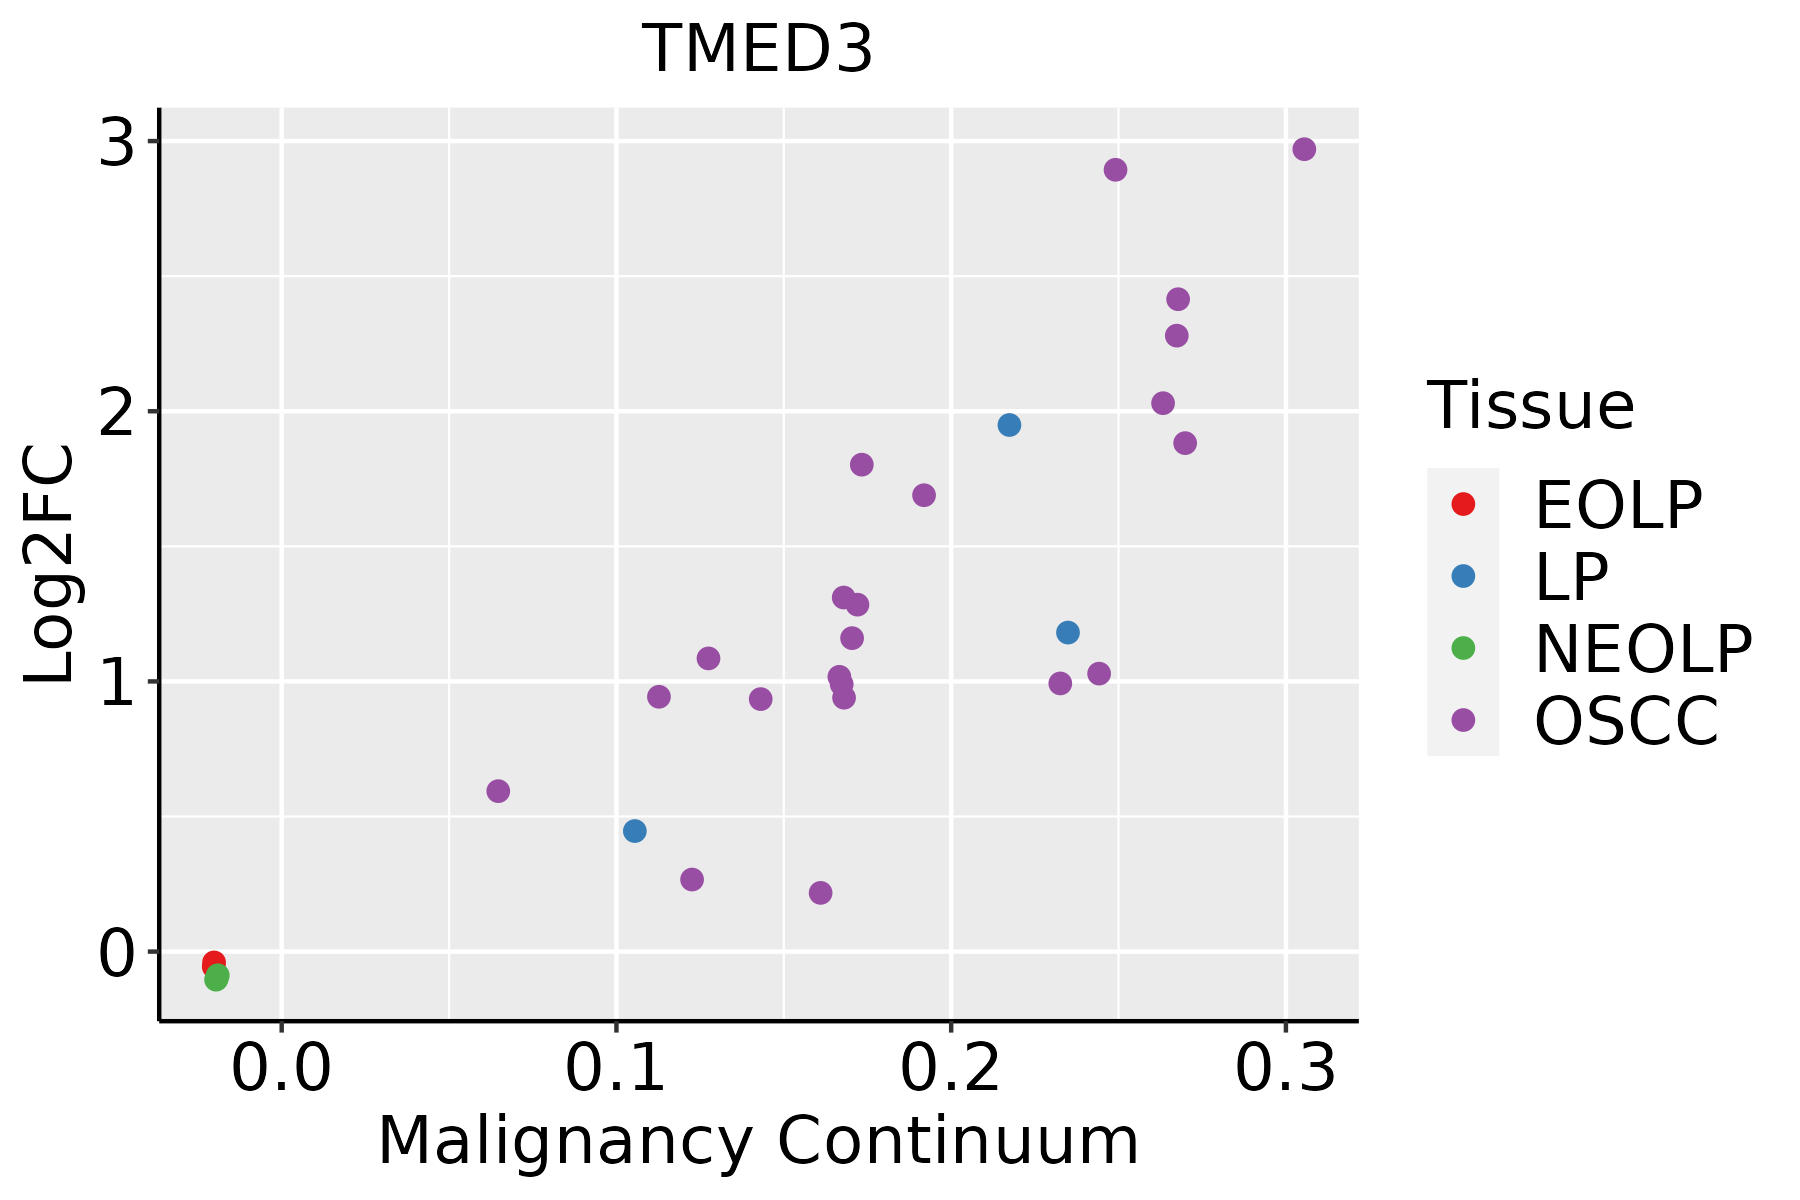 | EOLP: Erosive Oral lichen planus |
| LP: leukoplakia | ||
| NEOLP: Non-erosive oral lichen planus | ||
| OSCC: Oral squamous cell carcinoma | ||
| Prostate | 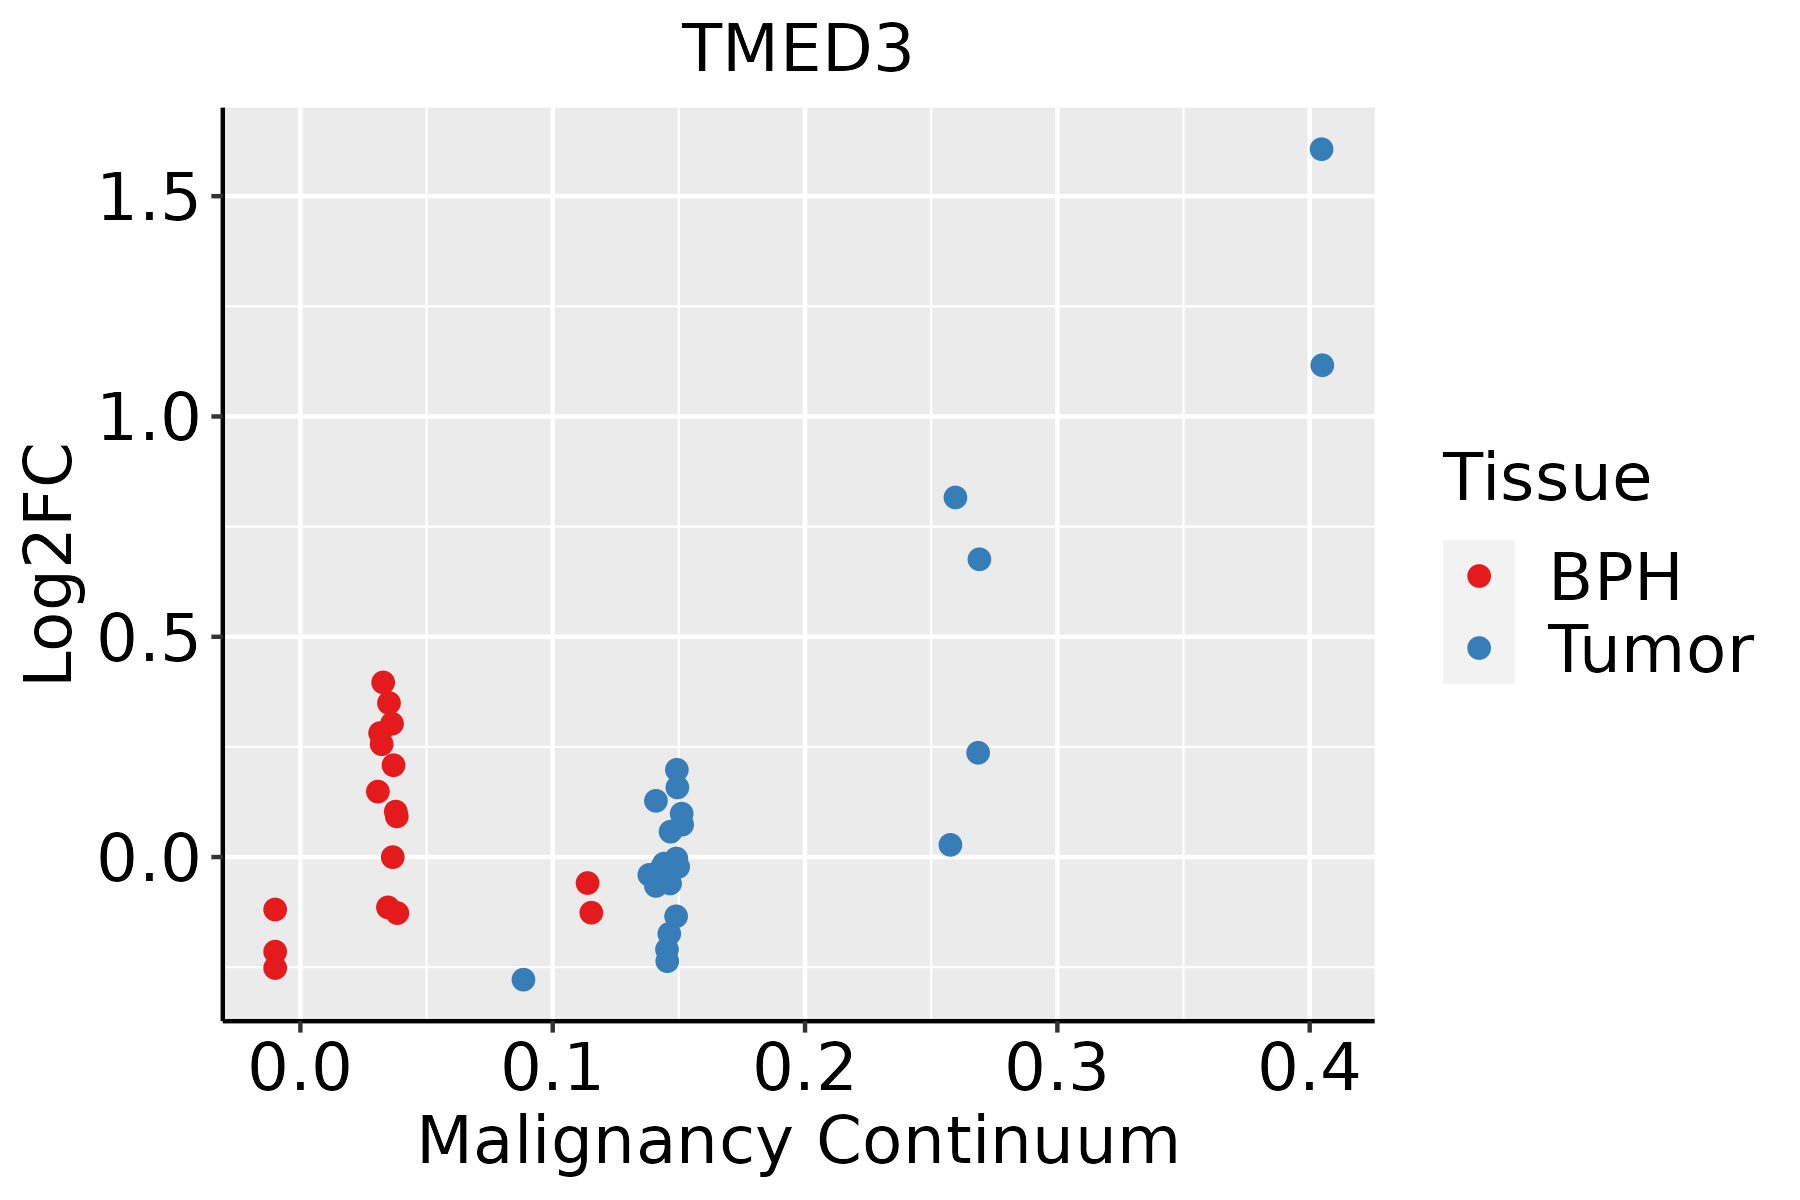 | BPH: Benign Prostatic Hyperplasia |
| Skin | 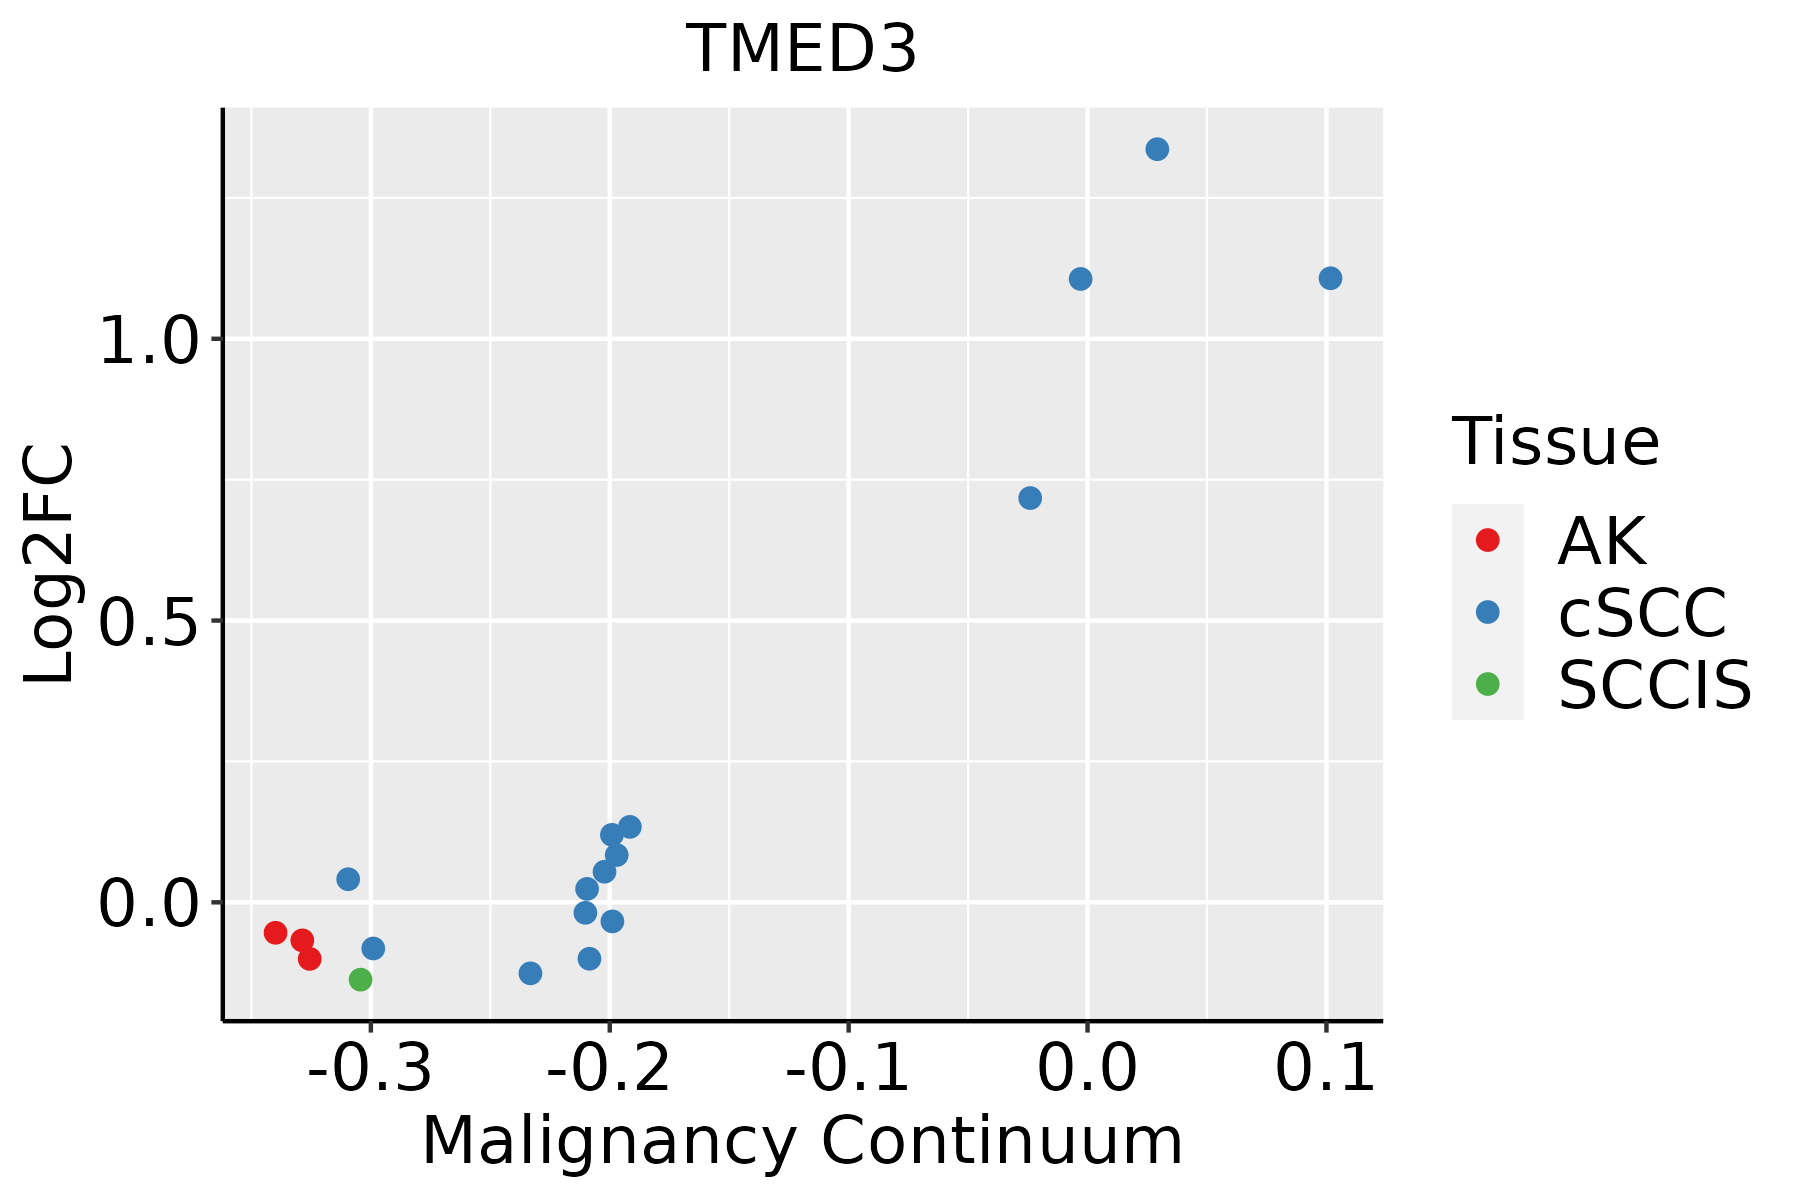 | AK: Actinic keratosis |
| cSCC: Cutaneous squamous cell carcinoma | ||
| SCCIS:squamous cell carcinoma in situ | ||
| Thyroid | 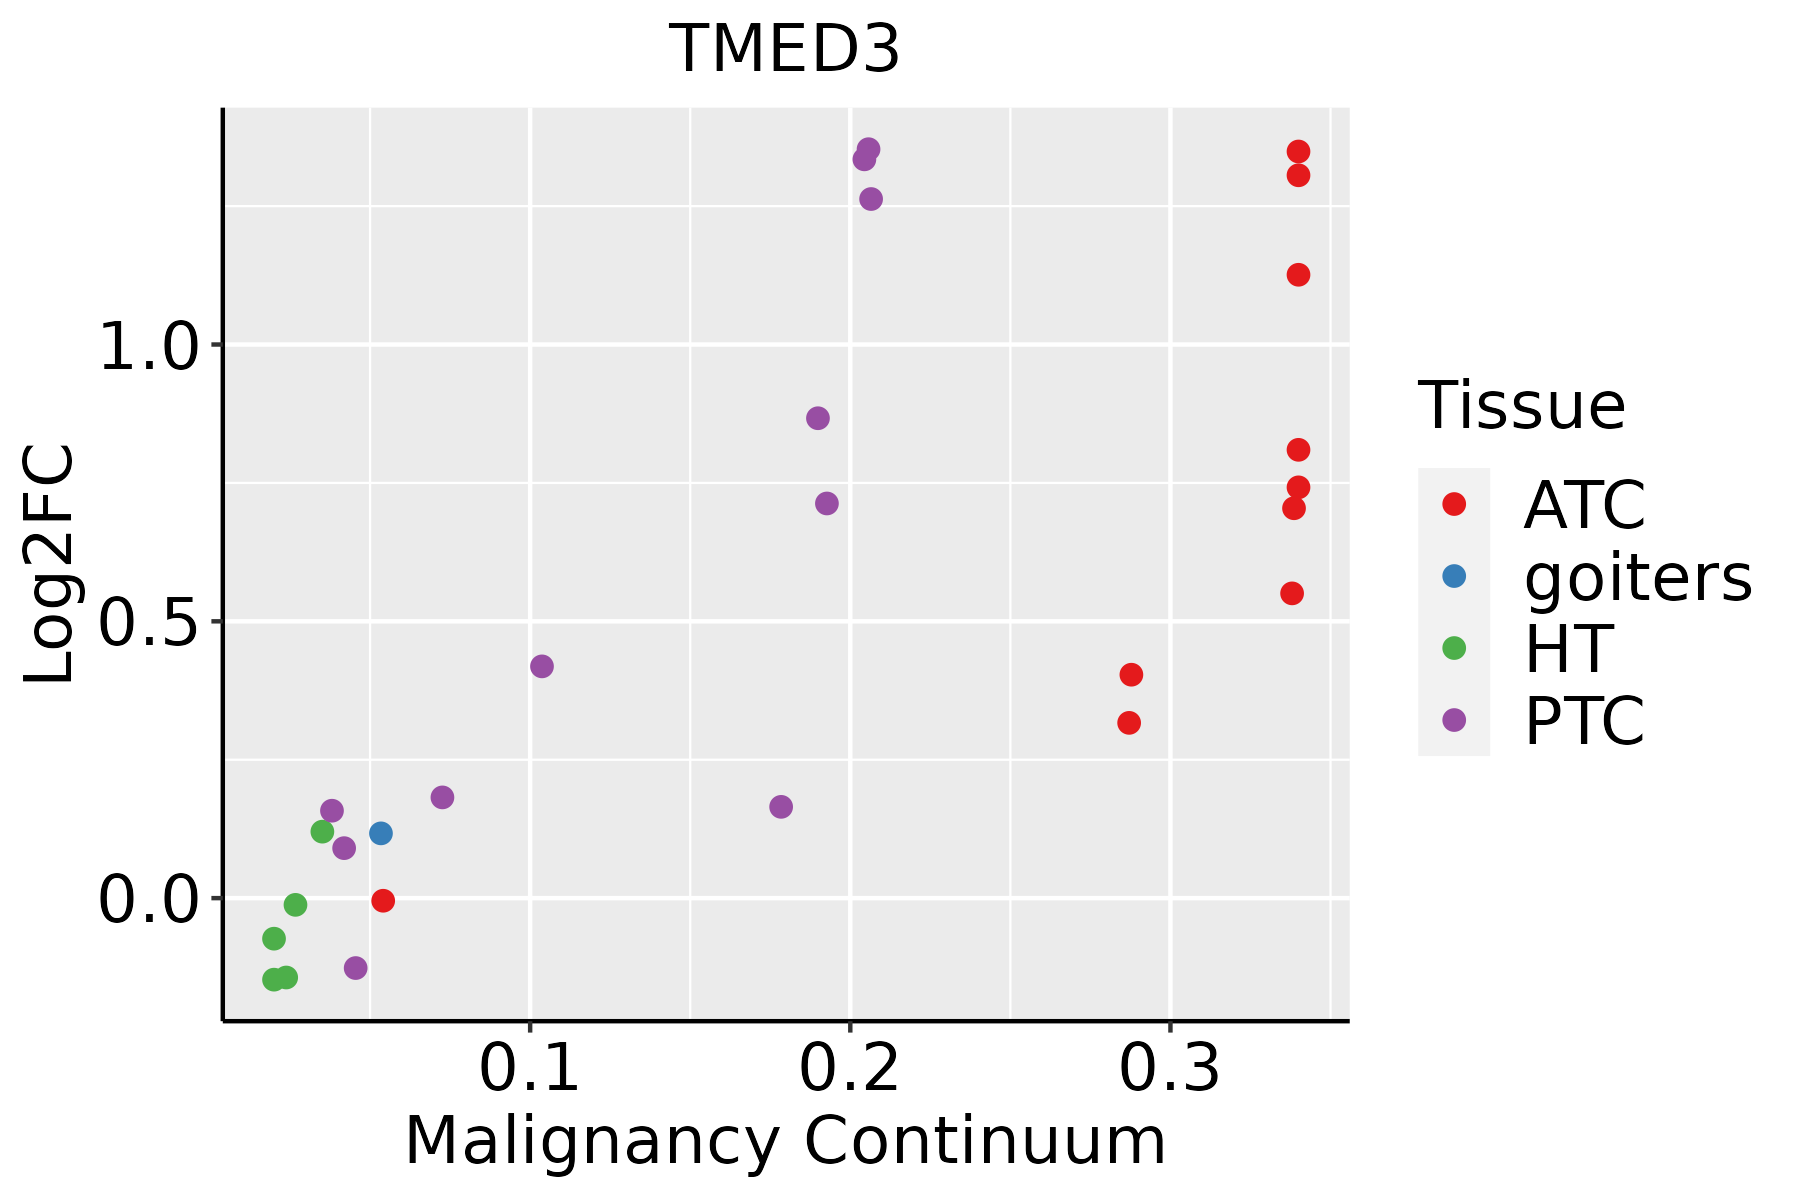 | ATC: Anaplastic thyroid cancer |
| HT: Hashimoto's thyroiditis | ||
| PTC: Papillary thyroid cancer |
| ∗log2FC in expression of this searched gene in stem-like cells from each diseased tissue sample relative to stem-like cells in normal samples in each tissue plotted against the malignancy continuum. Samples are colored based on if they are from different disease stage. |
Top |
Malignant transformation related pathway analysis |
| Find out the enriched GO biological processes and KEGG pathways involved in transition from healthy to precancer to cancer |
| Tissue | Disease Stage | Enriched GO biological Processes |
| Colorectum | AD |  |
| Colorectum | SER |  |
| Colorectum | MSS |  |
| Colorectum | MSI-H |  |
| Colorectum | FAP |  |
| ∗Top 15 enriched GO BP terms are showed in the bar plot of each disease state in each tissue. Each row represents a significant GO biological process which is colored according to the -log10(p.adjust). |
| Page: 1 2 3 4 5 6 7 8 9 |
| GO ID | Tissue | Disease Stage | Description | Gene Ratio | Bg Ratio | pvalue | p.adjust | Count |
| GO:0048193 | Colorectum | AD | Golgi vesicle transport | 109/3918 | 296/18723 | 1.80e-10 | 1.68e-08 | 109 |
| GO:0006888 | Colorectum | AD | endoplasmic reticulum to Golgi vesicle-mediated transport | 44/3918 | 130/18723 | 4.13e-04 | 4.68e-03 | 44 |
| GO:00481931 | Colorectum | SER | Golgi vesicle transport | 79/2897 | 296/18723 | 4.20e-07 | 2.15e-05 | 79 |
| GO:00068881 | Colorectum | SER | endoplasmic reticulum to Golgi vesicle-mediated transport | 34/2897 | 130/18723 | 1.13e-03 | 1.29e-02 | 34 |
| GO:00481932 | Colorectum | MSS | Golgi vesicle transport | 101/3467 | 296/18723 | 9.09e-11 | 9.77e-09 | 101 |
| GO:00068882 | Colorectum | MSS | endoplasmic reticulum to Golgi vesicle-mediated transport | 44/3467 | 130/18723 | 2.17e-05 | 4.60e-04 | 44 |
| GO:00068883 | Colorectum | MSI-H | endoplasmic reticulum to Golgi vesicle-mediated transport | 22/1319 | 130/18723 | 1.05e-04 | 3.24e-03 | 22 |
| GO:00481933 | Colorectum | MSI-H | Golgi vesicle transport | 39/1319 | 296/18723 | 1.17e-04 | 3.51e-03 | 39 |
| GO:00481934 | Colorectum | FAP | Golgi vesicle transport | 77/2622 | 296/18723 | 2.86e-08 | 2.62e-06 | 77 |
| GO:00068884 | Colorectum | FAP | endoplasmic reticulum to Golgi vesicle-mediated transport | 30/2622 | 130/18723 | 3.51e-03 | 2.53e-02 | 30 |
| GO:00481939 | Endometrium | AEH | Golgi vesicle transport | 60/2100 | 296/18723 | 3.65e-06 | 9.79e-05 | 60 |
| GO:00068886 | Endometrium | AEH | endoplasmic reticulum to Golgi vesicle-mediated transport | 29/2100 | 130/18723 | 2.11e-04 | 2.59e-03 | 29 |
| GO:00070305 | Endometrium | AEH | Golgi organization | 32/2100 | 157/18723 | 5.73e-04 | 5.69e-03 | 32 |
| GO:004819313 | Endometrium | EEC | Golgi vesicle transport | 60/2168 | 296/18723 | 9.91e-06 | 2.17e-04 | 60 |
| GO:000688812 | Endometrium | EEC | endoplasmic reticulum to Golgi vesicle-mediated transport | 29/2168 | 130/18723 | 3.63e-04 | 3.95e-03 | 29 |
| GO:000703012 | Endometrium | EEC | Golgi organization | 32/2168 | 157/18723 | 9.87e-04 | 8.76e-03 | 32 |
| GO:004819318 | Esophagus | ESCC | Golgi vesicle transport | 231/8552 | 296/18723 | 1.82e-30 | 9.63e-28 | 231 |
| GO:000688815 | Esophagus | ESCC | endoplasmic reticulum to Golgi vesicle-mediated transport | 102/8552 | 130/18723 | 1.73e-14 | 9.22e-13 | 102 |
| GO:00070308 | Esophagus | ESCC | Golgi organization | 101/8552 | 157/18723 | 1.78e-06 | 2.10e-05 | 101 |
| GO:004819311 | Liver | Cirrhotic | Golgi vesicle transport | 153/4634 | 296/18723 | 1.02e-23 | 6.43e-21 | 153 |
| Page: 1 2 3 |
| Pathway ID | Tissue | Disease Stage | Description | Gene Ratio | Bg Ratio | pvalue | p.adjust | qvalue | Count |
| Page: 1 |
Top |
Cell-cell communication analysis |
| Identification of potential cell-cell interactions between two cell types and their ligand-receptor pairs for different disease states |
| Ligand | Receptor | LRpair | Pathway | Tissue | Disease Stage |
| Page: 1 |
Top |
Single-cell gene regulatory network inference analysis |
| Find out the significant the regulons (TFs) and the target genes of each regulon across cell types for different disease states |
| TF | Cell Type | Tissue | Disease Stage | Target Gene | RSS | Regulon Activity |
| ∗The dot plots of a searched regulon are shown for all cell subpopulations in each disease state of each tissue based on the regulon specific score inferred using pySCENIC and by calculating the average expression. |
| Page: 1 |
Top |
Somatic mutation of malignant transformation related genes |
| Annotation of somatic variants for genes involved in malignant transformation |
| Hugo Symbol | Variant Class | Variant Classification | dbSNP RS | HGVSc | HGVSp | HGVSp Short | SWISSPROT | BIOTYPE | SIFT | PolyPhen | Tumor Sample Barcode | Tissue | Histology | Sex | Age | Stage | Therapy Types | Drugs | Outcome |
| TMED3 | SNV | Missense_Mutation | rs756104785 | c.458C>T | p.Thr153Met | p.T153M | Q9Y3Q3 | protein_coding | tolerated(0.06) | benign(0.108) | TCGA-S3-A6ZG-01 | Breast | breast invasive carcinoma | Female | >=65 | I/II | Chemotherapy | doxorubicin | CR |
| TMED3 | SNV | Missense_Mutation | novel | c.253N>C | p.Tyr85His | p.Y85H | Q9Y3Q3 | protein_coding | deleterious(0) | possibly_damaging(0.69) | TCGA-AA-3811-01 | Colorectum | colon adenocarcinoma | Female | >=65 | III/IV | Unknown | Unknown | PD |
| TMED3 | SNV | Missense_Mutation | novel | c.114N>T | p.Lys38Asn | p.K38N | Q9Y3Q3 | protein_coding | tolerated(0.16) | benign(0.1) | TCGA-A5-A1OF-01 | Endometrium | uterine corpus endometrioid carcinoma | Female | <65 | I/II | Unknown | Unknown | SD |
| TMED3 | SNV | Missense_Mutation | rs753279680 | c.266C>T | p.Thr89Met | p.T89M | Q9Y3Q3 | protein_coding | deleterious(0.01) | probably_damaging(0.932) | TCGA-A5-A2K5-01 | Endometrium | uterine corpus endometrioid carcinoma | Female | >=65 | I/II | Unknown | Unknown | SD |
| TMED3 | SNV | Missense_Mutation | novel | c.478N>T | p.His160Tyr | p.H160Y | Q9Y3Q3 | protein_coding | deleterious(0) | benign(0.141) | TCGA-AX-A2HD-01 | Endometrium | uterine corpus endometrioid carcinoma | Female | >=65 | III/IV | Unknown | Unknown | SD |
| TMED3 | SNV | Missense_Mutation | novel | c.391N>A | p.Gly131Arg | p.G131R | Q9Y3Q3 | protein_coding | deleterious(0.04) | benign(0.111) | TCGA-AX-A3FT-01 | Endometrium | uterine corpus endometrioid carcinoma | Female | <65 | I/II | Unknown | Unknown | SD |
| TMED3 | SNV | Missense_Mutation | c.530G>A | p.Ser177Asn | p.S177N | Q9Y3Q3 | protein_coding | tolerated(0.17) | benign(0.038) | TCGA-B5-A0JT-01 | Endometrium | uterine corpus endometrioid carcinoma | Female | <65 | III/IV | Hormone Therapy | megace | SD | |
| TMED3 | SNV | Missense_Mutation | rs779967326 | c.461N>C | p.Val154Ala | p.V154A | Q9Y3Q3 | protein_coding | deleterious(0.03) | benign(0.304) | TCGA-D1-A175-01 | Endometrium | uterine corpus endometrioid carcinoma | Female | <65 | I/II | Chemotherapy | paclitaxel | SD |
| TMED3 | SNV | Missense_Mutation | c.274N>T | p.Ala92Ser | p.A92S | Q9Y3Q3 | protein_coding | deleterious(0.03) | benign(0.202) | TCGA-05-4395-01 | Lung | lung adenocarcinoma | Male | >=65 | III/IV | Unknown | Unknown | SD | |
| TMED3 | SNV | Missense_Mutation | rs145001674 | c.626G>T | p.Arg209Leu | p.R209L | Q9Y3Q3 | protein_coding | deleterious(0) | possibly_damaging(0.904) | TCGA-43-7658-01 | Lung | lung squamous cell carcinoma | Female | >=65 | I/II | Unknown | Unknown | PD |
| Page: 1 2 |
Top |
Related drugs of malignant transformation related genes |
| Identification of chemicals and drugs interact with genes involved in malignant transfromation |
| (DGIdb 4.0) |
| Entrez ID | Symbol | Category | Interaction Types | Drug Claim Name | Drug Name | PMIDs |
| Page: 1 |

Copyright 2023-Present -The University of Texas Health Science Center at Houston |