
|
|||||
|
 | |
| |
| |
| |
| |
| |
|
Gene: TMED2 |
Gene summary for TMED2 |
| Gene information | Species | Human | Gene symbol | TMED2 | Gene ID | 10959 |
| Gene name | transmembrane p24 trafficking protein 2 | |
| Gene Alias | P24A | |
| Cytomap | 12q24.31 | |
| Gene Type | protein-coding | GO ID | GO:0000003 | UniProtAcc | Q15363 |
Top |
Malignant transformation analysis |
| Identification of the aberrant gene expression in precancerous and cancerous lesions by comparing the gene expression of stem-like cells in diseased tissues with normal stem cells |
| Entrez ID | Symbol | Replicates | Species | Organ | Tissue | Adj P-value | Log2FC | Malignancy |
| 10959 | TMED2 | GSM4909281 | Human | Breast | IDC | 2.66e-43 | 6.86e-01 | 0.21 |
| 10959 | TMED2 | GSM4909286 | Human | Breast | IDC | 7.85e-03 | -7.73e-03 | 0.1081 |
| 10959 | TMED2 | GSM4909288 | Human | Breast | IDC | 3.87e-02 | -2.37e-01 | 0.0988 |
| 10959 | TMED2 | GSM4909290 | Human | Breast | IDC | 1.92e-05 | 3.24e-01 | 0.2096 |
| 10959 | TMED2 | GSM4909294 | Human | Breast | IDC | 1.30e-07 | -3.25e-01 | 0.2022 |
| 10959 | TMED2 | GSM4909296 | Human | Breast | IDC | 6.23e-13 | -1.29e-01 | 0.1524 |
| 10959 | TMED2 | GSM4909297 | Human | Breast | IDC | 4.31e-30 | 1.98e-01 | 0.1517 |
| 10959 | TMED2 | GSM4909301 | Human | Breast | IDC | 9.18e-05 | -1.96e-01 | 0.1577 |
| 10959 | TMED2 | GSM4909304 | Human | Breast | IDC | 1.09e-12 | 4.44e-01 | 0.1636 |
| 10959 | TMED2 | GSM4909305 | Human | Breast | IDC | 1.02e-06 | 3.15e-01 | 0.0436 |
| 10959 | TMED2 | GSM4909306 | Human | Breast | IDC | 1.29e-04 | 3.35e-01 | 0.1564 |
| 10959 | TMED2 | GSM4909308 | Human | Breast | IDC | 6.05e-25 | 5.27e-01 | 0.158 |
| 10959 | TMED2 | GSM4909309 | Human | Breast | IDC | 7.42e-06 | -2.58e-01 | 0.0483 |
| 10959 | TMED2 | GSM4909311 | Human | Breast | IDC | 4.24e-46 | -3.10e-02 | 0.1534 |
| 10959 | TMED2 | GSM4909312 | Human | Breast | IDC | 4.86e-62 | 7.91e-01 | 0.1552 |
| 10959 | TMED2 | GSM4909313 | Human | Breast | IDC | 4.26e-20 | 4.02e-01 | 0.0391 |
| 10959 | TMED2 | GSM4909319 | Human | Breast | IDC | 5.03e-62 | -4.82e-01 | 0.1563 |
| 10959 | TMED2 | GSM4909320 | Human | Breast | IDC | 1.39e-13 | -6.68e-01 | 0.1575 |
| 10959 | TMED2 | GSM4909321 | Human | Breast | IDC | 1.05e-24 | 1.72e-01 | 0.1559 |
| 10959 | TMED2 | brca3 | Human | Breast | Precancer | 4.99e-02 | 2.68e-01 | -0.0263 |
| Page: 1 2 3 4 5 6 7 8 9 10 11 12 |
| Tissue | Expression Dynamics | Abbreviation |
| Breast | 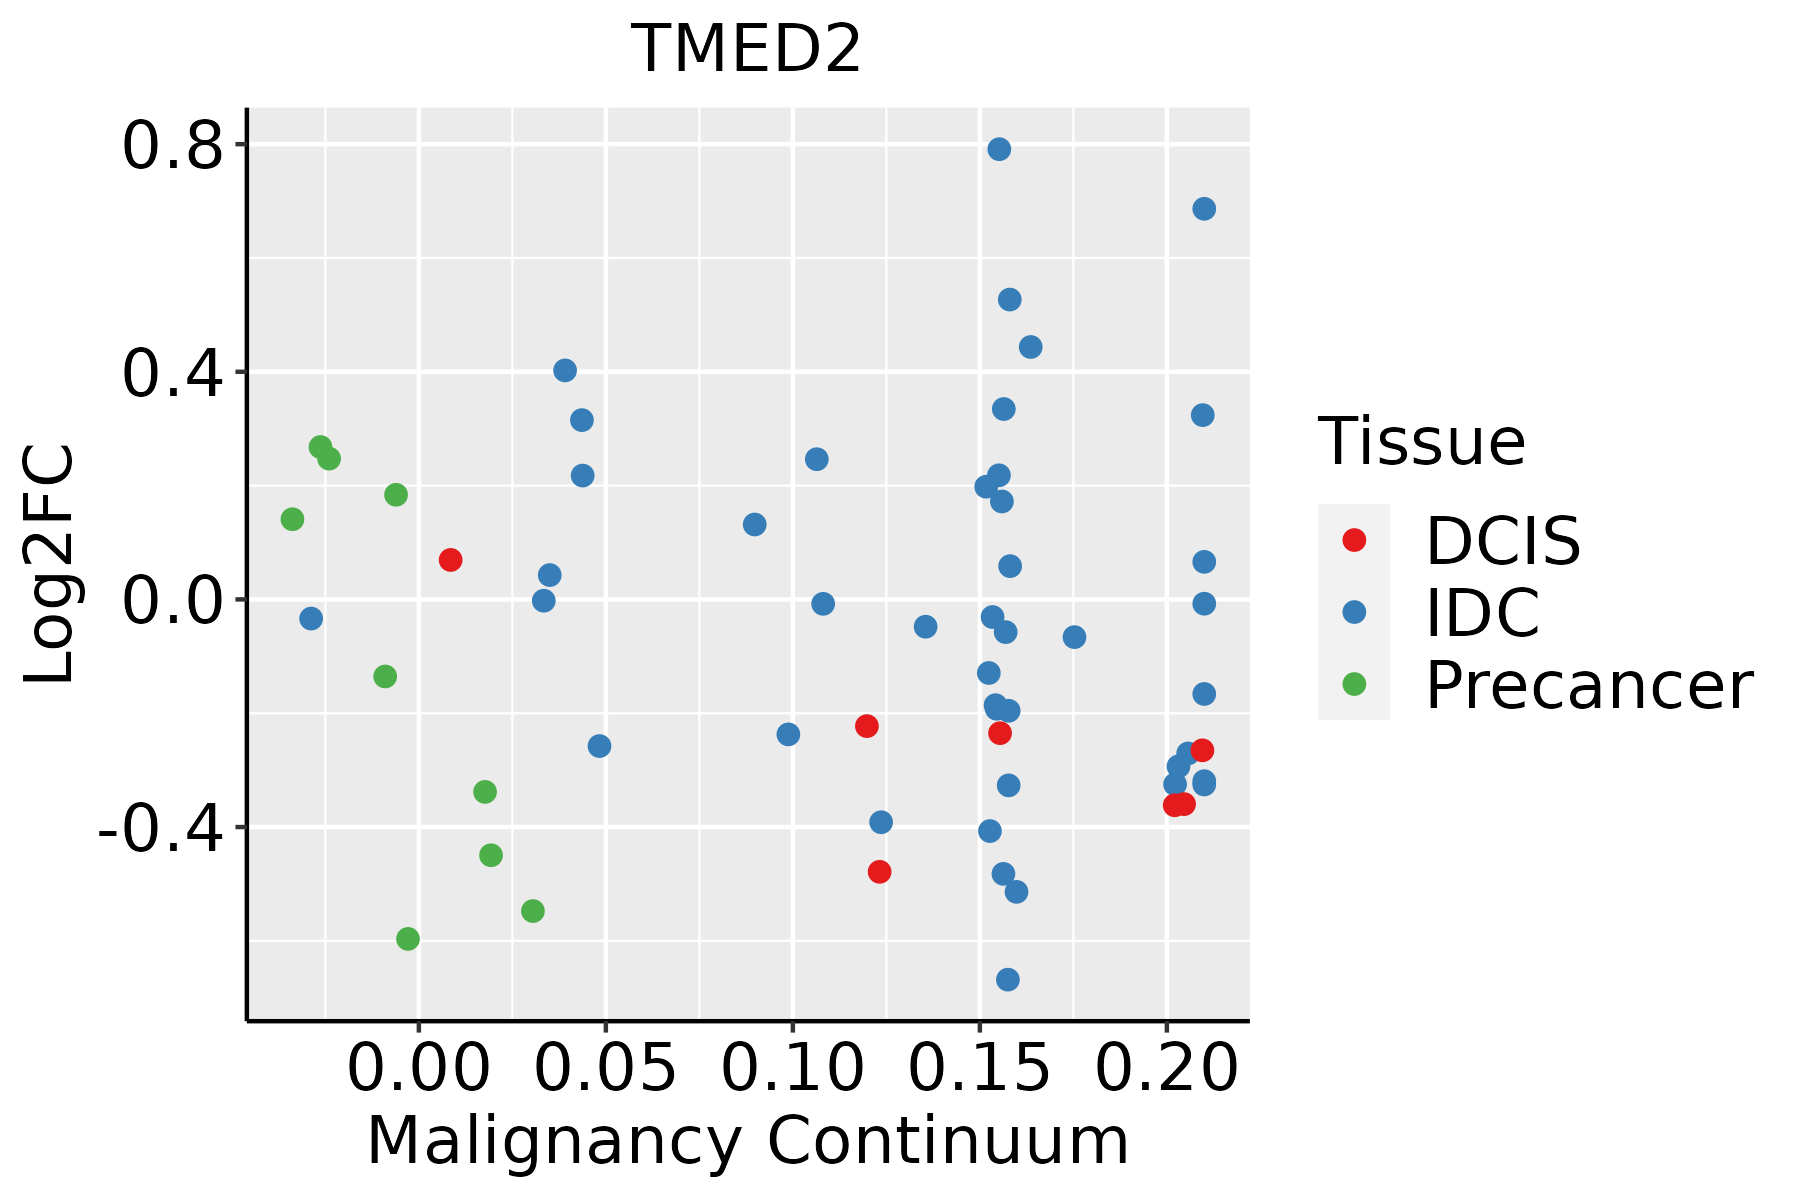 | IDC: Invasive ductal carcinoma |
| DCIS: Ductal carcinoma in situ | ||
| Precancer(BRCA1-mut): Precancerous lesion from BRCA1 mutation carriers | ||
| Colorectum (GSE201348) |  | FAP: Familial adenomatous polyposis |
| CRC: Colorectal cancer | ||
| Colorectum (HTA11) |  | AD: Adenomas |
| SER: Sessile serrated lesions | ||
| MSI-H: Microsatellite-high colorectal cancer | ||
| MSS: Microsatellite stable colorectal cancer | ||
| Endometrium |  | AEH: Atypical endometrial hyperplasia |
| EEC: Endometrioid Cancer | ||
| Esophagus | 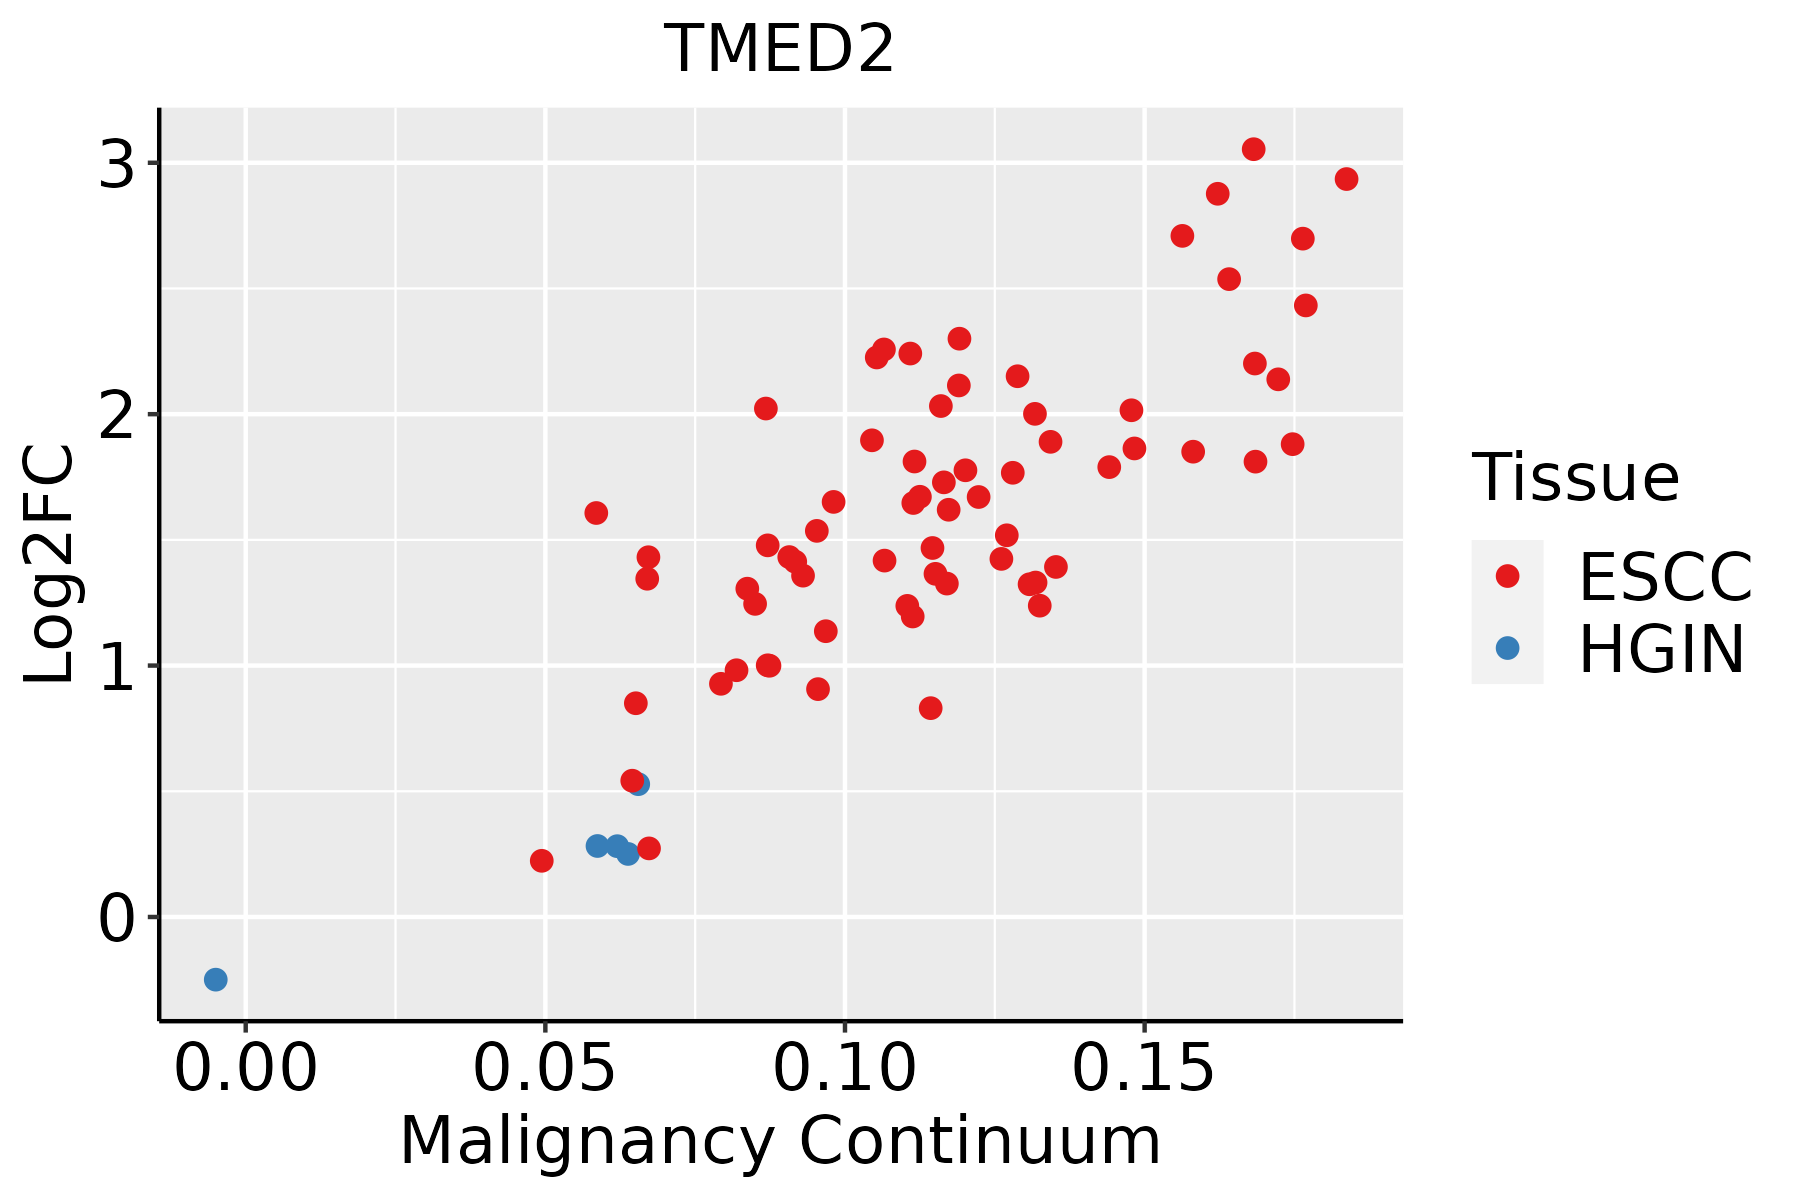 | ESCC: Esophageal squamous cell carcinoma |
| HGIN: High-grade intraepithelial neoplasias | ||
| LGIN: Low-grade intraepithelial neoplasias | ||
| Liver | 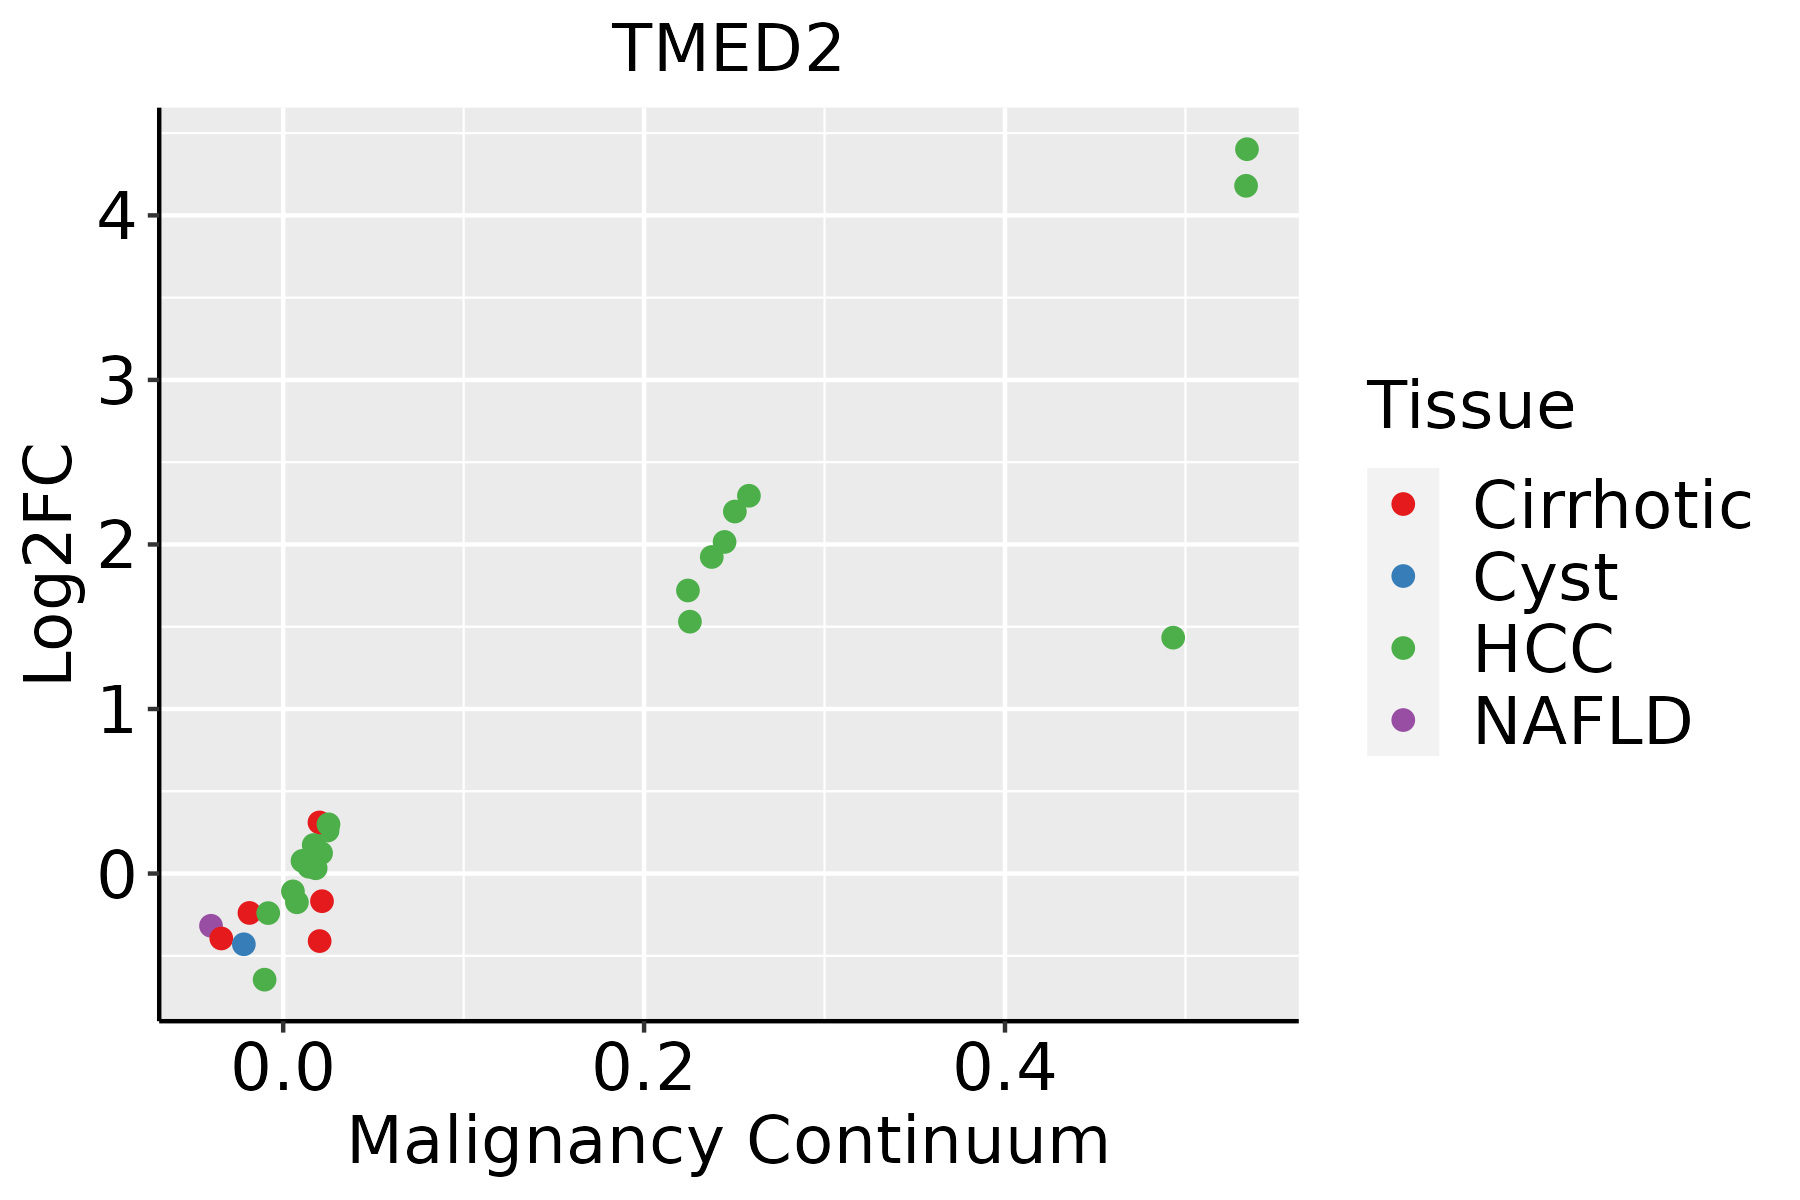 | HCC: Hepatocellular carcinoma |
| NAFLD: Non-alcoholic fatty liver disease | ||
| Oral Cavity | 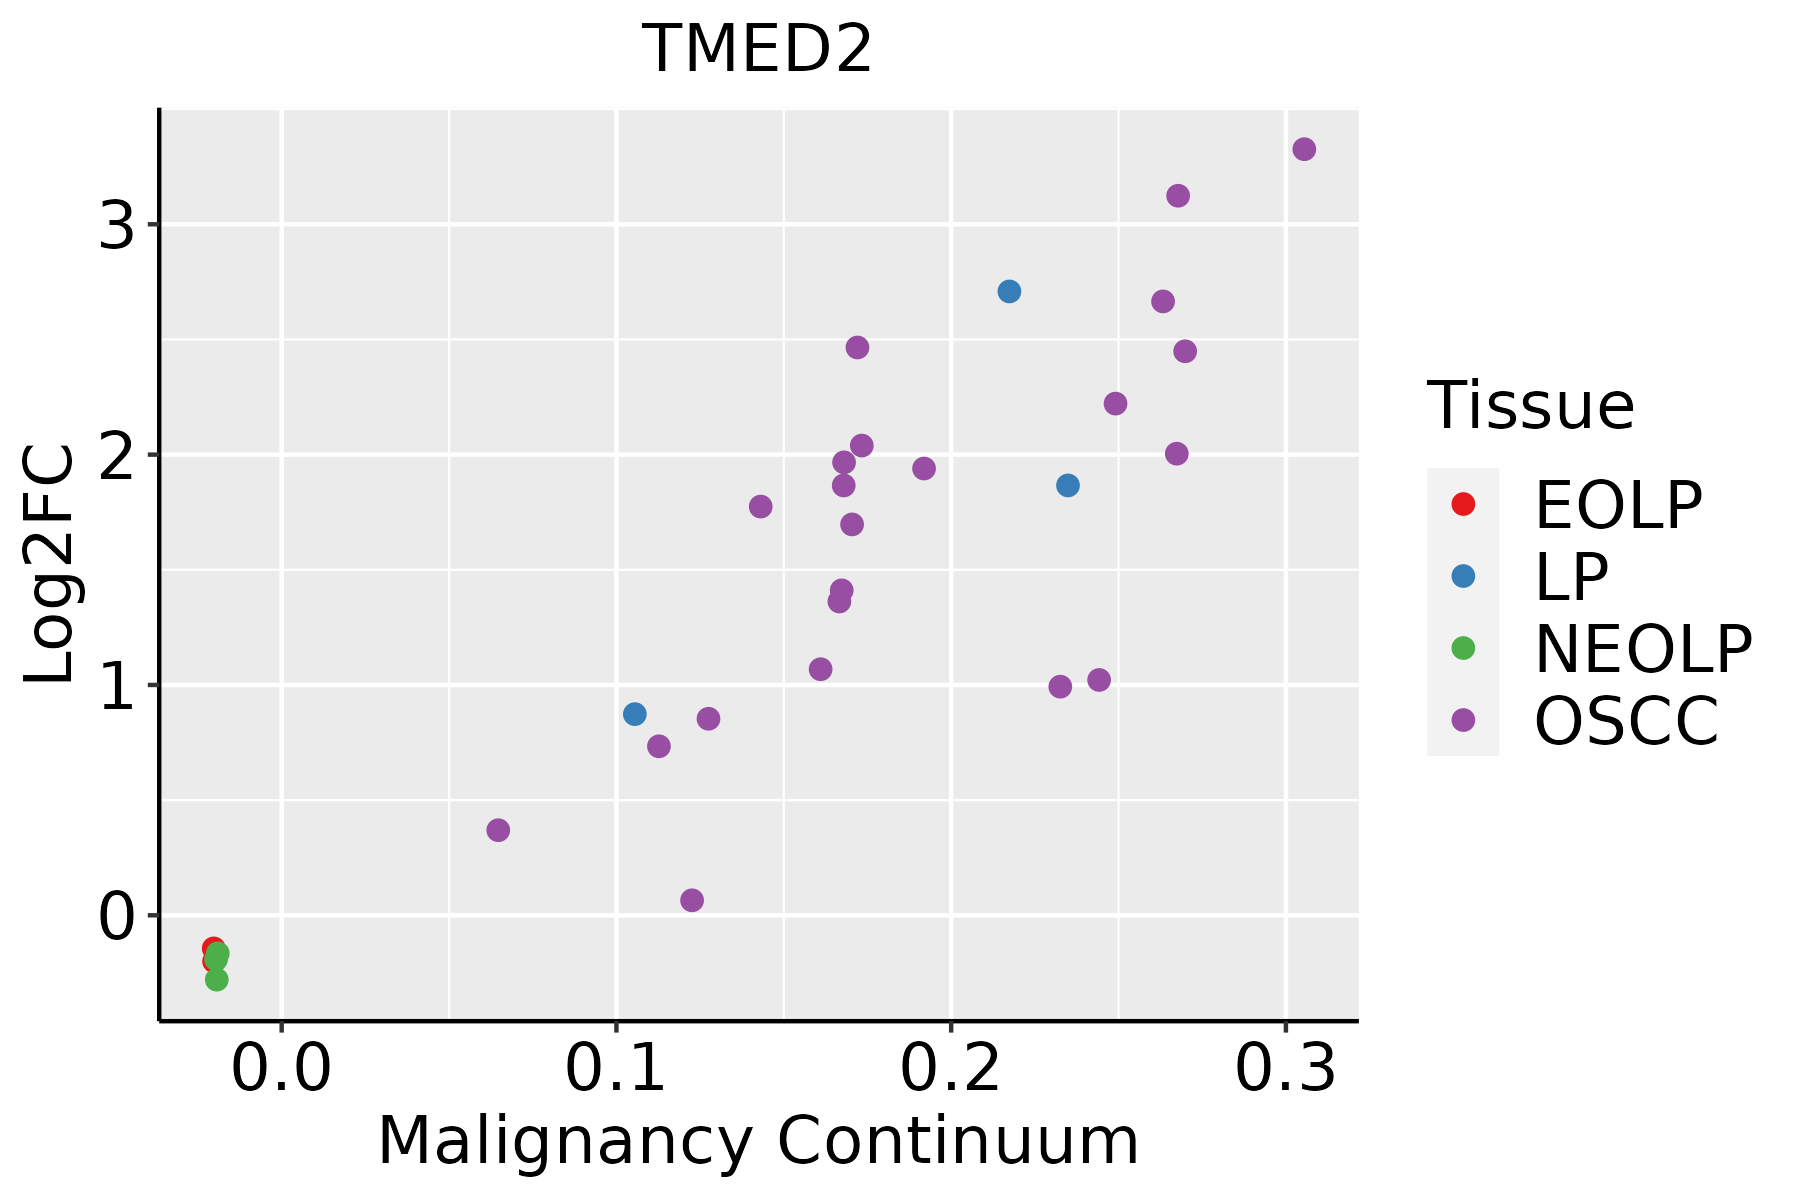 | EOLP: Erosive Oral lichen planus |
| LP: leukoplakia | ||
| NEOLP: Non-erosive oral lichen planus | ||
| OSCC: Oral squamous cell carcinoma | ||
| Prostate | 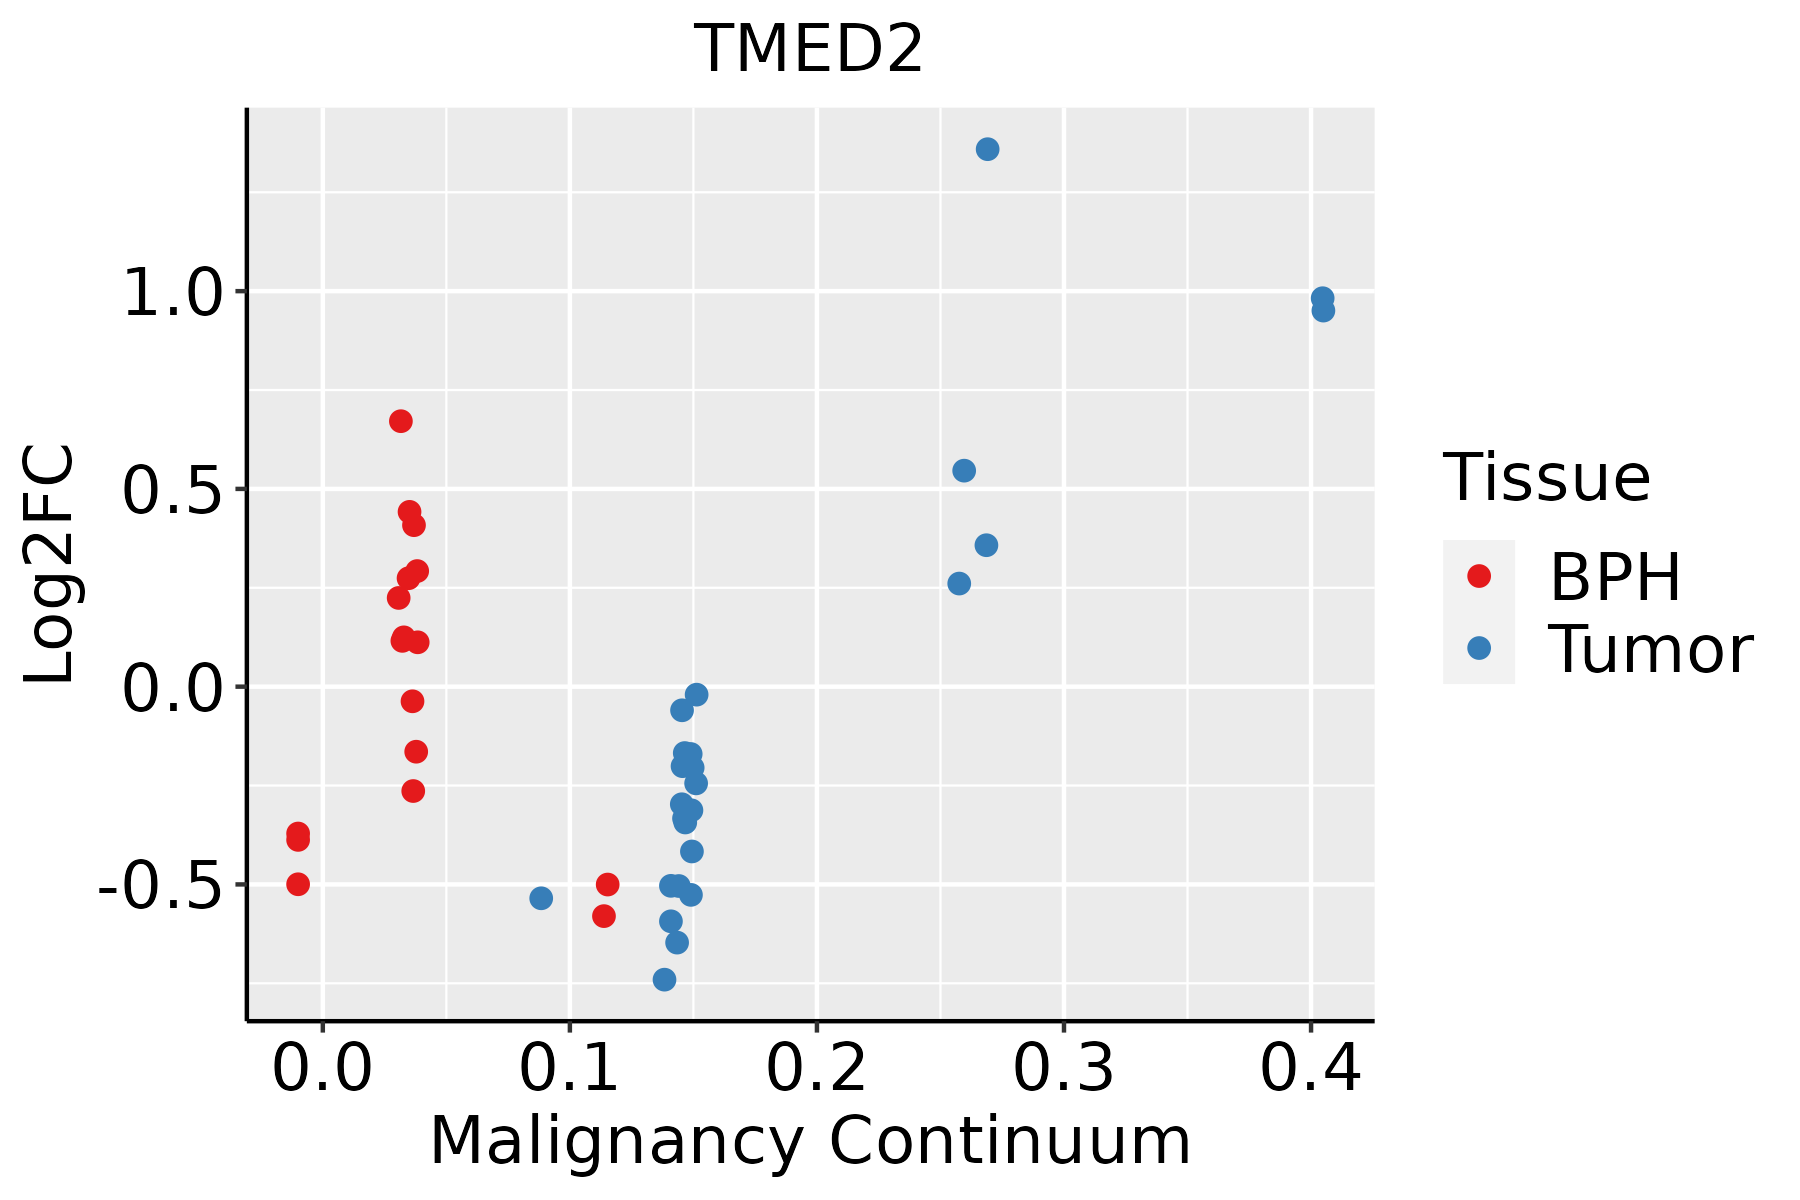 | BPH: Benign Prostatic Hyperplasia |
| Skin |  | AK: Actinic keratosis |
| cSCC: Cutaneous squamous cell carcinoma | ||
| SCCIS:squamous cell carcinoma in situ | ||
| Thyroid |  | ATC: Anaplastic thyroid cancer |
| HT: Hashimoto's thyroiditis | ||
| PTC: Papillary thyroid cancer |
| ∗log2FC in expression of this searched gene in stem-like cells from each diseased tissue sample relative to stem-like cells in normal samples in each tissue plotted against the malignancy continuum. Samples are colored based on if they are from different disease stage. |
Top |
Malignant transformation related pathway analysis |
| Find out the enriched GO biological processes and KEGG pathways involved in transition from healthy to precancer to cancer |
| Tissue | Disease Stage | Enriched GO biological Processes |
| Colorectum | AD |  |
| Colorectum | SER |  |
| Colorectum | MSS |  |
| Colorectum | MSI-H |  |
| Colorectum | FAP |  |
| ∗Top 15 enriched GO BP terms are showed in the bar plot of each disease state in each tissue. Each row represents a significant GO biological process which is colored according to the -log10(p.adjust). |
| Page: 1 2 3 4 5 6 7 8 9 |
| GO ID | Tissue | Disease Stage | Description | Gene Ratio | Bg Ratio | pvalue | p.adjust | Count |
| GO:00064138 | Breast | Precancer | translational initiation | 30/1080 | 118/18723 | 3.23e-12 | 5.58e-10 | 30 |
| GO:00064179 | Breast | Precancer | regulation of translation | 67/1080 | 468/18723 | 4.71e-12 | 7.64e-10 | 67 |
| GO:00069869 | Breast | Precancer | response to unfolded protein | 28/1080 | 137/18723 | 3.81e-09 | 3.00e-07 | 28 |
| GO:00359669 | Breast | Precancer | response to topologically incorrect protein | 29/1080 | 159/18723 | 3.00e-08 | 1.89e-06 | 29 |
| GO:00513468 | Breast | Precancer | negative regulation of hydrolase activity | 50/1080 | 379/18723 | 3.85e-08 | 2.34e-06 | 50 |
| GO:00349769 | Breast | Precancer | response to endoplasmic reticulum stress | 38/1080 | 256/18723 | 7.89e-08 | 4.60e-06 | 38 |
| GO:00064466 | Breast | Precancer | regulation of translational initiation | 19/1080 | 79/18723 | 7.99e-08 | 4.60e-06 | 19 |
| GO:00346209 | Breast | Precancer | cellular response to unfolded protein | 21/1080 | 96/18723 | 9.80e-08 | 5.46e-06 | 21 |
| GO:00359679 | Breast | Precancer | cellular response to topologically incorrect protein | 22/1080 | 116/18723 | 6.84e-07 | 2.80e-05 | 22 |
| GO:00075653 | Breast | Precancer | female pregnancy | 29/1080 | 193/18723 | 2.07e-06 | 7.31e-05 | 29 |
| GO:00447063 | Breast | Precancer | multi-multicellular organism process | 31/1080 | 220/18723 | 3.73e-06 | 1.19e-04 | 31 |
| GO:00309687 | Breast | Precancer | endoplasmic reticulum unfolded protein response | 15/1080 | 74/18723 | 1.74e-05 | 4.17e-04 | 15 |
| GO:00069009 | Breast | Precancer | vesicle budding from membrane | 12/1080 | 61/18723 | 1.61e-04 | 2.69e-03 | 12 |
| GO:00018927 | Breast | Precancer | embryonic placenta development | 14/1080 | 82/18723 | 2.30e-04 | 3.48e-03 | 14 |
| GO:00486087 | Breast | Precancer | reproductive structure development | 43/1080 | 424/18723 | 2.36e-04 | 3.56e-03 | 43 |
| GO:00614587 | Breast | Precancer | reproductive system development | 43/1080 | 427/18723 | 2.75e-04 | 4.00e-03 | 43 |
| GO:00018907 | Breast | Precancer | placenta development | 19/1080 | 144/18723 | 6.26e-04 | 7.78e-03 | 19 |
| GO:00351486 | Breast | Precancer | tube formation | 19/1080 | 148/18723 | 8.79e-04 | 1.01e-02 | 19 |
| GO:00017017 | Breast | Precancer | in utero embryonic development | 35/1080 | 367/18723 | 2.47e-03 | 2.27e-02 | 35 |
| GO:00364992 | Breast | Precancer | PERK-mediated unfolded protein response | 5/1080 | 18/18723 | 2.88e-03 | 2.49e-02 | 5 |
| Page: 1 2 3 4 5 6 7 8 9 10 11 12 13 14 15 16 17 18 19 20 21 22 23 24 25 26 27 28 29 30 31 32 33 34 35 36 37 38 39 40 41 42 43 44 45 46 47 48 49 50 51 52 53 54 55 56 57 58 59 60 |
| Pathway ID | Tissue | Disease Stage | Description | Gene Ratio | Bg Ratio | pvalue | p.adjust | qvalue | Count |
| Page: 1 |
Top |
Cell-cell communication analysis |
| Identification of potential cell-cell interactions between two cell types and their ligand-receptor pairs for different disease states |
| Ligand | Receptor | LRpair | Pathway | Tissue | Disease Stage |
| Page: 1 |
Top |
Single-cell gene regulatory network inference analysis |
| Find out the significant the regulons (TFs) and the target genes of each regulon across cell types for different disease states |
| TF | Cell Type | Tissue | Disease Stage | Target Gene | RSS | Regulon Activity |
| ∗The dot plots of a searched regulon are shown for all cell subpopulations in each disease state of each tissue based on the regulon specific score inferred using pySCENIC and by calculating the average expression. |
| Page: 1 |
Top |
Somatic mutation of malignant transformation related genes |
| Annotation of somatic variants for genes involved in malignant transformation |
| Hugo Symbol | Variant Class | Variant Classification | dbSNP RS | HGVSc | HGVSp | HGVSp Short | SWISSPROT | BIOTYPE | SIFT | PolyPhen | Tumor Sample Barcode | Tissue | Histology | Sex | Age | Stage | Therapy Types | Drugs | Outcome |
| TMED2 | SNV | Missense_Mutation | c.461N>A | p.Arg154Gln | p.R154Q | Q15363 | protein_coding | deleterious(0.03) | benign(0.319) | TCGA-A2-A25B-01 | Breast | breast invasive carcinoma | Female | <65 | I/II | Chemotherapy | taxotere | PD | |
| TMED2 | SNV | Missense_Mutation | c.542T>A | p.Val181Asp | p.V181D | Q15363 | protein_coding | deleterious(0) | probably_damaging(0.912) | TCGA-BH-A1F5-01 | Breast | breast invasive carcinoma | Female | <65 | I/II | Unknown | Unknown | SD | |
| TMED2 | SNV | Missense_Mutation | c.142G>C | p.Glu48Gln | p.E48Q | Q15363 | protein_coding | tolerated(0.2) | possibly_damaging(0.654) | TCGA-GM-A2DH-01 | Breast | breast invasive carcinoma | Female | <65 | I/II | Chemotherapy | taxol | CR | |
| TMED2 | SNV | Missense_Mutation | novel | c.253C>G | p.His85Asp | p.H85D | Q15363 | protein_coding | tolerated(0.09) | benign(0.022) | TCGA-ZJ-A8QR-01 | Cervix | cervical & endocervical cancer | Female | <65 | I/II | Unknown | Unknown | SD |
| TMED2 | SNV | Missense_Mutation | c.319N>T | p.Met107Leu | p.M107L | Q15363 | protein_coding | tolerated(0.15) | benign(0.046) | TCGA-AA-3684-01 | Colorectum | colon adenocarcinoma | Female | >=65 | III/IV | Unknown | Unknown | SD | |
| TMED2 | SNV | Missense_Mutation | c.299C>T | p.Thr100Ile | p.T100I | Q15363 | protein_coding | deleterious(0) | probably_damaging(0.991) | TCGA-AA-3710-01 | Colorectum | colon adenocarcinoma | Female | >=65 | I/II | Unknown | Unknown | SD | |
| TMED2 | SNV | Missense_Mutation | c.131G>A | p.Gly44Asp | p.G44D | Q15363 | protein_coding | deleterious(0.04) | possibly_damaging(0.876) | TCGA-AG-A02N-01 | Colorectum | rectum adenocarcinoma | Male | >=65 | I/II | Chemotherapy | folinic | CR | |
| TMED2 | SNV | Missense_Mutation | novel | c.532C>T | p.Leu178Phe | p.L178F | Q15363 | protein_coding | tolerated(0.4) | benign(0.023) | TCGA-4E-A92E-01 | Endometrium | uterine corpus endometrioid carcinoma | Female | <65 | I/II | Unknown | Unknown | SD |
| TMED2 | SNV | Missense_Mutation | novel | c.130G>T | p.Gly44Cys | p.G44C | Q15363 | protein_coding | deleterious(0.03) | probably_damaging(0.983) | TCGA-A5-A1OF-01 | Endometrium | uterine corpus endometrioid carcinoma | Female | <65 | I/II | Unknown | Unknown | SD |
| TMED2 | SNV | Missense_Mutation | c.272A>G | p.Lys91Arg | p.K91R | Q15363 | protein_coding | tolerated(0.29) | benign(0.022) | TCGA-AP-A056-01 | Endometrium | uterine corpus endometrioid carcinoma | Female | <65 | I/II | Unknown | Unknown | SD |
| Page: 1 2 3 |
Top |
Related drugs of malignant transformation related genes |
| Identification of chemicals and drugs interact with genes involved in malignant transfromation |
| (DGIdb 4.0) |
| Entrez ID | Symbol | Category | Interaction Types | Drug Claim Name | Drug Name | PMIDs |
| Page: 1 |

Copyright 2023-Present -The University of Texas Health Science Center at Houston |