
|
|||||
|
 | |
| |
| |
| |
| |
| |
|
Gene: TMED1 |
Gene summary for TMED1 |
| Gene information | Species | Human | Gene symbol | TMED1 | Gene ID | 11018 |
| Gene name | transmembrane p24 trafficking protein 1 | |
| Gene Alias | IL1RL1LG | |
| Cytomap | 19p13.2 | |
| Gene Type | protein-coding | GO ID | GO:0006810 | UniProtAcc | Q13445 |
Top |
Malignant transformation analysis |
| Identification of the aberrant gene expression in precancerous and cancerous lesions by comparing the gene expression of stem-like cells in diseased tissues with normal stem cells |
| Entrez ID | Symbol | Replicates | Species | Organ | Tissue | Adj P-value | Log2FC | Malignancy |
| 11018 | TMED1 | LZE4T | Human | Esophagus | ESCC | 1.90e-09 | 1.87e-01 | 0.0811 |
| 11018 | TMED1 | LZE5T | Human | Esophagus | ESCC | 3.44e-03 | 3.82e-01 | 0.0514 |
| 11018 | TMED1 | LZE7T | Human | Esophagus | ESCC | 1.63e-09 | 4.94e-01 | 0.0667 |
| 11018 | TMED1 | LZE8T | Human | Esophagus | ESCC | 3.04e-08 | 2.53e-01 | 0.067 |
| 11018 | TMED1 | LZE20T | Human | Esophagus | ESCC | 5.51e-05 | 1.56e-01 | 0.0662 |
| 11018 | TMED1 | LZE24T | Human | Esophagus | ESCC | 7.29e-15 | 4.17e-01 | 0.0596 |
| 11018 | TMED1 | LZE21T | Human | Esophagus | ESCC | 1.07e-05 | 3.24e-01 | 0.0655 |
| 11018 | TMED1 | LZE6T | Human | Esophagus | ESCC | 2.02e-03 | 2.99e-01 | 0.0845 |
| 11018 | TMED1 | P1T-E | Human | Esophagus | ESCC | 1.33e-05 | 4.57e-01 | 0.0875 |
| 11018 | TMED1 | P2T-E | Human | Esophagus | ESCC | 1.16e-23 | 3.87e-01 | 0.1177 |
| 11018 | TMED1 | P4T-E | Human | Esophagus | ESCC | 6.03e-30 | 5.26e-01 | 0.1323 |
| 11018 | TMED1 | P5T-E | Human | Esophagus | ESCC | 2.34e-21 | 3.22e-01 | 0.1327 |
| 11018 | TMED1 | P8T-E | Human | Esophagus | ESCC | 1.95e-39 | 6.72e-01 | 0.0889 |
| 11018 | TMED1 | P9T-E | Human | Esophagus | ESCC | 7.36e-22 | 6.05e-01 | 0.1131 |
| 11018 | TMED1 | P10T-E | Human | Esophagus | ESCC | 6.16e-37 | 7.04e-01 | 0.116 |
| 11018 | TMED1 | P11T-E | Human | Esophagus | ESCC | 1.34e-19 | 8.37e-01 | 0.1426 |
| 11018 | TMED1 | P12T-E | Human | Esophagus | ESCC | 4.10e-36 | 5.40e-01 | 0.1122 |
| 11018 | TMED1 | P15T-E | Human | Esophagus | ESCC | 3.11e-15 | 3.36e-01 | 0.1149 |
| 11018 | TMED1 | P16T-E | Human | Esophagus | ESCC | 2.83e-16 | 4.25e-01 | 0.1153 |
| 11018 | TMED1 | P17T-E | Human | Esophagus | ESCC | 6.03e-26 | 8.31e-01 | 0.1278 |
| Page: 1 2 3 4 5 6 |
| Tissue | Expression Dynamics | Abbreviation |
| Esophagus |  | ESCC: Esophageal squamous cell carcinoma |
| HGIN: High-grade intraepithelial neoplasias | ||
| LGIN: Low-grade intraepithelial neoplasias | ||
| Liver |  | HCC: Hepatocellular carcinoma |
| NAFLD: Non-alcoholic fatty liver disease | ||
| Oral Cavity |  | EOLP: Erosive Oral lichen planus |
| LP: leukoplakia | ||
| NEOLP: Non-erosive oral lichen planus | ||
| OSCC: Oral squamous cell carcinoma | ||
| Skin | 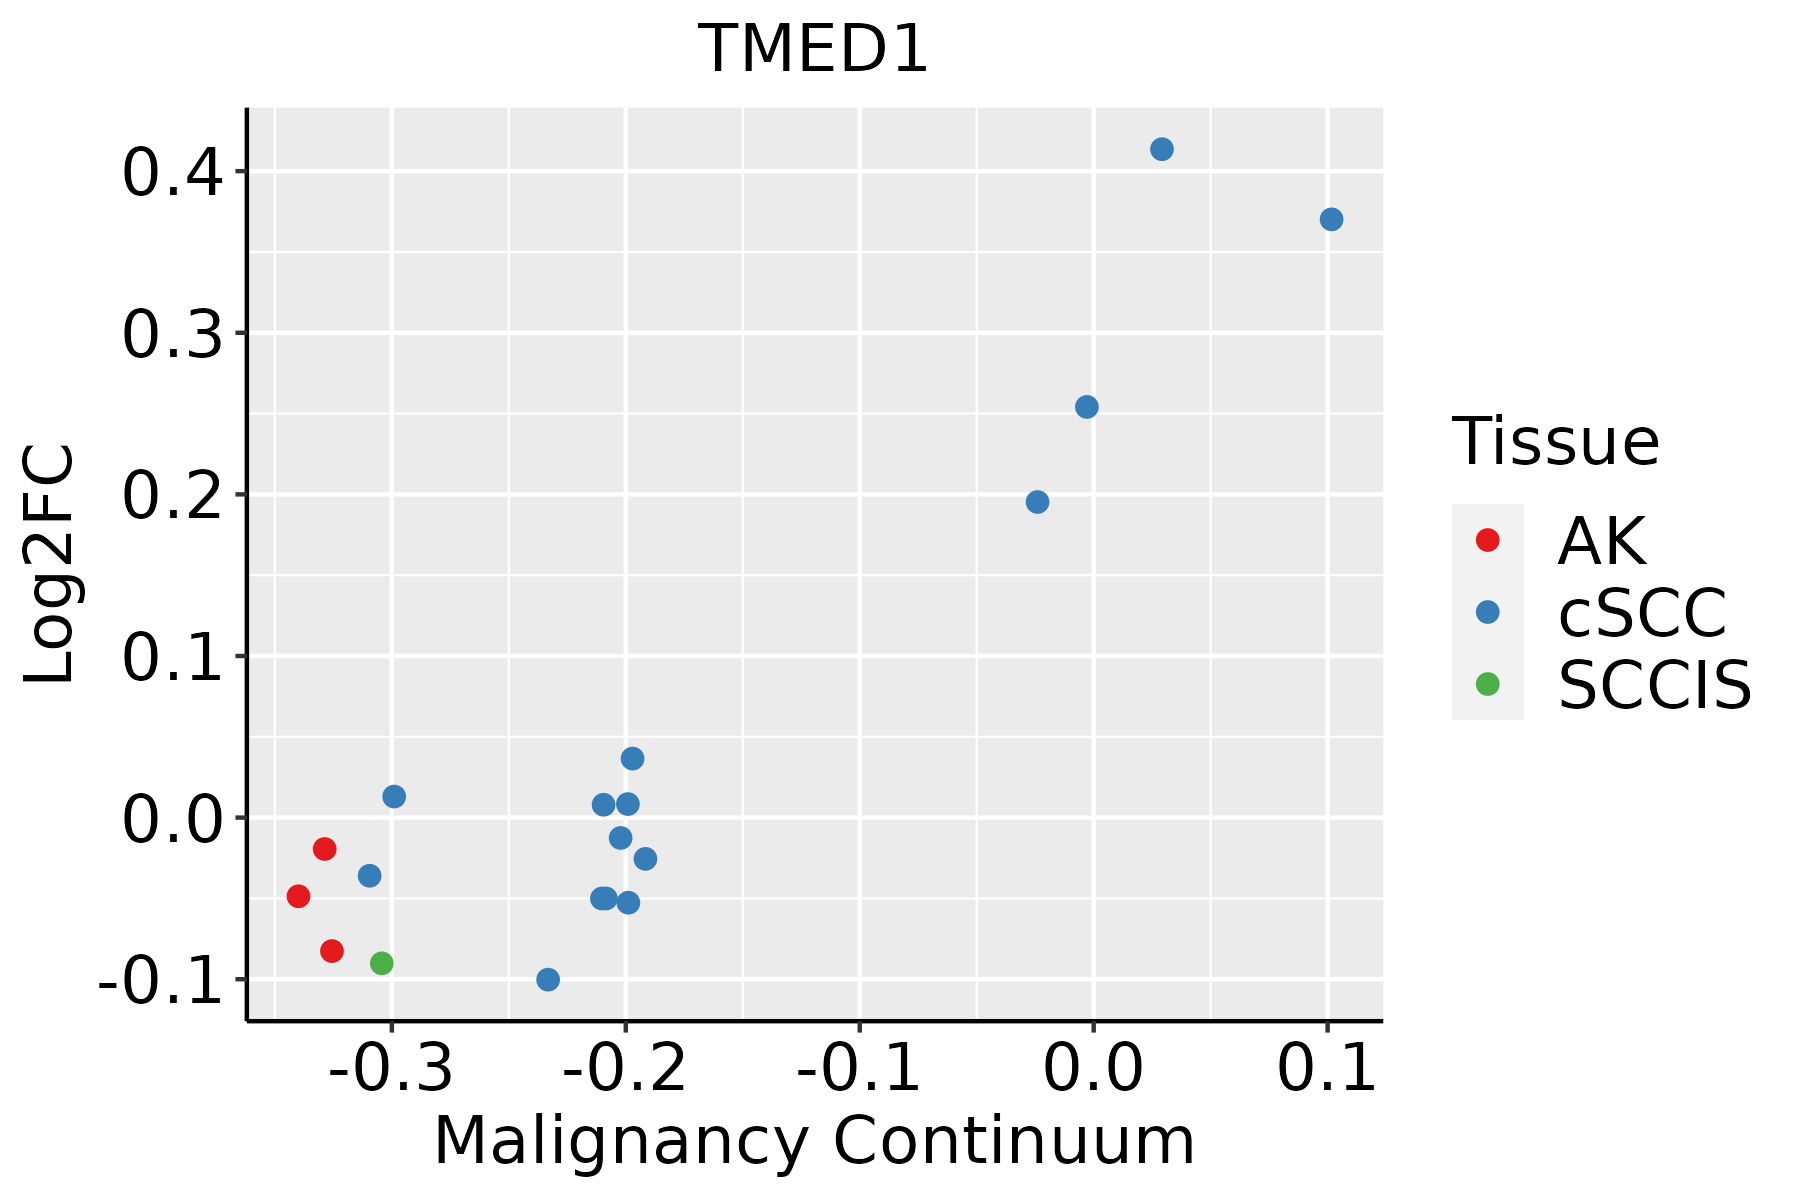 | AK: Actinic keratosis |
| cSCC: Cutaneous squamous cell carcinoma | ||
| SCCIS:squamous cell carcinoma in situ | ||
| Thyroid | 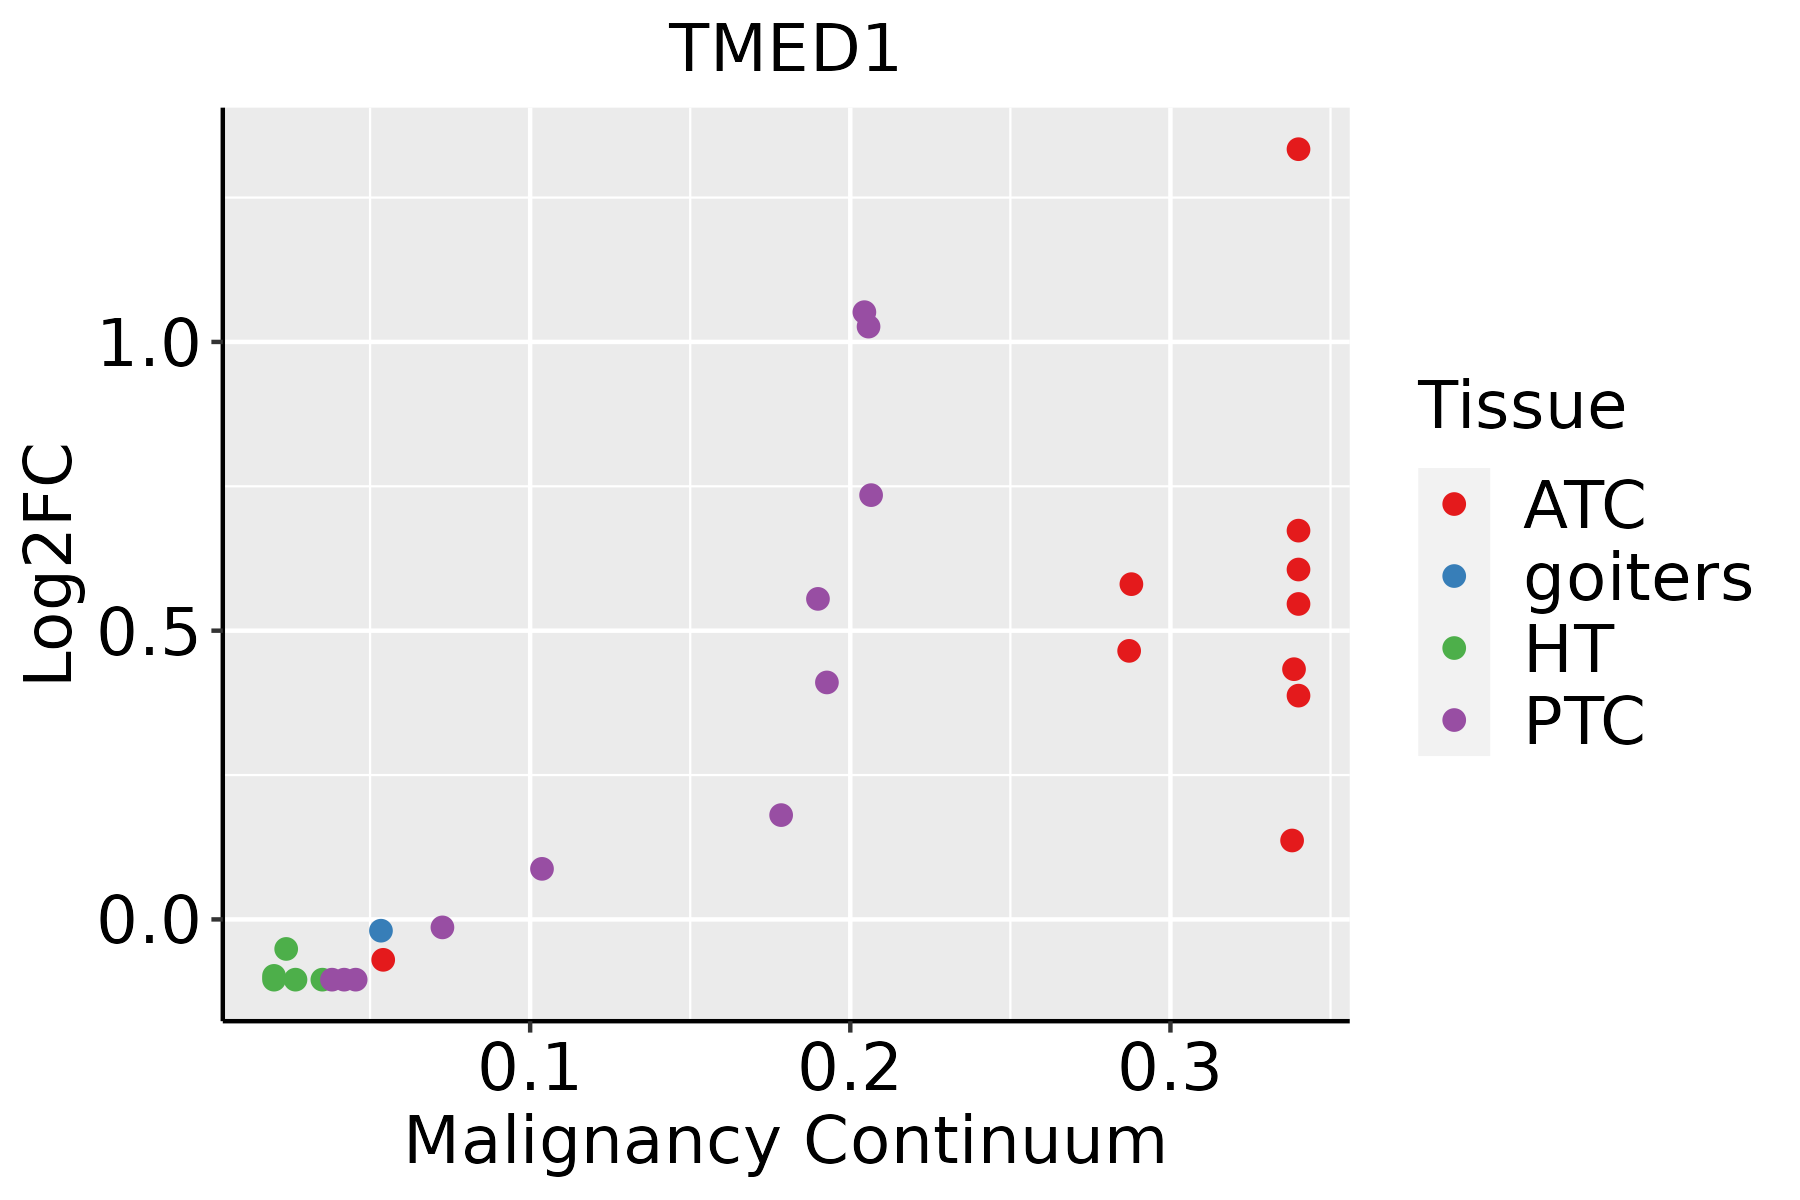 | ATC: Anaplastic thyroid cancer |
| HT: Hashimoto's thyroiditis | ||
| PTC: Papillary thyroid cancer |
| ∗log2FC in expression of this searched gene in stem-like cells from each diseased tissue sample relative to stem-like cells in normal samples in each tissue plotted against the malignancy continuum. Samples are colored based on if they are from different disease stage. |
Top |
Malignant transformation related pathway analysis |
| Find out the enriched GO biological processes and KEGG pathways involved in transition from healthy to precancer to cancer |
| Tissue | Disease Stage | Enriched GO biological Processes |
| Colorectum | AD |  |
| Colorectum | SER |  |
| Colorectum | MSS |  |
| Colorectum | MSI-H |  |
| Colorectum | FAP |  |
| ∗Top 15 enriched GO BP terms are showed in the bar plot of each disease state in each tissue. Each row represents a significant GO biological process which is colored according to the -log10(p.adjust). |
| Page: 1 2 3 4 5 6 7 8 9 |
| GO ID | Tissue | Disease Stage | Description | Gene Ratio | Bg Ratio | pvalue | p.adjust | Count |
| GO:00525479 | Breast | Precancer | regulation of peptidase activity | 71/1080 | 461/18723 | 2.72e-14 | 6.94e-12 | 71 |
| GO:00525489 | Breast | Precancer | regulation of endopeptidase activity | 67/1080 | 432/18723 | 1.06e-13 | 2.36e-11 | 67 |
| GO:00458619 | Breast | Precancer | negative regulation of proteolysis | 50/1080 | 351/18723 | 2.99e-09 | 2.39e-07 | 50 |
| GO:00513468 | Breast | Precancer | negative regulation of hydrolase activity | 50/1080 | 379/18723 | 3.85e-08 | 2.34e-06 | 50 |
| GO:00104668 | Breast | Precancer | negative regulation of peptidase activity | 38/1080 | 262/18723 | 1.46e-07 | 7.82e-06 | 38 |
| GO:00109519 | Breast | Precancer | negative regulation of endopeptidase activity | 37/1080 | 252/18723 | 1.55e-07 | 8.05e-06 | 37 |
| GO:00018196 | Breast | Precancer | positive regulation of cytokine production | 52/1080 | 467/18723 | 4.18e-06 | 1.29e-04 | 52 |
| GO:19049519 | Breast | Precancer | positive regulation of establishment of protein localization | 36/1080 | 319/18723 | 9.30e-05 | 1.75e-03 | 36 |
| GO:00069009 | Breast | Precancer | vesicle budding from membrane | 12/1080 | 61/18723 | 1.61e-04 | 2.69e-03 | 12 |
| GO:00512229 | Breast | Precancer | positive regulation of protein transport | 31/1080 | 303/18723 | 1.44e-03 | 1.50e-02 | 31 |
| GO:00507086 | Breast | Precancer | regulation of protein secretion | 28/1080 | 268/18723 | 1.76e-03 | 1.74e-02 | 28 |
| GO:00718064 | Breast | Precancer | protein transmembrane transport | 10/1080 | 59/18723 | 1.86e-03 | 1.81e-02 | 10 |
| GO:0032732 | Breast | Precancer | positive regulation of interleukin-1 production | 11/1080 | 73/18723 | 2.96e-03 | 2.55e-02 | 11 |
| GO:00716926 | Breast | Precancer | protein localization to extracellular region | 34/1080 | 368/18723 | 4.65e-03 | 3.58e-02 | 34 |
| GO:00093067 | Breast | Precancer | protein secretion | 33/1080 | 359/18723 | 5.65e-03 | 4.08e-02 | 33 |
| GO:00355927 | Breast | Precancer | establishment of protein localization to extracellular region | 33/1080 | 360/18723 | 5.89e-03 | 4.21e-02 | 33 |
| GO:00481992 | Breast | Precancer | vesicle targeting, to, from or within Golgi | 5/1080 | 21/18723 | 5.93e-03 | 4.21e-02 | 5 |
| GO:005254714 | Breast | IDC | regulation of peptidase activity | 96/1434 | 461/18723 | 7.58e-20 | 6.15e-17 | 96 |
| GO:005254814 | Breast | IDC | regulation of endopeptidase activity | 88/1434 | 432/18723 | 1.20e-17 | 4.85e-15 | 88 |
| GO:004586114 | Breast | IDC | negative regulation of proteolysis | 70/1434 | 351/18723 | 8.21e-14 | 2.22e-11 | 70 |
| Page: 1 2 3 4 5 6 7 8 9 10 11 12 13 14 15 16 17 18 19 20 21 22 23 24 25 26 27 28 29 30 31 32 33 34 35 36 37 |
| Pathway ID | Tissue | Disease Stage | Description | Gene Ratio | Bg Ratio | pvalue | p.adjust | qvalue | Count |
| Page: 1 |
Top |
Cell-cell communication analysis |
| Identification of potential cell-cell interactions between two cell types and their ligand-receptor pairs for different disease states |
| Ligand | Receptor | LRpair | Pathway | Tissue | Disease Stage |
| Page: 1 |
Top |
Single-cell gene regulatory network inference analysis |
| Find out the significant the regulons (TFs) and the target genes of each regulon across cell types for different disease states |
| TF | Cell Type | Tissue | Disease Stage | Target Gene | RSS | Regulon Activity |
| ∗The dot plots of a searched regulon are shown for all cell subpopulations in each disease state of each tissue based on the regulon specific score inferred using pySCENIC and by calculating the average expression. |
| Page: 1 |
Top |
Somatic mutation of malignant transformation related genes |
| Annotation of somatic variants for genes involved in malignant transformation |
| Hugo Symbol | Variant Class | Variant Classification | dbSNP RS | HGVSc | HGVSp | HGVSp Short | SWISSPROT | BIOTYPE | SIFT | PolyPhen | Tumor Sample Barcode | Tissue | Histology | Sex | Age | Stage | Therapy Types | Drugs | Outcome |
| TMED1 | SNV | Missense_Mutation | novel | c.138C>G | p.Phe46Leu | p.F46L | Q13445 | protein_coding | deleterious(0.02) | probably_damaging(0.951) | TCGA-C5-A7UI-01 | Cervix | cervical & endocervical cancer | Female | <65 | I/II | Unknown | Unknown | SD |
| TMED1 | SNV | Missense_Mutation | rs571976171 | c.191N>A | p.Gly64Glu | p.G64E | Q13445 | protein_coding | tolerated(0.22) | benign(0.055) | TCGA-HM-A4S6-01 | Cervix | cervical & endocervical cancer | Female | <65 | III/IV | Chemotherapy | cisplatin | CR |
| TMED1 | SNV | Missense_Mutation | novel | c.110N>C | p.Leu37Pro | p.L37P | Q13445 | protein_coding | deleterious(0.05) | probably_damaging(0.953) | TCGA-VS-A9V4-01 | Cervix | cervical & endocervical cancer | Female | <65 | I/II | Chemotherapy | cisplatin | PD |
| TMED1 | SNV | Missense_Mutation | c.293N>T | p.Thr98Met | p.T98M | Q13445 | protein_coding | deleterious(0.02) | probably_damaging(0.985) | TCGA-AZ-6598-01 | Colorectum | colon adenocarcinoma | Female | >=65 | I/II | Unknown | Unknown | SD | |
| TMED1 | SNV | Missense_Mutation | rs555516048 | c.641N>T | p.Thr214Met | p.T214M | Q13445 | protein_coding | tolerated(0.71) | benign(0.094) | TCGA-CK-4952-01 | Colorectum | colon adenocarcinoma | Female | <65 | III/IV | Unknown | Unknown | SD |
| TMED1 | SNV | Missense_Mutation | novel | c.73G>A | p.Gly25Arg | p.G25R | Q13445 | protein_coding | tolerated(0.16) | possibly_damaging(0.879) | TCGA-AG-3583-01 | Colorectum | rectum adenocarcinoma | Male | >=65 | III/IV | Unknown | Unknown | PD |
| TMED1 | SNV | Missense_Mutation | novel | c.577G>A | p.Val193Ile | p.V193I | Q13445 | protein_coding | tolerated(0.05) | probably_damaging(0.979) | TCGA-AP-A1DK-01 | Endometrium | uterine corpus endometrioid carcinoma | Female | <65 | I/II | Unknown | Unknown | SD |
| TMED1 | SNV | Missense_Mutation | rs376139740 | c.548N>A | p.Arg183His | p.R183H | Q13445 | protein_coding | deleterious(0) | probably_damaging(1) | TCGA-AX-A0J1-01 | Endometrium | uterine corpus endometrioid carcinoma | Female | >=65 | I/II | Unknown | Unknown | SD |
| TMED1 | SNV | Missense_Mutation | rs375902608 | c.313N>A | p.Leu105Met | p.L105M | Q13445 | protein_coding | tolerated(0.09) | possibly_damaging(0.643) | TCGA-AX-A3G9-01 | Endometrium | uterine corpus endometrioid carcinoma | Female | <65 | III/IV | Chemotherapy | carboplatin | SD |
| TMED1 | SNV | Missense_Mutation | novel | c.506N>C | p.Ile169Thr | p.I169T | Q13445 | protein_coding | tolerated(0.45) | benign(0.055) | TCGA-B5-A1MW-01 | Endometrium | uterine corpus endometrioid carcinoma | Female | <65 | I/II | Unknown | Unknown | PD |
| Page: 1 2 3 |
Top |
Related drugs of malignant transformation related genes |
| Identification of chemicals and drugs interact with genes involved in malignant transfromation |
| (DGIdb 4.0) |
| Entrez ID | Symbol | Category | Interaction Types | Drug Claim Name | Drug Name | PMIDs |
| Page: 1 |

Copyright 2023-Present -The University of Texas Health Science Center at Houston |