
|
|||||
|
 | |
| |
| |
| |
| |
| |
|
Gene: TMCO6 |
Gene summary for TMCO6 |
| Gene information | Species | Human | Gene symbol | TMCO6 | Gene ID | 55374 |
| Gene name | transmembrane and coiled-coil domains 6 | |
| Gene Alias | PRO1580 | |
| Cytomap | 5q31.3 | |
| Gene Type | protein-coding | GO ID | GO:0006606 | UniProtAcc | Q96DC7 |
Top |
Malignant transformation analysis |
| Identification of the aberrant gene expression in precancerous and cancerous lesions by comparing the gene expression of stem-like cells in diseased tissues with normal stem cells |
| Entrez ID | Symbol | Replicates | Species | Organ | Tissue | Adj P-value | Log2FC | Malignancy |
| 55374 | TMCO6 | LZE24T | Human | Esophagus | ESCC | 6.85e-08 | 2.26e-01 | 0.0596 |
| 55374 | TMCO6 | P2T-E | Human | Esophagus | ESCC | 6.54e-16 | 1.37e-01 | 0.1177 |
| 55374 | TMCO6 | P4T-E | Human | Esophagus | ESCC | 5.78e-04 | 1.83e-01 | 0.1323 |
| 55374 | TMCO6 | P5T-E | Human | Esophagus | ESCC | 2.50e-07 | 1.03e-01 | 0.1327 |
| 55374 | TMCO6 | P8T-E | Human | Esophagus | ESCC | 5.57e-05 | 1.11e-01 | 0.0889 |
| 55374 | TMCO6 | P10T-E | Human | Esophagus | ESCC | 8.63e-06 | 8.43e-02 | 0.116 |
| 55374 | TMCO6 | P12T-E | Human | Esophagus | ESCC | 1.84e-18 | 3.61e-01 | 0.1122 |
| 55374 | TMCO6 | P15T-E | Human | Esophagus | ESCC | 3.25e-11 | 2.66e-01 | 0.1149 |
| 55374 | TMCO6 | P16T-E | Human | Esophagus | ESCC | 4.79e-11 | 1.55e-01 | 0.1153 |
| 55374 | TMCO6 | P20T-E | Human | Esophagus | ESCC | 6.13e-17 | 4.03e-01 | 0.1124 |
| 55374 | TMCO6 | P21T-E | Human | Esophagus | ESCC | 3.48e-13 | 1.77e-01 | 0.1617 |
| 55374 | TMCO6 | P22T-E | Human | Esophagus | ESCC | 5.27e-13 | 1.84e-01 | 0.1236 |
| 55374 | TMCO6 | P23T-E | Human | Esophagus | ESCC | 2.87e-06 | 1.79e-01 | 0.108 |
| 55374 | TMCO6 | P24T-E | Human | Esophagus | ESCC | 2.24e-17 | 1.52e-01 | 0.1287 |
| 55374 | TMCO6 | P26T-E | Human | Esophagus | ESCC | 8.92e-11 | 1.91e-01 | 0.1276 |
| 55374 | TMCO6 | P27T-E | Human | Esophagus | ESCC | 1.55e-07 | 1.20e-01 | 0.1055 |
| 55374 | TMCO6 | P28T-E | Human | Esophagus | ESCC | 4.19e-07 | 1.38e-01 | 0.1149 |
| 55374 | TMCO6 | P30T-E | Human | Esophagus | ESCC | 2.43e-05 | 2.29e-01 | 0.137 |
| 55374 | TMCO6 | P31T-E | Human | Esophagus | ESCC | 6.81e-07 | 1.45e-01 | 0.1251 |
| 55374 | TMCO6 | P32T-E | Human | Esophagus | ESCC | 1.62e-08 | 1.14e-01 | 0.1666 |
| Page: 1 2 3 |
| Tissue | Expression Dynamics | Abbreviation |
| Esophagus | 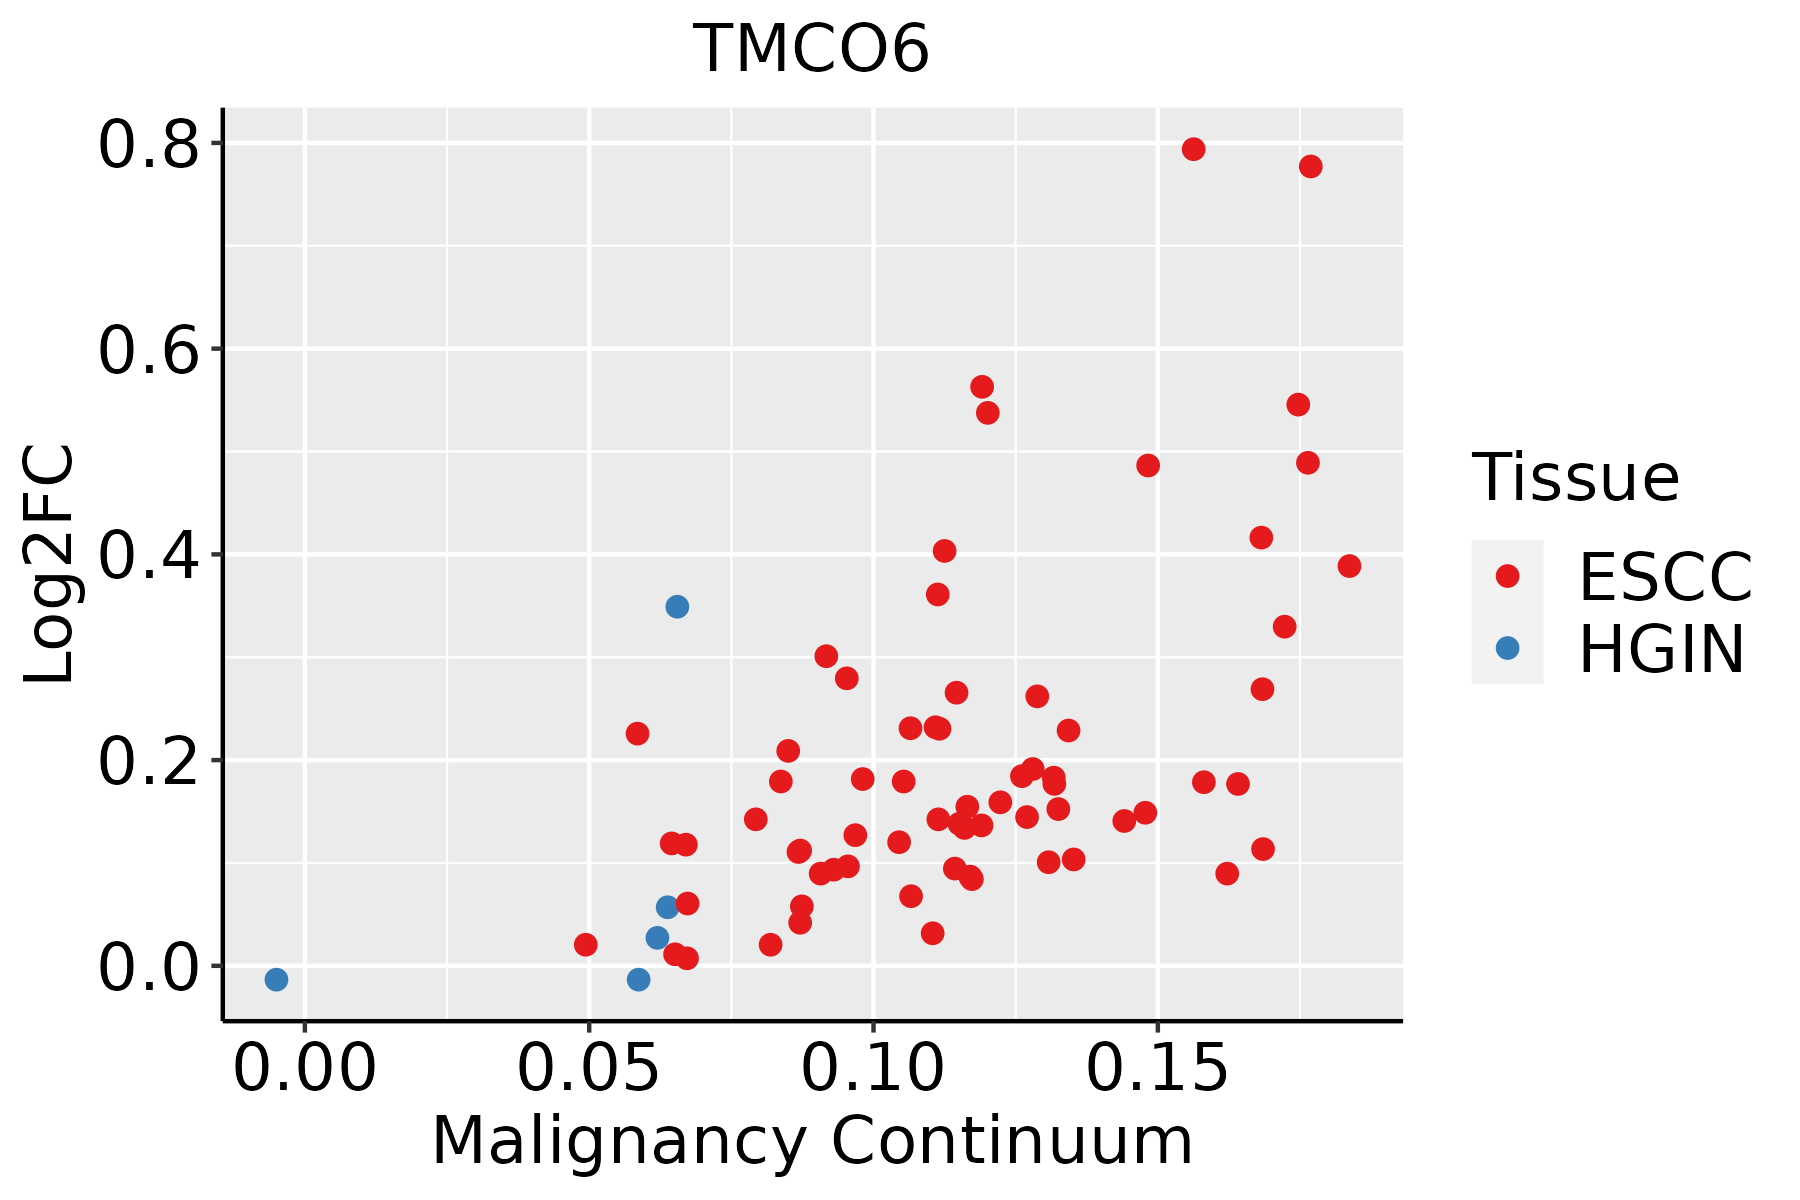 | ESCC: Esophageal squamous cell carcinoma |
| HGIN: High-grade intraepithelial neoplasias | ||
| LGIN: Low-grade intraepithelial neoplasias |
| ∗log2FC in expression of this searched gene in stem-like cells from each diseased tissue sample relative to stem-like cells in normal samples in each tissue plotted against the malignancy continuum. Samples are colored based on if they are from different disease stage. |
Top |
Malignant transformation related pathway analysis |
| Find out the enriched GO biological processes and KEGG pathways involved in transition from healthy to precancer to cancer |
| Tissue | Disease Stage | Enriched GO biological Processes |
| Colorectum | AD |  |
| Colorectum | SER |  |
| Colorectum | MSS |  |
| Colorectum | MSI-H |  |
| Colorectum | FAP |  |
| ∗Top 15 enriched GO BP terms are showed in the bar plot of each disease state in each tissue. Each row represents a significant GO biological process which is colored according to the -log10(p.adjust). |
| Page: 1 2 3 4 5 6 7 8 9 |
| GO ID | Tissue | Disease Stage | Description | Gene Ratio | Bg Ratio | pvalue | p.adjust | Count |
| GO:0072594110 | Esophagus | ESCC | establishment of protein localization to organelle | 311/8552 | 422/18723 | 3.02e-32 | 2.13e-29 | 311 |
| GO:0006913110 | Esophagus | ESCC | nucleocytoplasmic transport | 230/8552 | 301/18723 | 6.04e-28 | 2.02e-25 | 230 |
| GO:0051169110 | Esophagus | ESCC | nuclear transport | 230/8552 | 301/18723 | 6.04e-28 | 2.02e-25 | 230 |
| GO:003450418 | Esophagus | ESCC | protein localization to nucleus | 211/8552 | 290/18723 | 4.06e-21 | 6.60e-19 | 211 |
| GO:001703818 | Esophagus | ESCC | protein import | 149/8552 | 206/18723 | 5.90e-15 | 3.31e-13 | 149 |
| GO:005117014 | Esophagus | ESCC | import into nucleus | 111/8552 | 159/18723 | 5.69e-10 | 1.44e-08 | 111 |
| GO:000660613 | Esophagus | ESCC | protein import into nucleus | 108/8552 | 155/18723 | 1.16e-09 | 2.77e-08 | 108 |
| Page: 1 |
| Pathway ID | Tissue | Disease Stage | Description | Gene Ratio | Bg Ratio | pvalue | p.adjust | qvalue | Count |
| Page: 1 |
Top |
Cell-cell communication analysis |
| Identification of potential cell-cell interactions between two cell types and their ligand-receptor pairs for different disease states |
| Ligand | Receptor | LRpair | Pathway | Tissue | Disease Stage |
| Page: 1 |
Top |
Single-cell gene regulatory network inference analysis |
| Find out the significant the regulons (TFs) and the target genes of each regulon across cell types for different disease states |
| TF | Cell Type | Tissue | Disease Stage | Target Gene | RSS | Regulon Activity |
| ∗The dot plots of a searched regulon are shown for all cell subpopulations in each disease state of each tissue based on the regulon specific score inferred using pySCENIC and by calculating the average expression. |
| Page: 1 |
Top |
Somatic mutation of malignant transformation related genes |
| Annotation of somatic variants for genes involved in malignant transformation |
| Hugo Symbol | Variant Class | Variant Classification | dbSNP RS | HGVSc | HGVSp | HGVSp Short | SWISSPROT | BIOTYPE | SIFT | PolyPhen | Tumor Sample Barcode | Tissue | Histology | Sex | Age | Stage | Therapy Types | Drugs | Outcome |
| TMCO6 | SNV | Missense_Mutation | novel | c.320N>G | p.Glu107Gly | p.E107G | Q96DC7 | protein_coding | deleterious(0.02) | probably_damaging(0.964) | TCGA-A8-A095-01 | Breast | breast invasive carcinoma | Female | <65 | I/II | Chemotherapy | 5-fluorouracil | CR |
| TMCO6 | SNV | Missense_Mutation | novel | c.320N>G | p.Glu107Gly | p.E107G | Q96DC7 | protein_coding | deleterious(0.02) | probably_damaging(0.964) | TCGA-A8-A096-01 | Breast | breast invasive carcinoma | Female | >=65 | I/II | Unknown | Unknown | SD |
| TMCO6 | SNV | Missense_Mutation | c.814N>C | p.Ile272Leu | p.I272L | Q96DC7 | protein_coding | tolerated(0.39) | benign(0.001) | TCGA-B6-A1KN-01 | Breast | breast invasive carcinoma | Female | <65 | III/IV | Unknown | Unknown | SD | |
| TMCO6 | SNV | Missense_Mutation | novel | c.1347T>G | p.Ser449Arg | p.S449R | Q96DC7 | protein_coding | deleterious(0.02) | probably_damaging(0.974) | TCGA-BH-A18N-01 | Breast | breast invasive carcinoma | Female | >=65 | I/II | Unknown | Unknown | SD |
| TMCO6 | SNV | Missense_Mutation | novel | c.320A>G | p.Glu107Gly | p.E107G | Q96DC7 | protein_coding | deleterious(0.02) | probably_damaging(0.964) | TCGA-D8-A1Y3-01 | Breast | breast invasive carcinoma | Female | <65 | III/IV | Chemotherapy | doxorubicine+cyclophosphamide | SD |
| TMCO6 | SNV | Missense_Mutation | c.698N>T | p.Ser233Phe | p.S233F | Q96DC7 | protein_coding | tolerated_low_confidence(0.31) | benign(0.011) | TCGA-E2-A14Z-01 | Breast | breast invasive carcinoma | Female | <65 | I/II | Hormone Therapy | arimidex | PD | |
| TMCO6 | SNV | Missense_Mutation | novel | c.1285N>T | p.Pro429Ser | p.P429S | Q96DC7 | protein_coding | tolerated(0.79) | benign(0.154) | TCGA-WT-AB41-01 | Breast | breast invasive carcinoma | Female | <65 | I/II | Chemotherapy | taxotere | CR |
| TMCO6 | SNV | Missense_Mutation | novel | c.145G>T | p.Ala49Ser | p.A49S | Q96DC7 | protein_coding | tolerated(0.78) | benign(0.065) | TCGA-2W-A8YY-01 | Cervix | cervical & endocervical cancer | Female | <65 | I/II | Chemotherapy | cisplatin | CR |
| TMCO6 | SNV | Missense_Mutation | c.151N>C | p.Glu51Gln | p.E51Q | Q96DC7 | protein_coding | tolerated(0.08) | possibly_damaging(0.899) | TCGA-C5-A1MK-01 | Cervix | cervical & endocervical cancer | Female | >=65 | III/IV | Chemotherapy | carboplatin | PD | |
| TMCO6 | SNV | Missense_Mutation | novel | c.1068N>A | p.Phe356Leu | p.F356L | Q96DC7 | protein_coding | tolerated(1) | benign(0) | TCGA-HM-A3JJ-01 | Cervix | cervical & endocervical cancer | Female | <65 | I/II | Chemotherapy | cisplatin | PD |
| Page: 1 2 3 4 5 |
Top |
Related drugs of malignant transformation related genes |
| Identification of chemicals and drugs interact with genes involved in malignant transfromation |
| (DGIdb 4.0) |
| Entrez ID | Symbol | Category | Interaction Types | Drug Claim Name | Drug Name | PMIDs |
| Page: 1 |

Copyright 2023-Present -The University of Texas Health Science Center at Houston |