Schematic overview of the cellular and molecular mechanisms involved in the cancer progression, including the proposed cellular and molecular mechanisms in cancer cells trajectory. AT1: alveolar type 1 cells; AT2: alveolar type 2 cells; AAH: atypical adenomatous hyperplasia; AIS: adenocarcinoma in situ; MIA: minimally invasive adenocarcinoma; IA: invasive adenocarcinoma; EMT: epithelial-mesenchymal transition

Home

Download

Statistics

Help

Contact

Center for Computational Systems Medicine
leaf

Gene summary

leaf

Malignant transformation analysis

leaf

Malignant transformation related pathway analysis

leaf

Cell-cell communication analysis

leaf

Single-cell gene regulatory network inference analysis

leaf

Somatic mutation of malignant transformation related genes

leaf

Related drugs of malignant transformation related genes

Gene: TMCO1

Gene summary for TMCO1

check button Gene summary.

Gene informationSpeciesHuman
Gene symbol

TMCO1

Gene ID

54499

Gene nametransmembrane and coiled-coil domains 1
Gene AliasHP10122
Cytomap1q24.1
Gene Typeprotein-coding
GO ID

GO:0006810

UniProtAcc

B7Z591


Top

Malignant transformation analysis

check button Identification of the aberrant gene expression in precancerous and cancerous lesions by comparing the gene expression of stem-like cells in diseased tissues with normal stem cells
check button Malignant transformation involving gene list.
Entrez IDSymbolReplicatesSpeciesOrganTissueAdj P-valueLog2FCMalignancy
54499TMCO1GSM4909282HumanBreastIDC1.71e-155.65e-01-0.0288
54499TMCO1GSM4909285HumanBreastIDC9.23e-073.51e-010.21
54499TMCO1GSM4909286HumanBreastIDC1.11e-05-2.72e-010.1081
54499TMCO1GSM4909287HumanBreastIDC7.29e-063.18e-010.2057
54499TMCO1GSM4909293HumanBreastIDC4.92e-276.24e-010.1581
54499TMCO1GSM4909294HumanBreastIDC6.89e-03-1.18e-010.2022
54499TMCO1GSM4909296HumanBreastIDC5.64e-12-6.74e-020.1524
54499TMCO1GSM4909297HumanBreastIDC4.08e-16-1.47e-010.1517
54499TMCO1GSM4909298HumanBreastIDC1.37e-074.17e-010.1551
54499TMCO1GSM4909301HumanBreastIDC2.19e-1001.17e+000.1577
54499TMCO1GSM4909302HumanBreastIDC3.70e-063.34e-010.1545
54499TMCO1GSM4909306HumanBreastIDC4.08e-215.83e-010.1564
54499TMCO1GSM4909307HumanBreastIDC5.54e-155.24e-010.1569
54499TMCO1GSM4909308HumanBreastIDC2.64e-316.78e-010.158
54499TMCO1GSM4909309HumanBreastIDC1.65e-032.28e-010.0483
54499TMCO1GSM4909311HumanBreastIDC1.51e-30-5.23e-020.1534
54499TMCO1GSM4909312HumanBreastIDC1.71e-133.04e-010.1552
54499TMCO1GSM4909313HumanBreastIDC1.61e-093.87e-010.0391
54499TMCO1GSM4909317HumanBreastIDC6.85e-367.78e-010.1355
54499TMCO1GSM4909318HumanBreastIDC9.32e-043.41e-010.2031
Page: 1 2 3 4 5 6 7 8 9 10 11 

check button Transcriptomic changes along malignancy continuum.
TissueExpression DynamicsAbbreviation
BreastThe image shows the transcriptomic changes along malignancy continuum.log2FC in expression of this searched gene in stem-like cells from each diseased tissue sample relative to stem-like cells in normal samples in each tissue plotted against the malignancy continuum. Samples are colored based on if they are from different disease stage.
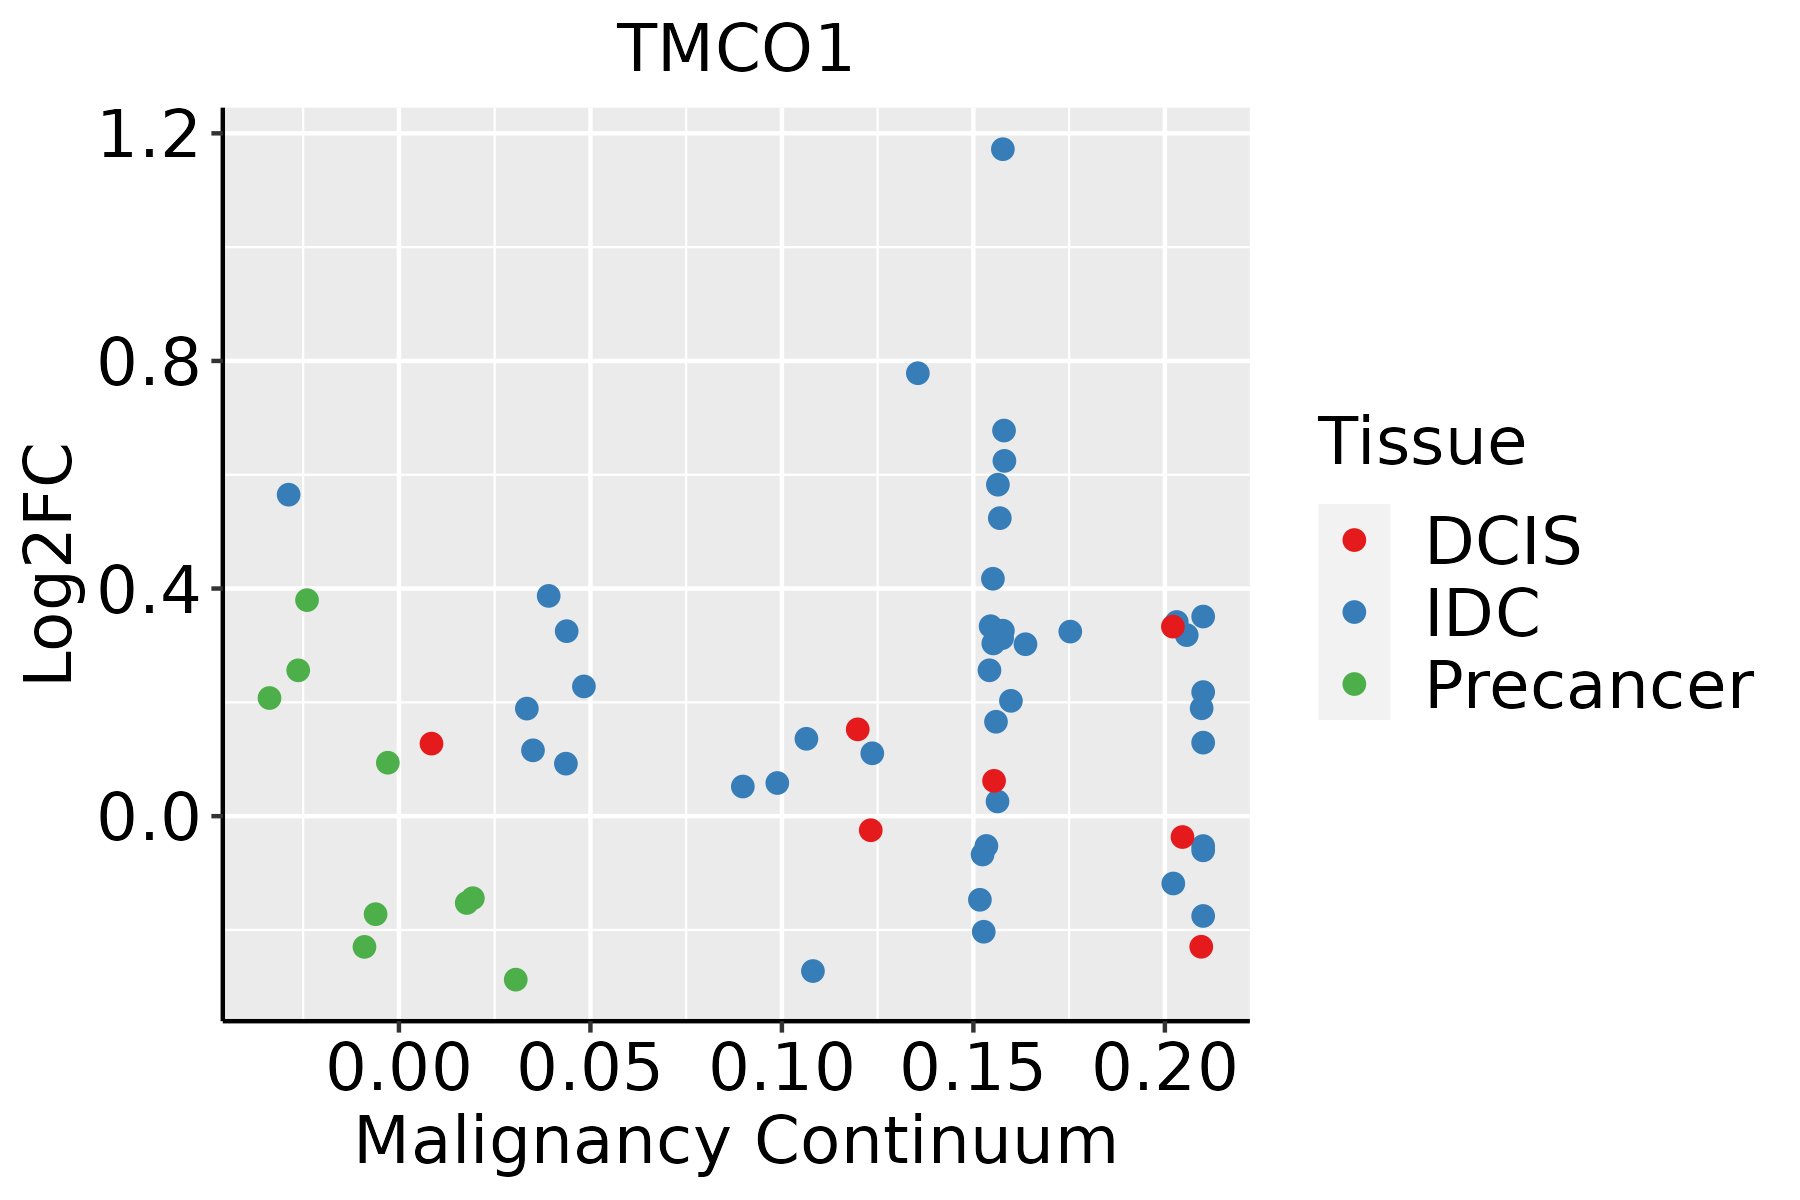
IDC: Invasive ductal carcinoma
DCIS: Ductal carcinoma in situ
Precancer(BRCA1-mut): Precancerous lesion from BRCA1 mutation carriers
Colorectum (GSE201348)The image shows the transcriptomic changes along malignancy continuum.log2FC in expression of this searched gene in stem-like cells from each diseased tissue sample relative to stem-like cells in normal samples in each tissue plotted against the malignancy continuum. Samples are colored based on if they are from different disease stage.FAP: Familial adenomatous polyposis
CRC: Colorectal cancer
Colorectum (HTA11)The image shows the transcriptomic changes along malignancy continuum.log2FC in expression of this searched gene in stem-like cells from each diseased tissue sample relative to stem-like cells in normal samples in each tissue plotted against the malignancy continuum. Samples are colored based on if they are from different disease stage.AD: Adenomas
SER: Sessile serrated lesions
MSI-H: Microsatellite-high colorectal cancer
MSS: Microsatellite stable colorectal cancer
EndometriumThe image shows the transcriptomic changes along malignancy continuum.log2FC in expression of this searched gene in stem-like cells from each diseased tissue sample relative to stem-like cells in normal samples in each tissue plotted against the malignancy continuum. Samples are colored based on if they are from different disease stage.
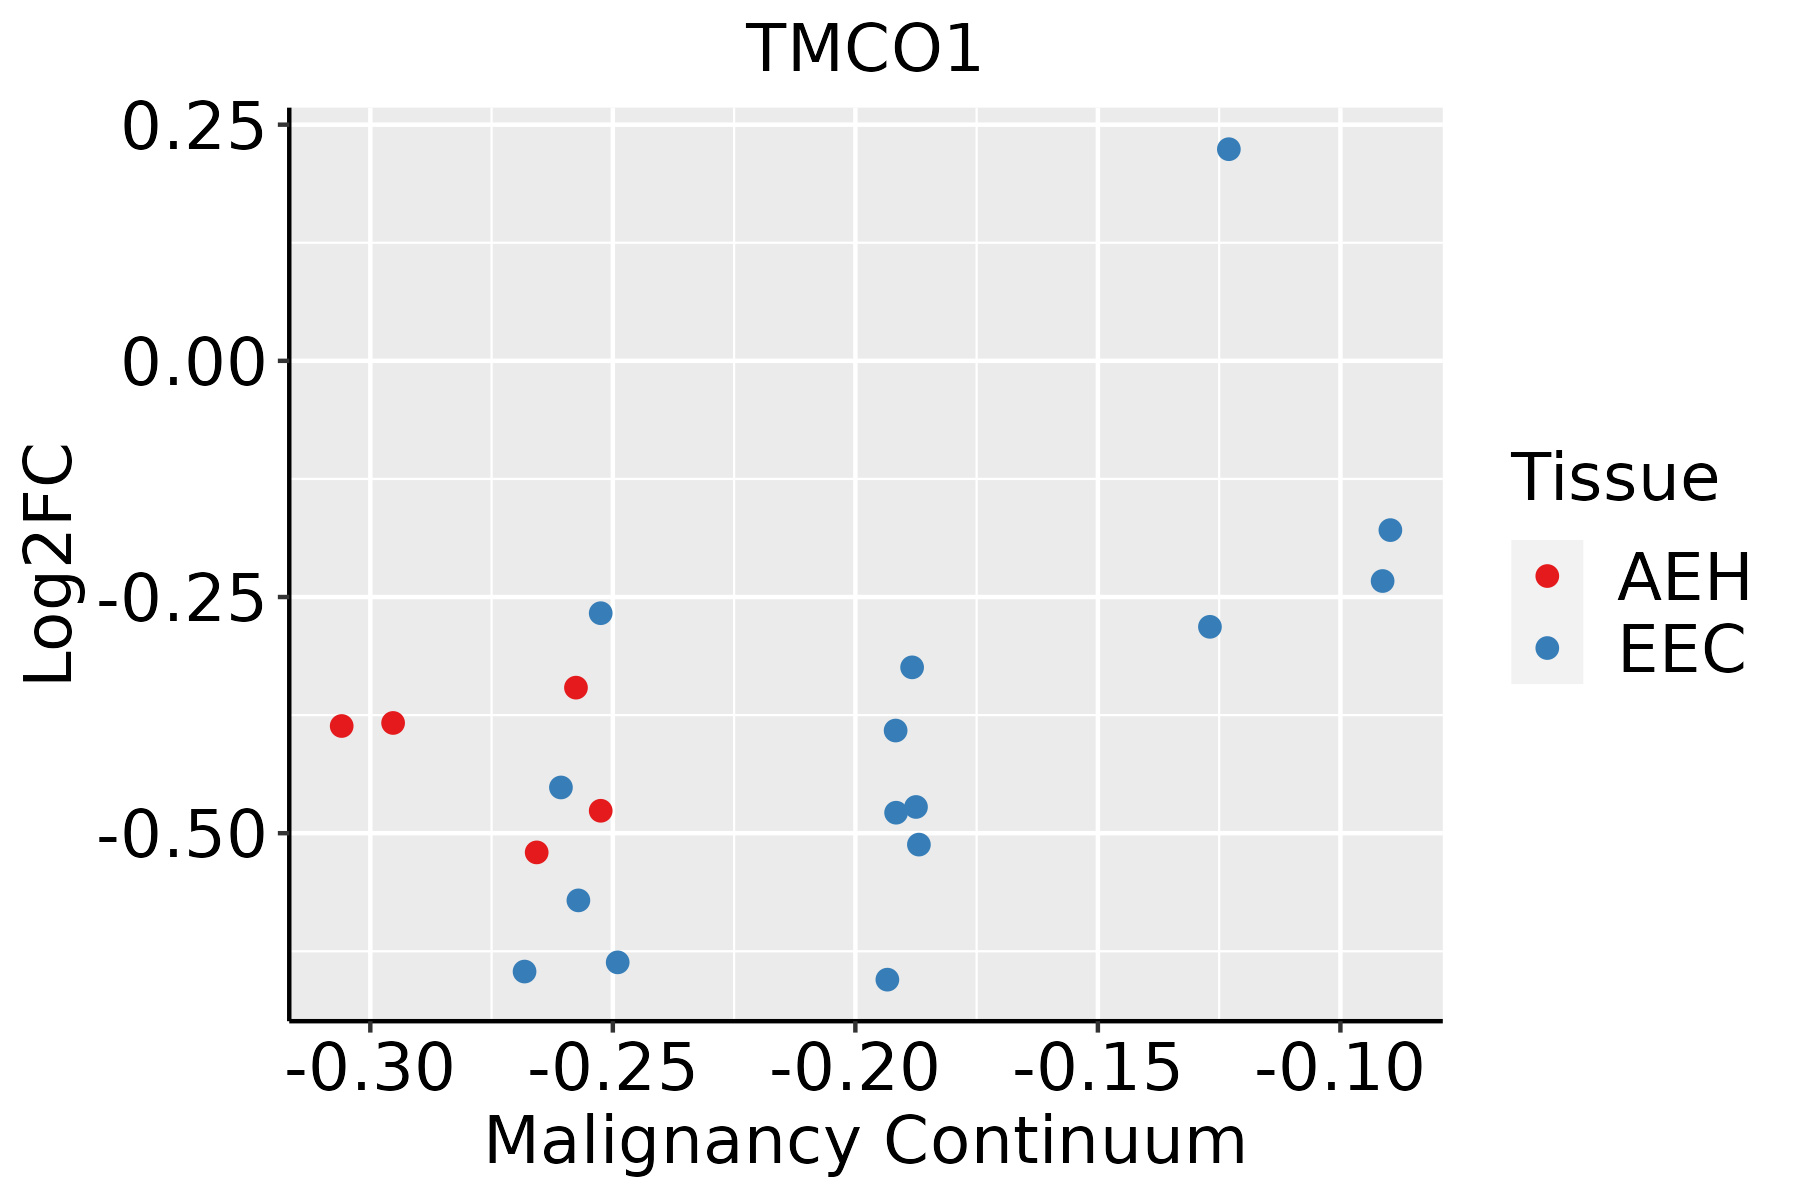
AEH: Atypical endometrial hyperplasia
EEC: Endometrioid Cancer
EsophagusThe image shows the transcriptomic changes along malignancy continuum.log2FC in expression of this searched gene in stem-like cells from each diseased tissue sample relative to stem-like cells in normal samples in each tissue plotted against the malignancy continuum. Samples are colored based on if they are from different disease stage.
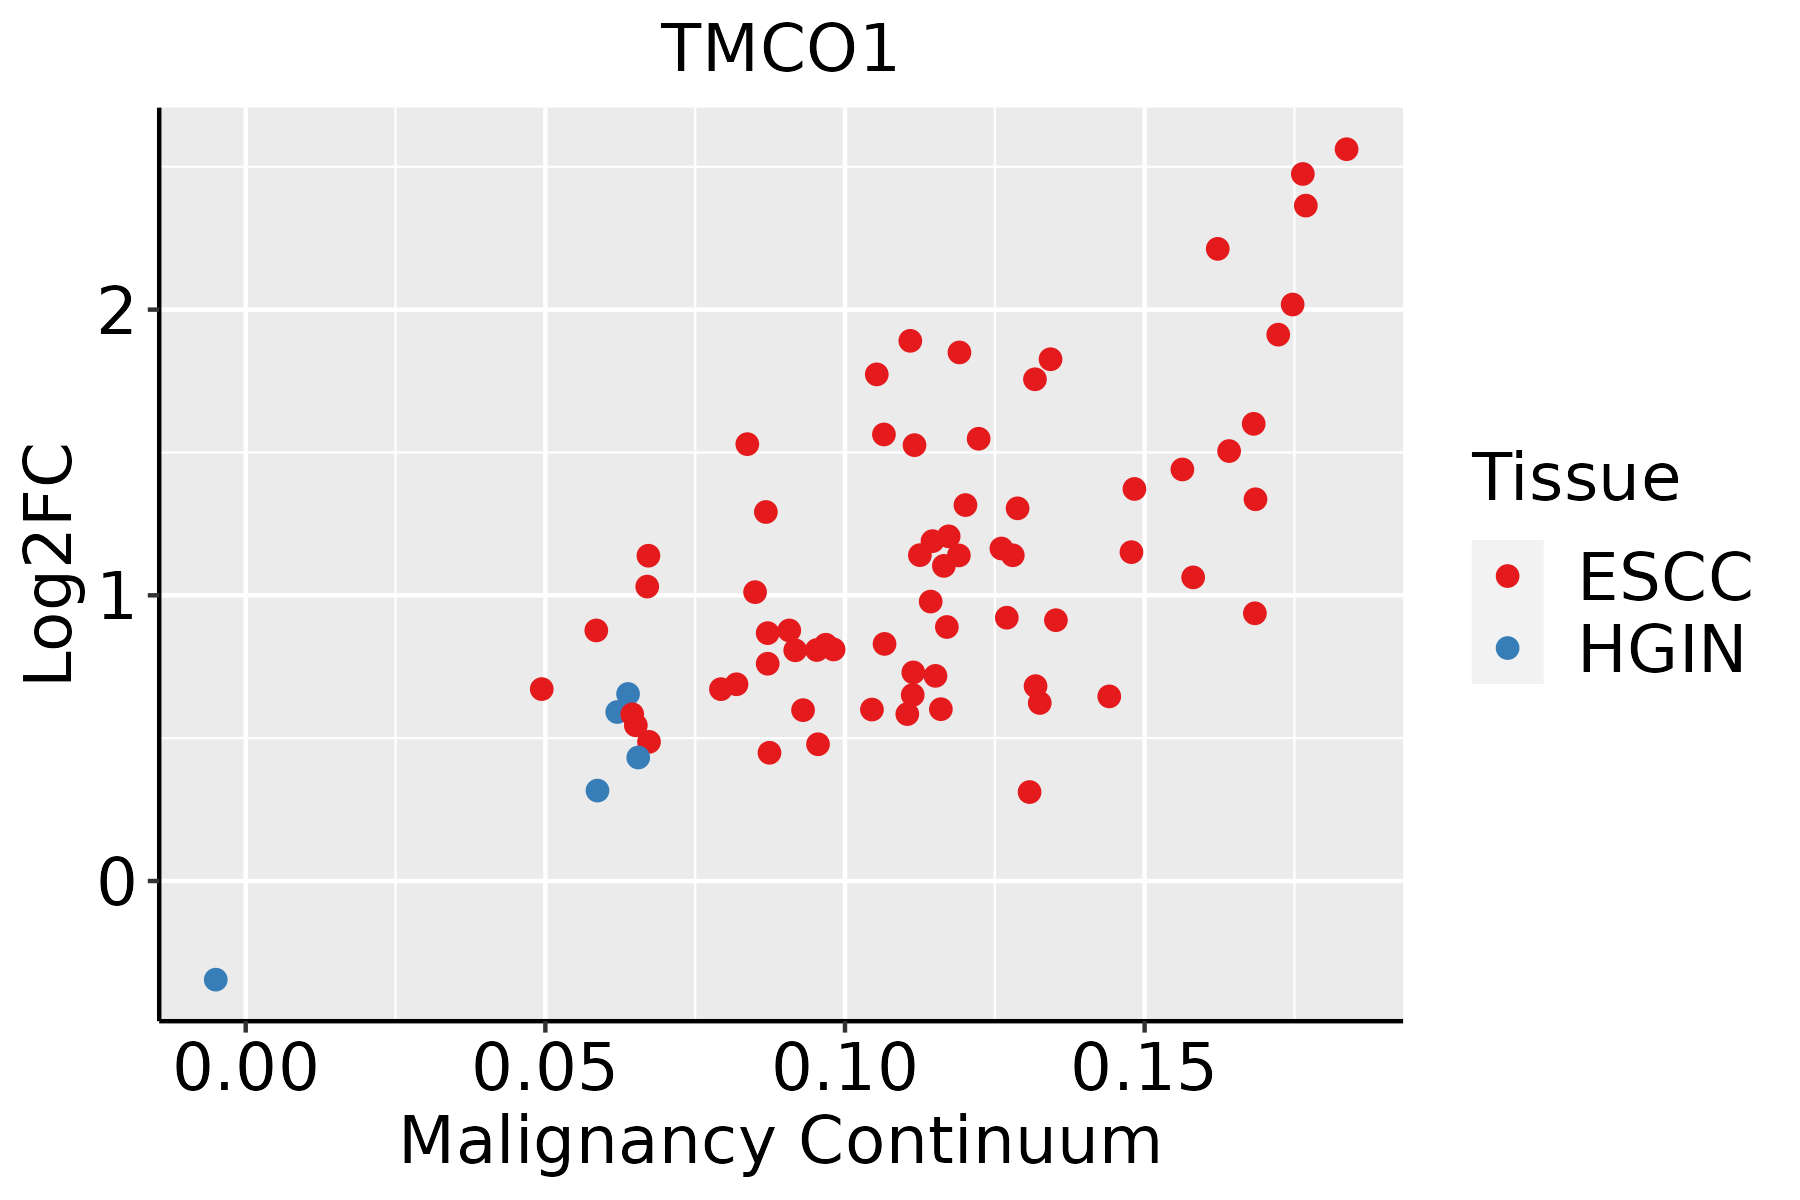
ESCC: Esophageal squamous cell carcinoma
HGIN: High-grade intraepithelial neoplasias
LGIN: Low-grade intraepithelial neoplasias
LiverThe image shows the transcriptomic changes along malignancy continuum.log2FC in expression of this searched gene in stem-like cells from each diseased tissue sample relative to stem-like cells in normal samples in each tissue plotted against the malignancy continuum. Samples are colored based on if they are from different disease stage.HCC: Hepatocellular carcinoma
NAFLD: Non-alcoholic fatty liver disease
Oral CavityThe image shows the transcriptomic changes along malignancy continuum.log2FC in expression of this searched gene in stem-like cells from each diseased tissue sample relative to stem-like cells in normal samples in each tissue plotted against the malignancy continuum. Samples are colored based on if they are from different disease stage.EOLP: Erosive Oral lichen planus
LP: leukoplakia
NEOLP: Non-erosive oral lichen planus
OSCC: Oral squamous cell carcinoma
ProstateThe image shows the transcriptomic changes along malignancy continuum.log2FC in expression of this searched gene in stem-like cells from each diseased tissue sample relative to stem-like cells in normal samples in each tissue plotted against the malignancy continuum. Samples are colored based on if they are from different disease stage.BPH: Benign Prostatic Hyperplasia
SkinThe image shows the transcriptomic changes along malignancy continuum.log2FC in expression of this searched gene in stem-like cells from each diseased tissue sample relative to stem-like cells in normal samples in each tissue plotted against the malignancy continuum. Samples are colored based on if they are from different disease stage.AK: Actinic keratosis
cSCC: Cutaneous squamous cell carcinoma
SCCIS:squamous cell carcinoma in situ
ThyroidThe image shows the transcriptomic changes along malignancy continuum.log2FC in expression of this searched gene in stem-like cells from each diseased tissue sample relative to stem-like cells in normal samples in each tissue plotted against the malignancy continuum. Samples are colored based on if they are from different disease stage.ATC: Anaplastic thyroid cancer
HT: Hashimoto's thyroiditis
PTC: Papillary thyroid cancer
∗log2FC in expression of this searched gene in stem-like cells from each diseased tissue sample relative to stem-like cells in normal samples in each tissue plotted against the malignancy continuum. Samples are colored based on if they are from different disease stage.

Top

Malignant transformation related pathway analysis

check buttonFind out the enriched GO biological processes and KEGG pathways involved in transition from healthy to precancer to cancer
check button Figure of enriched GO biological processes.
TissueDisease StageEnriched GO biological Processes
ColorectumADGO analysis - Figure of enriched GO biological processes: Top 15 enriched GO BP terms are showed in the bar plot of each disease state in each tissue. Each row represents a significant GO biological process which is colored according to the -log10(p.adjust).
ColorectumSERGO analysis - Figure of enriched GO biological processes: Top 15 enriched GO BP terms are showed in the bar plot of each disease state in each tissue. Each row represents a significant GO biological process which is colored according to the -log10(p.adjust).
ColorectumMSSGO analysis - Figure of enriched GO biological processes: Top 15 enriched GO BP terms are showed in the bar plot of each disease state in each tissue. Each row represents a significant GO biological process which is colored according to the -log10(p.adjust).
ColorectumMSI-HGO analysis - Figure of enriched GO biological processes: Top 15 enriched GO BP terms are showed in the bar plot of each disease state in each tissue. Each row represents a significant GO biological process which is colored according to the -log10(p.adjust).
ColorectumFAPGO analysis - Figure of enriched GO biological processes: Top 15 enriched GO BP terms are showed in the bar plot of each disease state in each tissue. Each row represents a significant GO biological process which is colored according to the -log10(p.adjust).
∗Top 15 enriched GO BP terms are showed in the bar plot of each disease state in each tissue. Each row represents a significant GO biological process which is colored according to the -log10(p.adjust).
Page: 1 2 3 4 5 6 7 8 9 

check button Enriched GO biological processes.
GO IDTissueDisease StageDescriptionGene RatioBg Ratiopvaluep.adjustCount
GO:00349769BreastPrecancerresponse to endoplasmic reticulum stress38/1080256/187237.89e-084.60e-0638
GO:00712167BreastPrecancercellular response to biotic stimulus28/1080246/187234.67e-046.14e-0328
GO:00324697BreastPrecancerendoplasmic reticulum calcium ion homeostasis6/108025/187232.49e-032.28e-026
GO:00069845BreastPrecancerER-nucleus signaling pathway8/108046/187234.40e-033.43e-028
GO:0072503BreastPrecancercellular divalent inorganic cation homeostasis42/1080486/187235.91e-034.21e-0242
GO:003497614BreastIDCresponse to endoplasmic reticulum stress43/1434256/187238.42e-073.82e-0543
GO:003246913BreastIDCendoplasmic reticulum calcium ion homeostasis8/143425/187233.85e-045.40e-038
GO:000698412BreastIDCER-nucleus signaling pathway10/143446/187232.15e-032.00e-0210
GO:007121611BreastIDCcellular response to biotic stimulus31/1434246/187234.23e-033.31e-0231
GO:003497622BreastDCISresponse to endoplasmic reticulum stress43/1390256/187233.65e-071.71e-0543
GO:000698421BreastDCISER-nucleus signaling pathway10/139046/187231.70e-031.68e-0210
GO:003246922BreastDCISendoplasmic reticulum calcium ion homeostasis7/139025/187231.79e-031.73e-027
GO:007121621BreastDCIScellular response to biotic stimulus30/1390246/187234.99e-033.72e-0230
GO:0034976ColorectumADresponse to endoplasmic reticulum stress90/3918256/187238.48e-084.28e-0690
GO:0032469ColorectumADendoplasmic reticulum calcium ion homeostasis16/391825/187233.80e-061.04e-0416
GO:0006984ColorectumADER-nucleus signaling pathway21/391846/187231.47e-042.08e-0321
GO:00349762ColorectumMSSresponse to endoplasmic reticulum stress81/3467256/187232.65e-071.10e-0581
GO:00324692ColorectumMSSendoplasmic reticulum calcium ion homeostasis16/346725/187236.86e-072.48e-0516
GO:00069842ColorectumMSSER-nucleus signaling pathway19/346746/187232.79e-043.69e-0319
GO:0006983ColorectumMSSER overload response7/346713/187234.46e-033.15e-027
Page: 1 2 3 4 

check button Enriched KEGG pathways.
Pathway IDTissueDisease StageDescriptionGene RatioBg Ratiopvaluep.adjustqvalueCount
Page: 1 

Top

Cell-cell communication analysis

check buttonIdentification of potential cell-cell interactions between two cell types and their ligand-receptor pairs for different disease states
LigandReceptorLRpairPathwayTissueDisease Stage
Page: 1 

Top

Single-cell gene regulatory network inference analysis

check buttonFind out the significant the regulons (TFs) and the target genes of each regulon across cell types for different disease states
TFCell TypeTissueDisease StageTarget GeneRSSRegulon Activity
∗The dot plots of a searched regulon are shown for all cell subpopulations in each disease state of each tissue based on the regulon specific score inferred using pySCENIC and by calculating the average expression.
Page: 1 

Top

Somatic mutation of malignant transformation related genes

check buttonAnnotation of somatic variants for genes involved in malignant transformation
Hugo SymbolVariant ClassVariant ClassificationdbSNP RSHGVScHGVSpHGVSp ShortSWISSPROTBIOTYPESIFTPolyPhenTumor Sample BarcodeTissueHistologySexAgeStageTherapy TypesDrugsOutcome
TMCO1SNVMissense_Mutationc.354G>Cp.Lys118Asnp.K118Nprotein_codingdeleterious(0)possibly_damaging(0.881)TCGA-AC-A23H-01Breastbreast invasive carcinomaFemale>=65I/IIUnknownUnknownPD
TMCO1SNVMissense_Mutationnovelc.143N>Ap.Arg48Glnp.R48Qprotein_codingdeleterious_low_confidence(0.03)benign(0.034)TCGA-BH-A0HB-01Breastbreast invasive carcinomaFemale<65I/IIChemotherapydocetaxelSD
TMCO1SNVMissense_Mutationc.442T>Ap.Cys148Serp.C148Sprotein_codingtolerated(0.34)benign(0.006)TCGA-D8-A146-01Breastbreast invasive carcinomaFemale<65I/IIUnknownUnknownSD
TMCO1SNVMissense_Mutationc.410N>Cp.Val137Alap.V137Aprotein_codingtolerated(0.19)possibly_damaging(0.469)TCGA-D8-A1XK-01Breastbreast invasive carcinomaFemale<65I/IIChemotherapydoxorubicine+cyclophosphamideSD
TMCO1SNVMissense_Mutationc.332N>Tp.Ser111Leup.S111Lprotein_codingtolerated(0.11)possibly_damaging(0.861)TCGA-EK-A3GK-01Cervixcervical & endocervical cancerFemale<65I/IIUnknownUnknownSD
TMCO1SNVMissense_Mutationrs763875549c.413G>Ap.Arg138Glnp.R138Qprotein_codingdeleterious(0.01)possibly_damaging(0.591)TCGA-AA-3510-01Colorectumcolon adenocarcinomaMale>=65I/IIUnknownUnknownSD
TMCO1SNVMissense_Mutationc.236T>Ap.Val79Aspp.V79Dprotein_codingdeleterious(0)possibly_damaging(0.889)TCGA-DM-A1HB-01Colorectumcolon adenocarcinomaMale>=65III/IVUnknownUnknownSD
TMCO1SNVMissense_Mutationnovelc.586N>Gp.Phe196Valp.F196Vprotein_codingdeleterious(0)probably_damaging(0.998)TCGA-A5-A0G2-01Endometriumuterine corpus endometrioid carcinomaFemale<65III/IVUnknownUnknownSD
TMCO1SNVMissense_Mutationnovelc.527T>Cp.Ile176Thrp.I176Tprotein_codingdeleterious(0.03)benign(0.041)TCGA-AJ-A3EK-01Endometriumuterine corpus endometrioid carcinomaFemale<65I/IIChemotherapycarboplatinCR
TMCO1SNVMissense_Mutationrs763875549c.413G>Ap.Arg138Glnp.R138Qprotein_codingdeleterious(0.01)possibly_damaging(0.591)TCGA-AP-A056-01Endometriumuterine corpus endometrioid carcinomaFemale<65I/IIUnknownUnknownSD
Page: 1 2 3 

Top

Related drugs of malignant transformation related genes

check buttonIdentification of chemicals and drugs interact with genes involved in malignant transfromation
(DGIdb 4.0)
Entrez IDSymbolCategoryInteraction TypesDrug Claim NameDrug NamePMIDs
Page: 1