
|
|||||
|
 | |
| |
| |
| |
| |
| |
|
Gene: TMC8 |
Gene summary for TMC8 |
| Gene information | Species | Human | Gene symbol | TMC8 | Gene ID | 147138 |
| Gene name | transmembrane channel like 8 | |
| Gene Alias | EV2 | |
| Cytomap | 17q25.3 | |
| Gene Type | protein-coding | GO ID | GO:0001558 | UniProtAcc | A0A024R8N8 |
Top |
Malignant transformation analysis |
| Identification of the aberrant gene expression in precancerous and cancerous lesions by comparing the gene expression of stem-like cells in diseased tissues with normal stem cells |
| Entrez ID | Symbol | Replicates | Species | Organ | Tissue | Adj P-value | Log2FC | Malignancy |
| 147138 | TMC8 | LZE4T | Human | Esophagus | ESCC | 9.43e-11 | 4.16e-01 | 0.0811 |
| 147138 | TMC8 | LZE7T | Human | Esophagus | ESCC | 2.15e-10 | 5.19e-01 | 0.0667 |
| 147138 | TMC8 | LZE22T | Human | Esophagus | ESCC | 1.95e-03 | 3.46e-01 | 0.068 |
| 147138 | TMC8 | LZE21T | Human | Esophagus | ESCC | 5.21e-12 | 6.93e-01 | 0.0655 |
| 147138 | TMC8 | LZE6T | Human | Esophagus | ESCC | 3.14e-02 | 1.88e-01 | 0.0845 |
| 147138 | TMC8 | P1T-E | Human | Esophagus | ESCC | 9.29e-08 | 4.15e-01 | 0.0875 |
| 147138 | TMC8 | P2T-E | Human | Esophagus | ESCC | 1.45e-09 | 2.48e-01 | 0.1177 |
| 147138 | TMC8 | P4T-E | Human | Esophagus | ESCC | 2.91e-09 | 3.53e-01 | 0.1323 |
| 147138 | TMC8 | P5T-E | Human | Esophagus | ESCC | 2.69e-02 | 1.46e-01 | 0.1327 |
| 147138 | TMC8 | P11T-E | Human | Esophagus | ESCC | 1.34e-17 | 8.49e-01 | 0.1426 |
| 147138 | TMC8 | P12T-E | Human | Esophagus | ESCC | 9.43e-31 | 6.89e-01 | 0.1122 |
| 147138 | TMC8 | P20T-E | Human | Esophagus | ESCC | 2.58e-30 | 1.00e+00 | 0.1124 |
| 147138 | TMC8 | P21T-E | Human | Esophagus | ESCC | 1.99e-11 | 1.17e-01 | 0.1617 |
| 147138 | TMC8 | P22T-E | Human | Esophagus | ESCC | 3.77e-10 | 2.48e-01 | 0.1236 |
| 147138 | TMC8 | P23T-E | Human | Esophagus | ESCC | 1.03e-07 | 4.57e-01 | 0.108 |
| 147138 | TMC8 | P24T-E | Human | Esophagus | ESCC | 8.51e-11 | 3.30e-01 | 0.1287 |
| 147138 | TMC8 | P26T-E | Human | Esophagus | ESCC | 5.99e-55 | 1.19e+00 | 0.1276 |
| 147138 | TMC8 | P27T-E | Human | Esophagus | ESCC | 1.67e-33 | 7.44e-01 | 0.1055 |
| 147138 | TMC8 | P28T-E | Human | Esophagus | ESCC | 7.79e-30 | 5.57e-01 | 0.1149 |
| 147138 | TMC8 | P31T-E | Human | Esophagus | ESCC | 5.55e-03 | 1.09e-01 | 0.1251 |
| Page: 1 2 3 4 |
| Tissue | Expression Dynamics | Abbreviation |
| Esophagus | 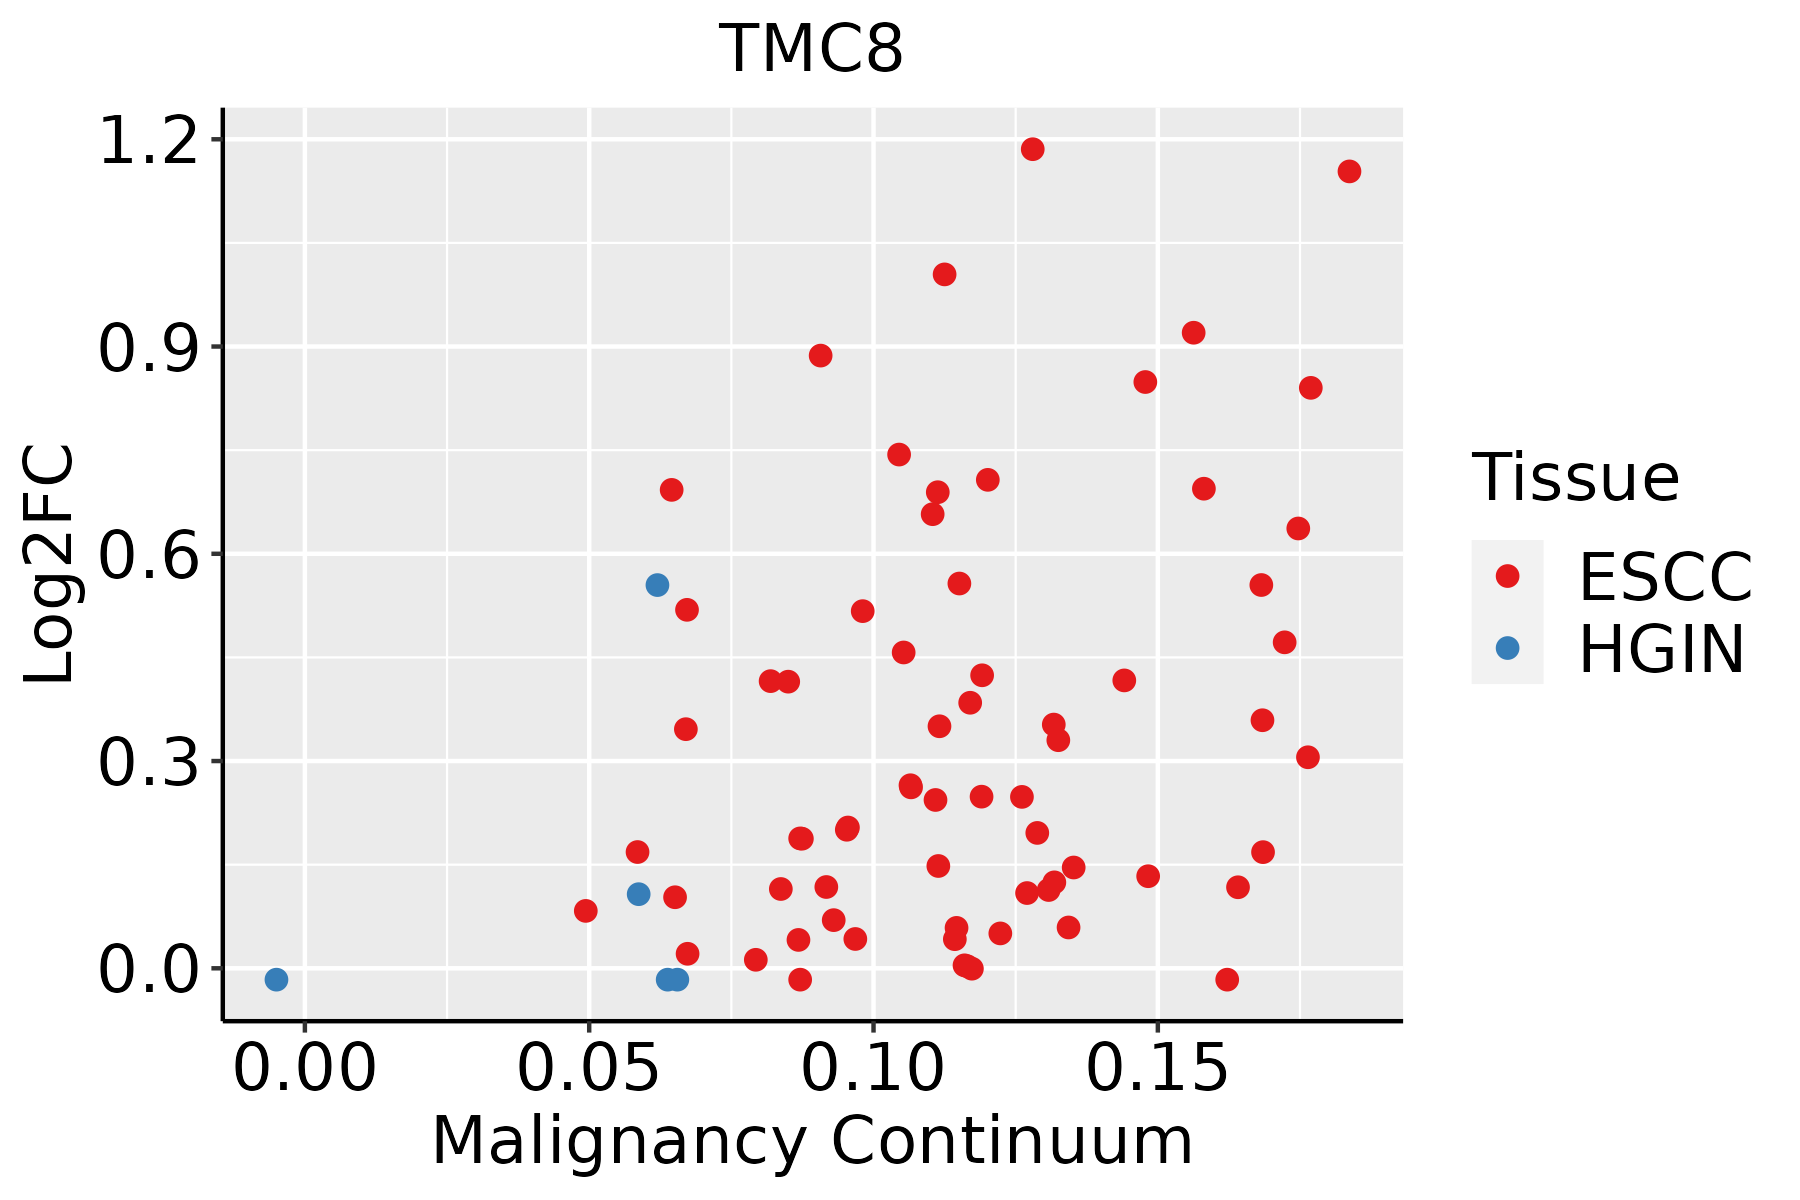 | ESCC: Esophageal squamous cell carcinoma |
| HGIN: High-grade intraepithelial neoplasias | ||
| LGIN: Low-grade intraepithelial neoplasias | ||
| Oral Cavity | 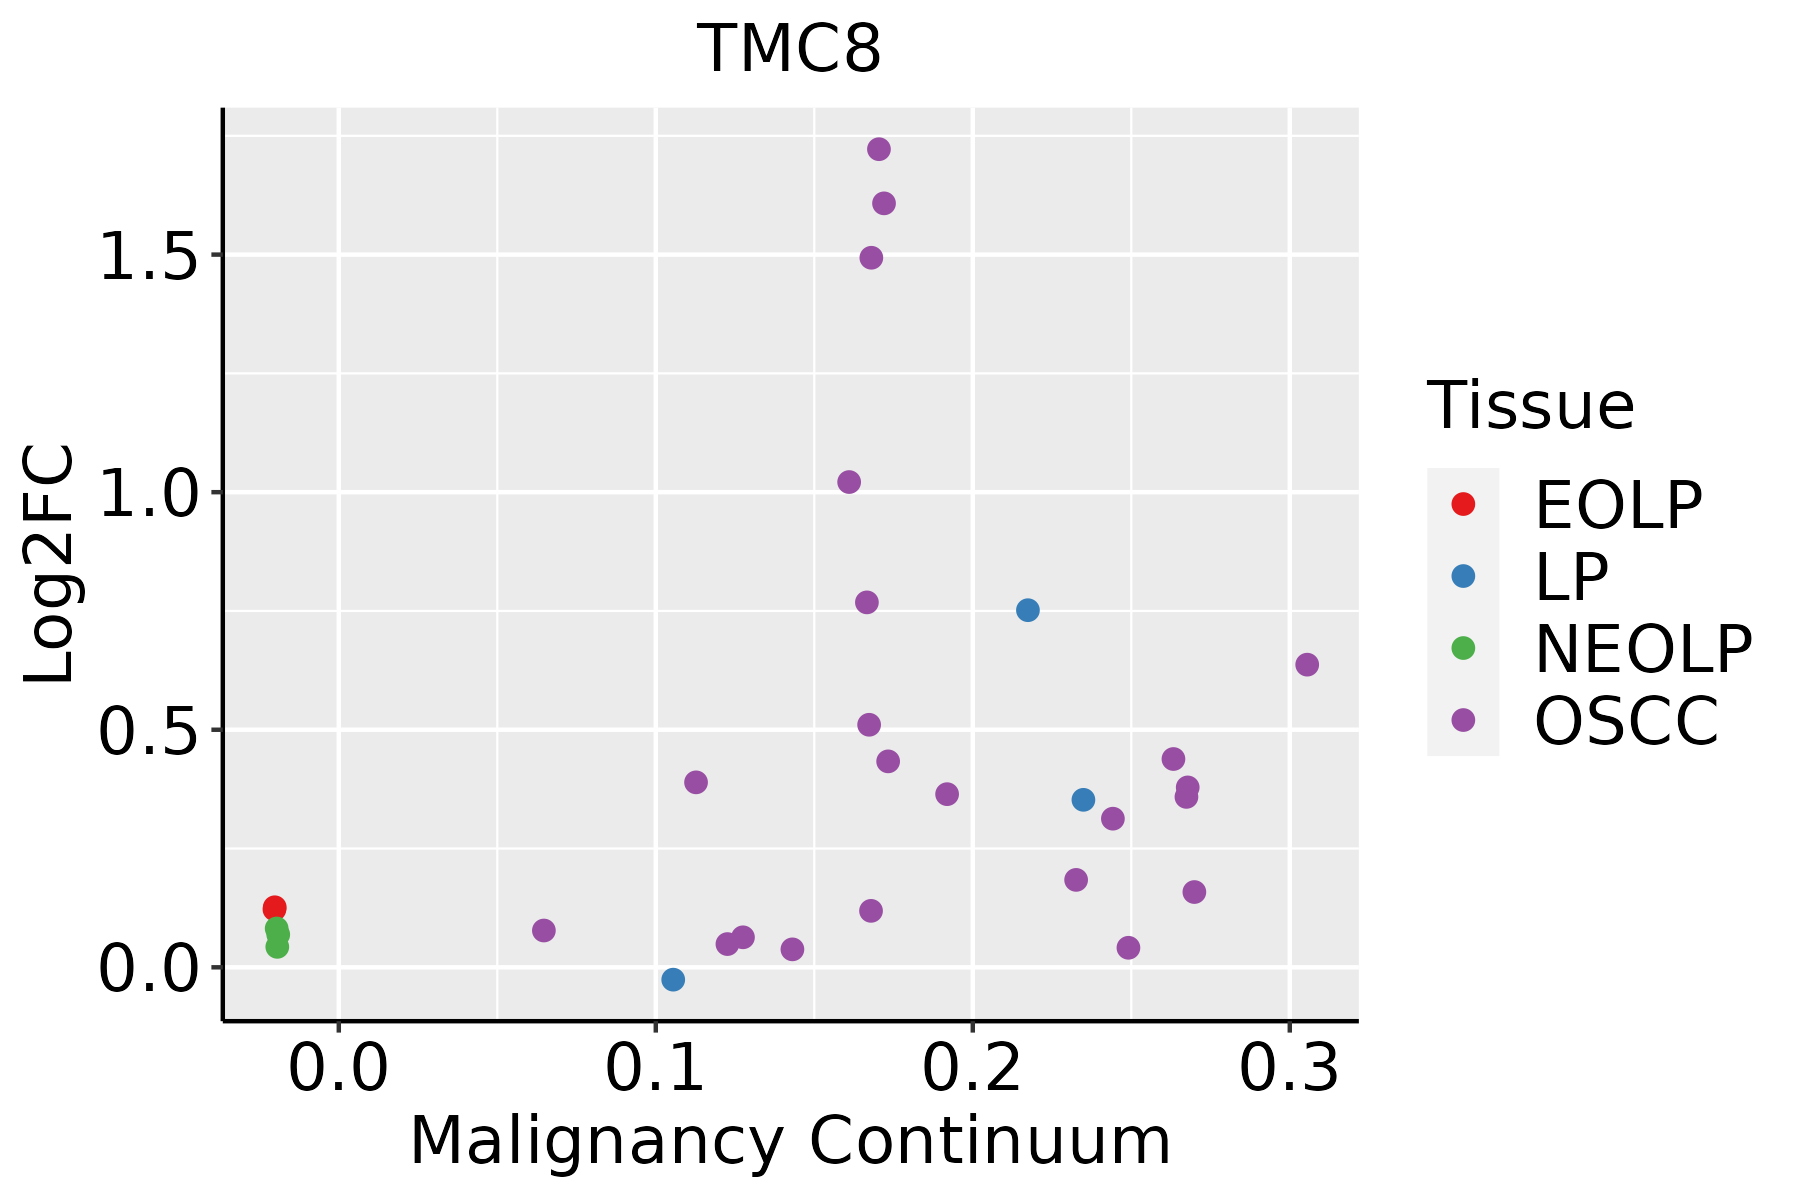 | EOLP: Erosive Oral lichen planus |
| LP: leukoplakia | ||
| NEOLP: Non-erosive oral lichen planus | ||
| OSCC: Oral squamous cell carcinoma |
| ∗log2FC in expression of this searched gene in stem-like cells from each diseased tissue sample relative to stem-like cells in normal samples in each tissue plotted against the malignancy continuum. Samples are colored based on if they are from different disease stage. |
Top |
Malignant transformation related pathway analysis |
| Find out the enriched GO biological processes and KEGG pathways involved in transition from healthy to precancer to cancer |
| Tissue | Disease Stage | Enriched GO biological Processes |
| Colorectum | AD |  |
| Colorectum | SER |  |
| Colorectum | MSS |  |
| Colorectum | MSI-H |  |
| Colorectum | FAP |  |
| ∗Top 15 enriched GO BP terms are showed in the bar plot of each disease state in each tissue. Each row represents a significant GO biological process which is colored according to the -log10(p.adjust). |
| Page: 1 2 3 4 5 6 7 8 9 |
| GO ID | Tissue | Disease Stage | Description | Gene Ratio | Bg Ratio | pvalue | p.adjust | Count |
| GO:2001233111 | Esophagus | ESCC | regulation of apoptotic signaling pathway | 256/8552 | 356/18723 | 4.11e-24 | 1.04e-21 | 256 |
| GO:0051098111 | Esophagus | ESCC | regulation of binding | 251/8552 | 363/18723 | 6.73e-20 | 8.46e-18 | 251 |
| GO:0043254111 | Esophagus | ESCC | regulation of protein-containing complex assembly | 278/8552 | 428/18723 | 3.81e-16 | 2.77e-14 | 278 |
| GO:0097191111 | Esophagus | ESCC | extrinsic apoptotic signaling pathway | 159/8552 | 219/18723 | 4.12e-16 | 2.94e-14 | 159 |
| GO:2001236111 | Esophagus | ESCC | regulation of extrinsic apoptotic signaling pathway | 111/8552 | 151/18723 | 2.97e-12 | 1.18e-10 | 111 |
| GO:004339320 | Esophagus | ESCC | regulation of protein binding | 135/8552 | 196/18723 | 3.69e-11 | 1.22e-09 | 135 |
| GO:0016049110 | Esophagus | ESCC | cell growth | 289/8552 | 482/18723 | 1.29e-10 | 3.77e-09 | 289 |
| GO:000155819 | Esophagus | ESCC | regulation of cell growth | 248/8552 | 414/18723 | 2.97e-09 | 6.45e-08 | 248 |
| GO:0051100111 | Esophagus | ESCC | negative regulation of binding | 109/8552 | 162/18723 | 2.10e-08 | 4.03e-07 | 109 |
| GO:000862519 | Esophagus | ESCC | extrinsic apoptotic signaling pathway via death domain receptors | 59/8552 | 82/18723 | 1.23e-06 | 1.52e-05 | 59 |
| GO:003209116 | Esophagus | ESCC | negative regulation of protein binding | 65/8552 | 94/18723 | 3.46e-06 | 3.82e-05 | 65 |
| GO:005507617 | Esophagus | ESCC | transition metal ion homeostasis | 87/8552 | 138/18723 | 2.85e-05 | 2.37e-04 | 87 |
| GO:0031333110 | Esophagus | ESCC | negative regulation of protein-containing complex assembly | 86/8552 | 141/18723 | 1.74e-04 | 1.14e-03 | 86 |
| GO:190204117 | Esophagus | ESCC | regulation of extrinsic apoptotic signaling pathway via death domain receptors | 35/8552 | 49/18723 | 2.32e-04 | 1.44e-03 | 35 |
| GO:200123320 | Oral cavity | OSCC | regulation of apoptotic signaling pathway | 242/7305 | 356/18723 | 6.66e-29 | 3.24e-26 | 242 |
| GO:004325420 | Oral cavity | OSCC | regulation of protein-containing complex assembly | 255/7305 | 428/18723 | 2.94e-18 | 3.15e-16 | 255 |
| GO:009719120 | Oral cavity | OSCC | extrinsic apoptotic signaling pathway | 142/7305 | 219/18723 | 7.34e-15 | 4.55e-13 | 142 |
| GO:005109820 | Oral cavity | OSCC | regulation of binding | 212/7305 | 363/18723 | 3.88e-14 | 2.15e-12 | 212 |
| GO:001604917 | Oral cavity | OSCC | cell growth | 268/7305 | 482/18723 | 6.55e-14 | 3.51e-12 | 268 |
| GO:200123620 | Oral cavity | OSCC | regulation of extrinsic apoptotic signaling pathway | 100/7305 | 151/18723 | 1.07e-11 | 3.90e-10 | 100 |
| Page: 1 2 3 |
| Pathway ID | Tissue | Disease Stage | Description | Gene Ratio | Bg Ratio | pvalue | p.adjust | qvalue | Count |
| Page: 1 |
Top |
Cell-cell communication analysis |
| Identification of potential cell-cell interactions between two cell types and their ligand-receptor pairs for different disease states |
| Ligand | Receptor | LRpair | Pathway | Tissue | Disease Stage |
| Page: 1 |
Top |
Single-cell gene regulatory network inference analysis |
| Find out the significant the regulons (TFs) and the target genes of each regulon across cell types for different disease states |
| TF | Cell Type | Tissue | Disease Stage | Target Gene | RSS | Regulon Activity |
| ∗The dot plots of a searched regulon are shown for all cell subpopulations in each disease state of each tissue based on the regulon specific score inferred using pySCENIC and by calculating the average expression. |
| Page: 1 |
Top |
Somatic mutation of malignant transformation related genes |
| Annotation of somatic variants for genes involved in malignant transformation |
| Hugo Symbol | Variant Class | Variant Classification | dbSNP RS | HGVSc | HGVSp | HGVSp Short | SWISSPROT | BIOTYPE | SIFT | PolyPhen | Tumor Sample Barcode | Tissue | Histology | Sex | Age | Stage | Therapy Types | Drugs | Outcome |
| TMC8 | SNV | Missense_Mutation | rs766694820 | c.569N>A | p.Arg190Gln | p.R190Q | Q8IU68 | protein_coding | tolerated(0.15) | benign(0.001) | TCGA-5L-AAT1-01 | Breast | breast invasive carcinoma | Female | <65 | III/IV | Hormone Therapy | letrozol | SD |
| TMC8 | SNV | Missense_Mutation | novel | c.1897N>C | p.Val633Leu | p.V633L | Q8IU68 | protein_coding | tolerated(0.1) | benign(0.001) | TCGA-AC-A5EH-01 | Breast | breast invasive carcinoma | Female | >=65 | I/II | Unknown | Unknown | SD |
| TMC8 | SNV | Missense_Mutation | c.406N>T | p.Val136Phe | p.V136F | Q8IU68 | protein_coding | deleterious(0.01) | benign(0.055) | TCGA-BH-A18G-01 | Breast | breast invasive carcinoma | Female | >=65 | I/II | Unknown | Unknown | SD | |
| TMC8 | SNV | Missense_Mutation | c.1204N>A | p.Asp402Asn | p.D402N | Q8IU68 | protein_coding | tolerated(0.95) | benign(0) | TCGA-BH-A1F8-01 | Breast | breast invasive carcinoma | Female | >=65 | III/IV | Unknown | Unknown | PD | |
| TMC8 | SNV | Missense_Mutation | rs61755873 | c.390N>G | p.Phe130Leu | p.F130L | Q8IU68 | protein_coding | tolerated(0.17) | benign(0.003) | TCGA-C8-A27A-01 | Breast | breast invasive carcinoma | Female | <65 | I/II | Chemotherapy | 5-fluorouracil | CR |
| TMC8 | SNV | Missense_Mutation | c.1565N>T | p.Ser522Leu | p.S522L | Q8IU68 | protein_coding | tolerated(0.17) | benign(0) | TCGA-2W-A8YY-01 | Cervix | cervical & endocervical cancer | Female | <65 | I/II | Chemotherapy | cisplatin | CR | |
| TMC8 | SNV | Missense_Mutation | c.306N>G | p.Phe102Leu | p.F102L | Q8IU68 | protein_coding | deleterious(0) | probably_damaging(0.956) | TCGA-UC-A7PF-01 | Cervix | cervical & endocervical cancer | Female | <65 | I/II | Unknown | Unknown | SD | |
| TMC8 | SNV | Missense_Mutation | c.942N>G | p.Ile314Met | p.I314M | Q8IU68 | protein_coding | deleterious(0.02) | possibly_damaging(0.896) | TCGA-UC-A7PF-01 | Cervix | cervical & endocervical cancer | Female | <65 | I/II | Unknown | Unknown | SD | |
| TMC8 | SNV | Missense_Mutation | rs369861947 | c.1886N>A | p.Arg629Gln | p.R629Q | Q8IU68 | protein_coding | deleterious(0.03) | possibly_damaging(0.838) | TCGA-AA-3492-01 | Colorectum | colon adenocarcinoma | Female | >=65 | I/II | Unknown | Unknown | SD |
| TMC8 | SNV | Missense_Mutation | c.925C>A | p.Leu309Met | p.L309M | Q8IU68 | protein_coding | deleterious(0.01) | probably_damaging(0.997) | TCGA-AA-3966-01 | Colorectum | colon adenocarcinoma | Female | >=65 | I/II | Unknown | Unknown | SD |
| Page: 1 2 3 4 |
Top |
Related drugs of malignant transformation related genes |
| Identification of chemicals and drugs interact with genes involved in malignant transfromation |
| (DGIdb 4.0) |
| Entrez ID | Symbol | Category | Interaction Types | Drug Claim Name | Drug Name | PMIDs |
| Page: 1 |

Copyright 2023-Present -The University of Texas Health Science Center at Houston |