
|
|||||
|
 | |
| |
| |
| |
| |
| |
|
Gene: TMC6 |
Gene summary for TMC6 |
| Gene information | Species | Human | Gene symbol | TMC6 | Gene ID | 11322 |
| Gene name | transmembrane channel like 6 | |
| Gene Alias | EV1 | |
| Cytomap | 17q25.3 | |
| Gene Type | protein-coding | GO ID | GO:0006810 | UniProtAcc | A0A024R8V2 |
Top |
Malignant transformation analysis |
| Identification of the aberrant gene expression in precancerous and cancerous lesions by comparing the gene expression of stem-like cells in diseased tissues with normal stem cells |
| Entrez ID | Symbol | Replicates | Species | Organ | Tissue | Adj P-value | Log2FC | Malignancy |
| 11322 | TMC6 | LZE4T | Human | Esophagus | ESCC | 2.93e-11 | 1.90e-01 | 0.0811 |
| 11322 | TMC6 | LZE5T | Human | Esophagus | ESCC | 1.04e-05 | 3.20e-01 | 0.0514 |
| 11322 | TMC6 | LZE7T | Human | Esophagus | ESCC | 3.55e-13 | 4.78e-01 | 0.0667 |
| 11322 | TMC6 | LZE8T | Human | Esophagus | ESCC | 5.57e-10 | 3.14e-01 | 0.067 |
| 11322 | TMC6 | LZE20T | Human | Esophagus | ESCC | 4.22e-04 | 2.08e-01 | 0.0662 |
| 11322 | TMC6 | LZE21D1 | Human | Esophagus | HGIN | 6.35e-03 | 2.88e-01 | 0.0632 |
| 11322 | TMC6 | LZE22D1 | Human | Esophagus | HGIN | 1.92e-04 | 1.95e-01 | 0.0595 |
| 11322 | TMC6 | LZE24T | Human | Esophagus | ESCC | 3.80e-20 | 2.81e-01 | 0.0596 |
| 11322 | TMC6 | LZE21T | Human | Esophagus | ESCC | 7.35e-10 | 3.66e-01 | 0.0655 |
| 11322 | TMC6 | LZE6T | Human | Esophagus | ESCC | 2.44e-06 | 2.83e-01 | 0.0845 |
| 11322 | TMC6 | P1T-E | Human | Esophagus | ESCC | 2.73e-12 | 4.83e-01 | 0.0875 |
| 11322 | TMC6 | P2T-E | Human | Esophagus | ESCC | 4.44e-08 | 1.64e-01 | 0.1177 |
| 11322 | TMC6 | P4T-E | Human | Esophagus | ESCC | 1.40e-16 | 2.24e-01 | 0.1323 |
| 11322 | TMC6 | P5T-E | Human | Esophagus | ESCC | 4.31e-06 | 1.20e-01 | 0.1327 |
| 11322 | TMC6 | P8T-E | Human | Esophagus | ESCC | 5.17e-27 | 4.65e-01 | 0.0889 |
| 11322 | TMC6 | P9T-E | Human | Esophagus | ESCC | 2.87e-20 | 2.23e-01 | 0.1131 |
| 11322 | TMC6 | P10T-E | Human | Esophagus | ESCC | 4.30e-10 | 1.49e-01 | 0.116 |
| 11322 | TMC6 | P11T-E | Human | Esophagus | ESCC | 1.23e-16 | 8.87e-01 | 0.1426 |
| 11322 | TMC6 | P12T-E | Human | Esophagus | ESCC | 1.02e-31 | 5.05e-01 | 0.1122 |
| 11322 | TMC6 | P15T-E | Human | Esophagus | ESCC | 2.25e-29 | 5.40e-01 | 0.1149 |
| Page: 1 2 3 4 5 6 |
| Tissue | Expression Dynamics | Abbreviation |
| Esophagus | 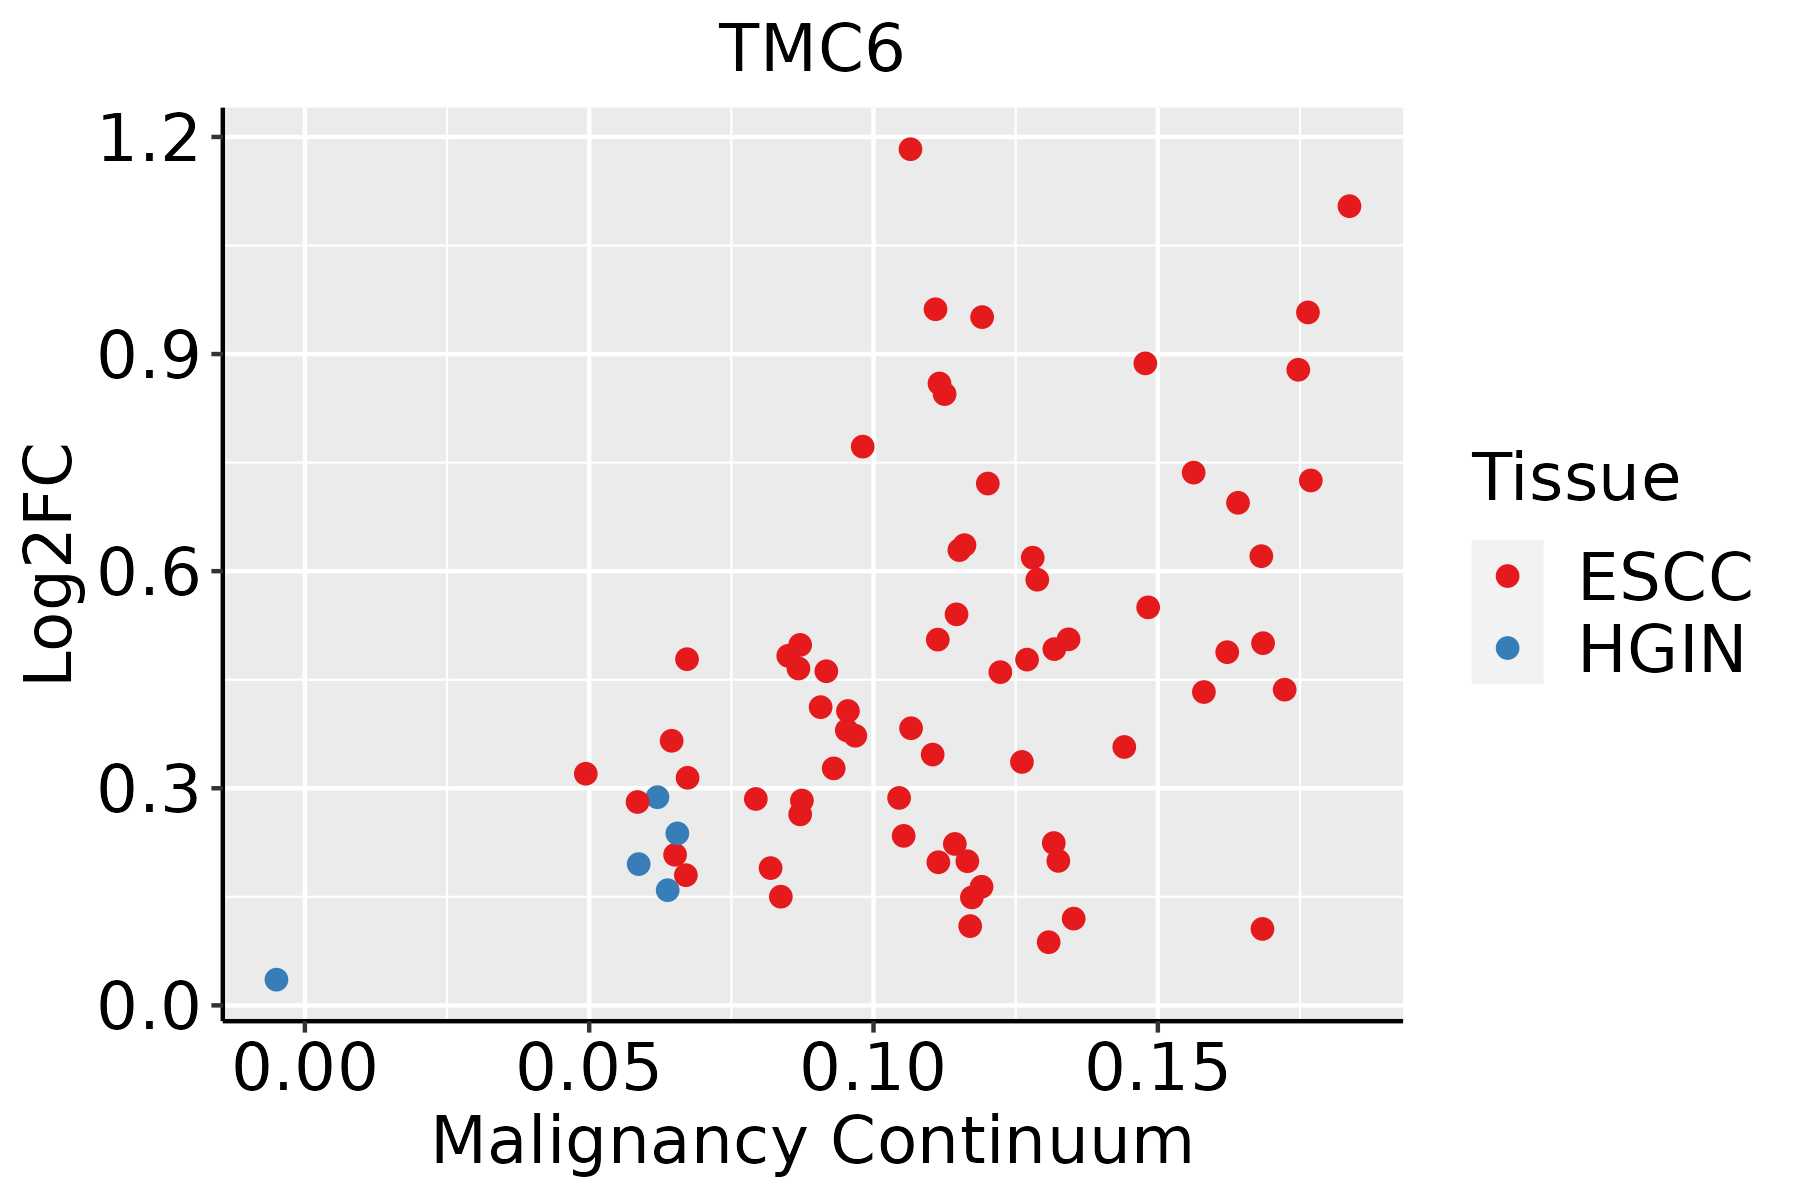 | ESCC: Esophageal squamous cell carcinoma |
| HGIN: High-grade intraepithelial neoplasias | ||
| LGIN: Low-grade intraepithelial neoplasias | ||
| Liver | 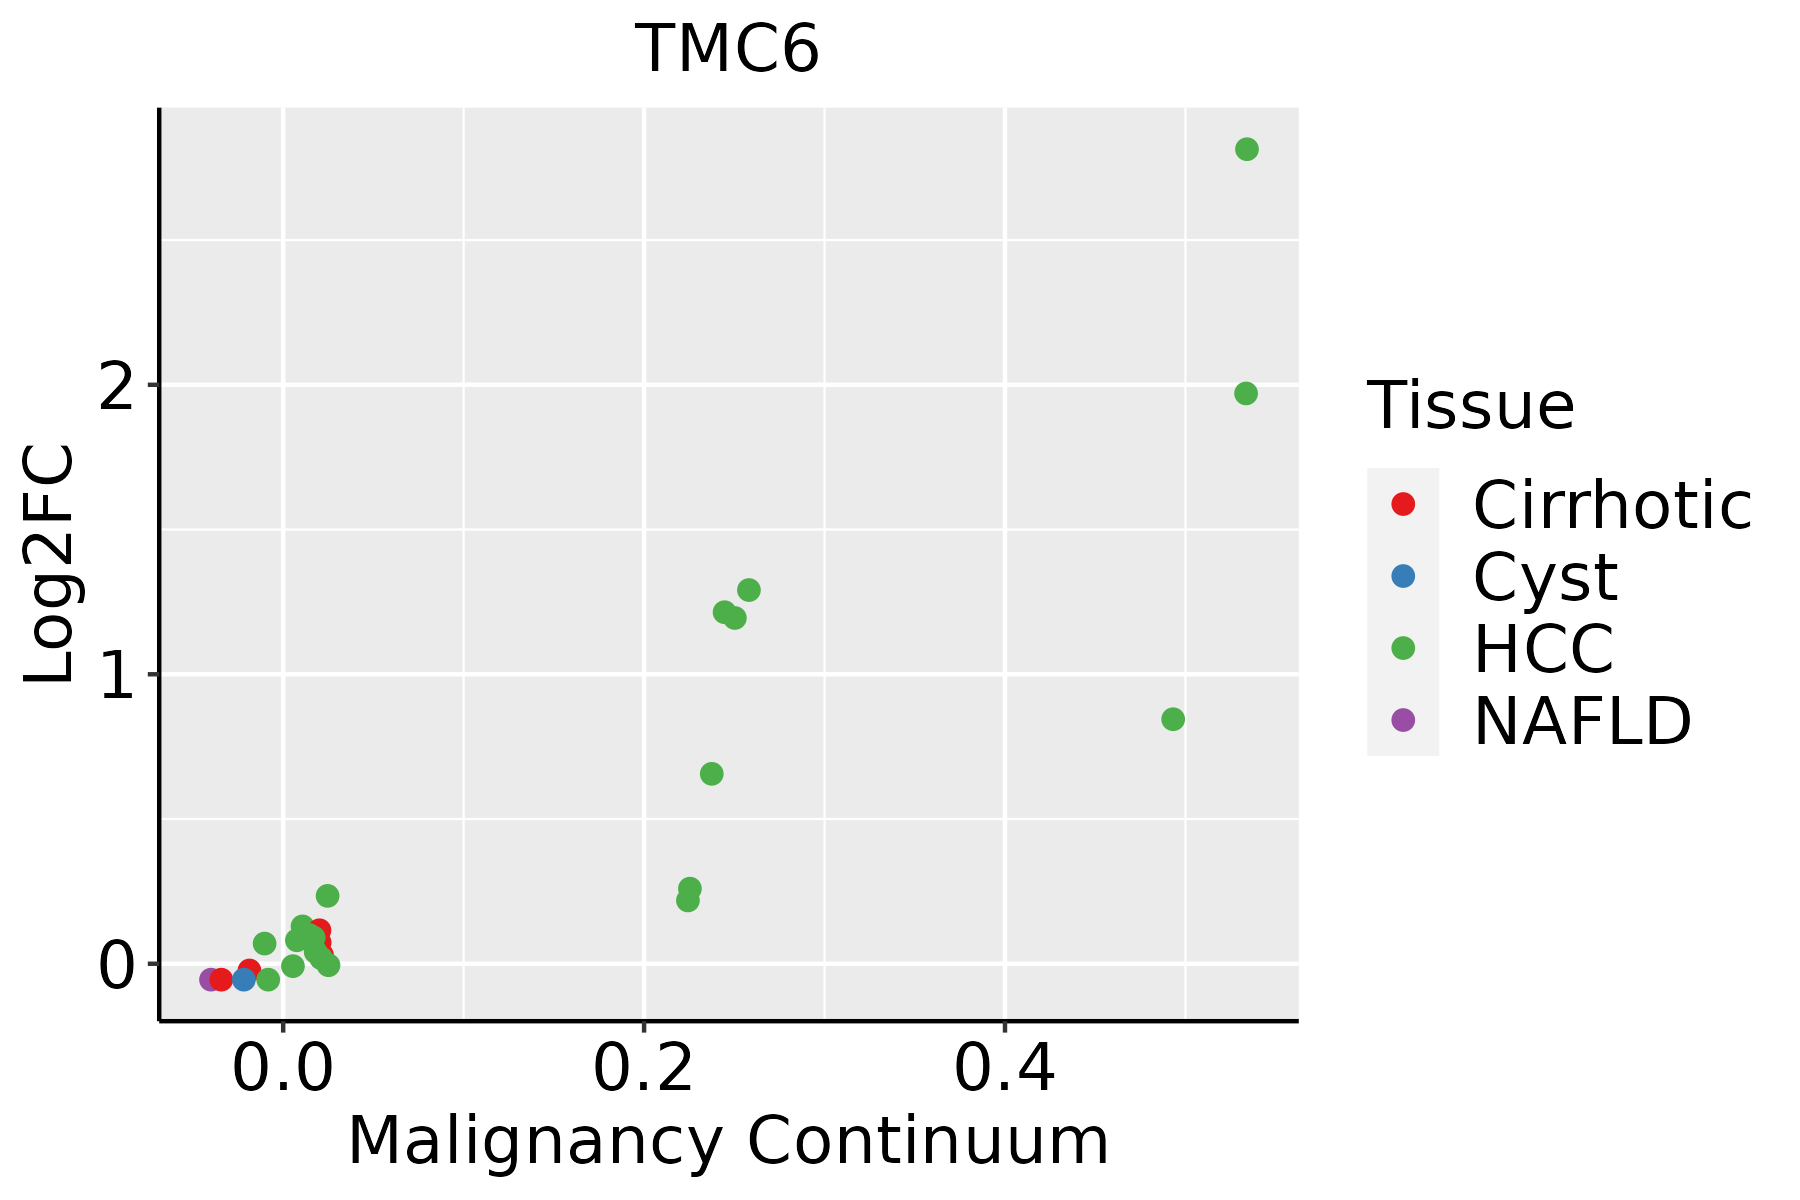 | HCC: Hepatocellular carcinoma |
| NAFLD: Non-alcoholic fatty liver disease | ||
| Oral Cavity | 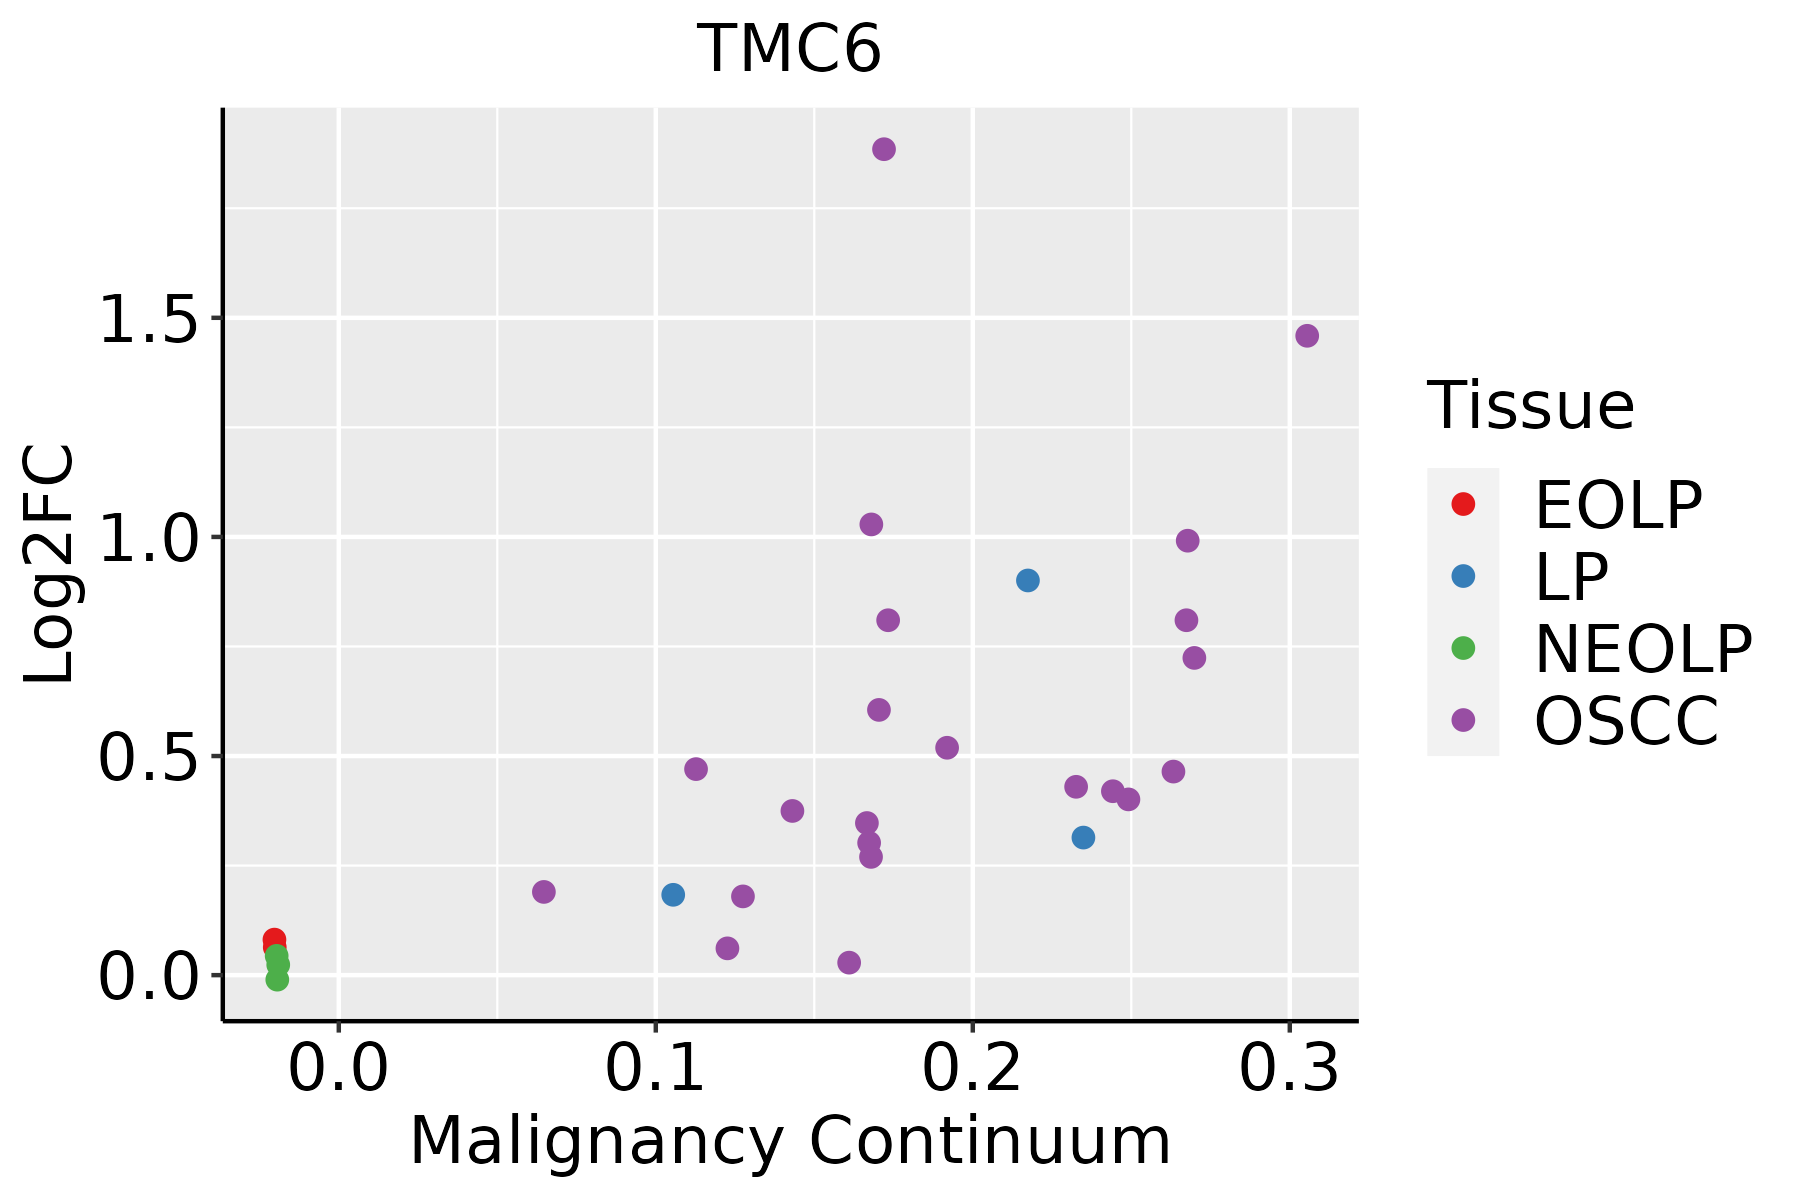 | EOLP: Erosive Oral lichen planus |
| LP: leukoplakia | ||
| NEOLP: Non-erosive oral lichen planus | ||
| OSCC: Oral squamous cell carcinoma | ||
| Skin | 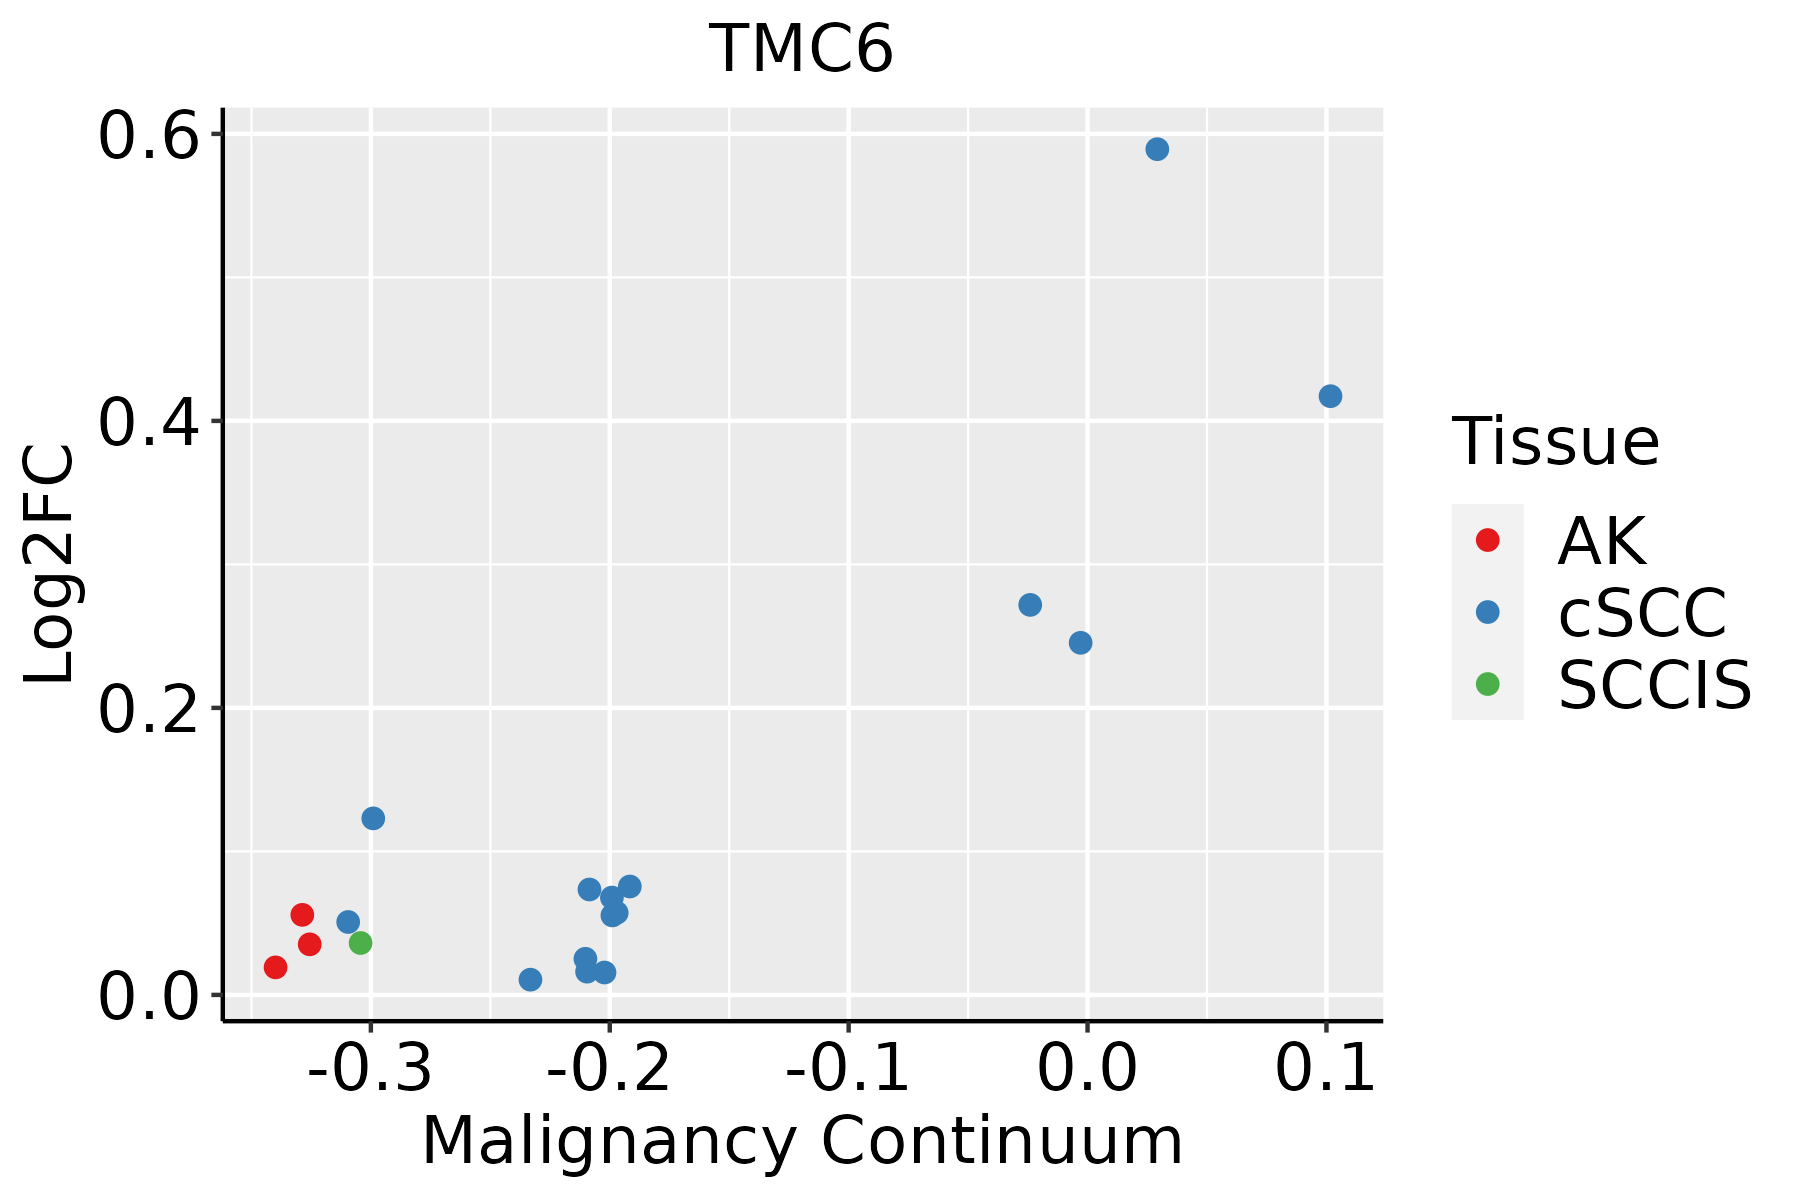 | AK: Actinic keratosis |
| cSCC: Cutaneous squamous cell carcinoma | ||
| SCCIS:squamous cell carcinoma in situ | ||
| Thyroid | 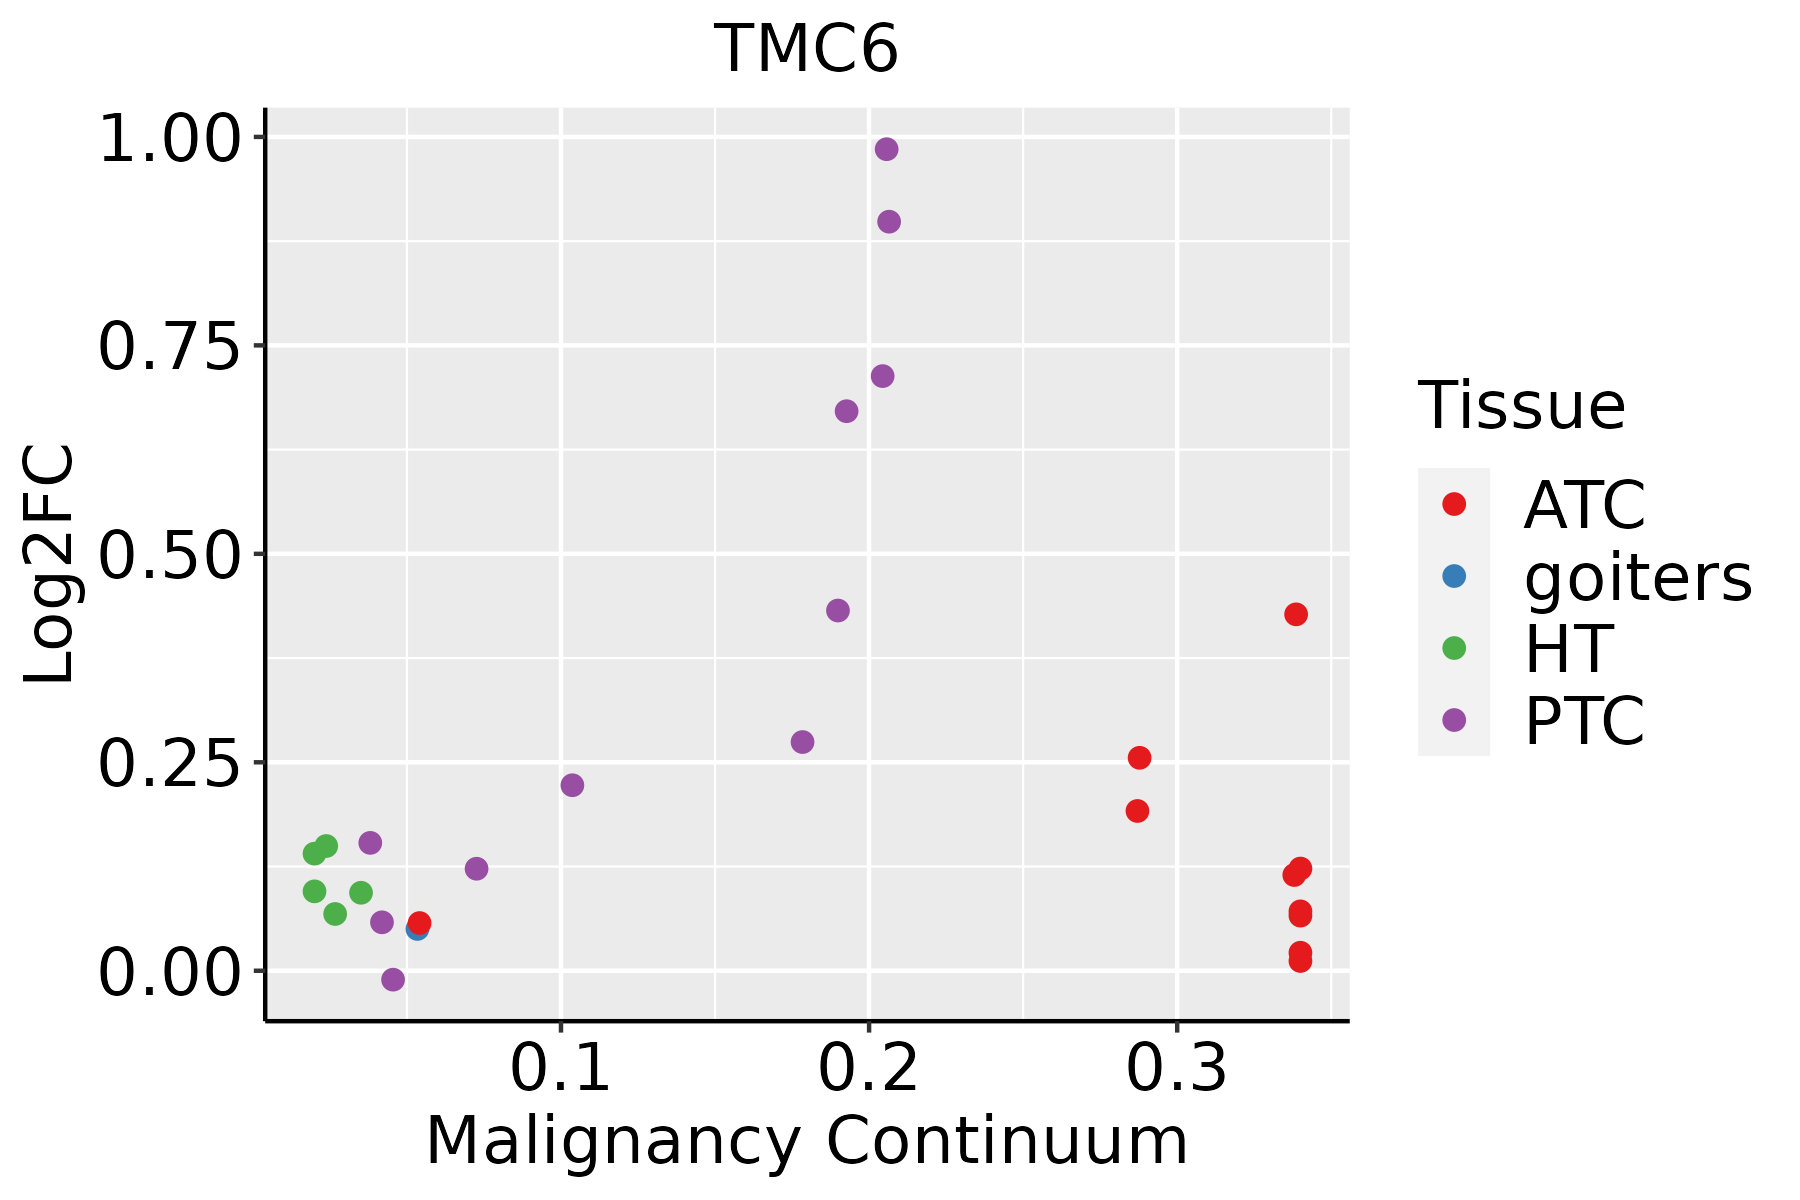 | ATC: Anaplastic thyroid cancer |
| HT: Hashimoto's thyroiditis | ||
| PTC: Papillary thyroid cancer |
| ∗log2FC in expression of this searched gene in stem-like cells from each diseased tissue sample relative to stem-like cells in normal samples in each tissue plotted against the malignancy continuum. Samples are colored based on if they are from different disease stage. |
Top |
Malignant transformation related pathway analysis |
| Find out the enriched GO biological processes and KEGG pathways involved in transition from healthy to precancer to cancer |
| Tissue | Disease Stage | Enriched GO biological Processes |
| Colorectum | AD |  |
| Colorectum | SER |  |
| Colorectum | MSS |  |
| Colorectum | MSI-H |  |
| Colorectum | FAP |  |
| ∗Top 15 enriched GO BP terms are showed in the bar plot of each disease state in each tissue. Each row represents a significant GO biological process which is colored according to the -log10(p.adjust). |
| Page: 1 2 3 4 5 6 7 8 9 |
| GO ID | Tissue | Disease Stage | Description | Gene Ratio | Bg Ratio | pvalue | p.adjust | Count |
| Page: 1 |
| Pathway ID | Tissue | Disease Stage | Description | Gene Ratio | Bg Ratio | pvalue | p.adjust | qvalue | Count |
| Page: 1 |
Top |
Cell-cell communication analysis |
| Identification of potential cell-cell interactions between two cell types and their ligand-receptor pairs for different disease states |
| Ligand | Receptor | LRpair | Pathway | Tissue | Disease Stage |
| Page: 1 |
Top |
Single-cell gene regulatory network inference analysis |
| Find out the significant the regulons (TFs) and the target genes of each regulon across cell types for different disease states |
| TF | Cell Type | Tissue | Disease Stage | Target Gene | RSS | Regulon Activity |
| ∗The dot plots of a searched regulon are shown for all cell subpopulations in each disease state of each tissue based on the regulon specific score inferred using pySCENIC and by calculating the average expression. |
| Page: 1 |
Top |
Somatic mutation of malignant transformation related genes |
| Annotation of somatic variants for genes involved in malignant transformation |
| Hugo Symbol | Variant Class | Variant Classification | dbSNP RS | HGVSc | HGVSp | HGVSp Short | SWISSPROT | BIOTYPE | SIFT | PolyPhen | Tumor Sample Barcode | Tissue | Histology | Sex | Age | Stage | Therapy Types | Drugs | Outcome |
| TMC6 | SNV | Missense_Mutation | rs185225783 | c.712N>A | p.Gly238Arg | p.G238R | Q7Z403 | protein_coding | deleterious(0) | possibly_damaging(0.552) | TCGA-B6-A400-01 | Breast | breast invasive carcinoma | Female | <65 | III/IV | Unknown | Unknown | SD |
| TMC6 | deletion | In_Frame_Del | c.384_398delNNNNNNNNNNNNNNN | p.Arg129_Leu133del | p.R129_L133del | Q7Z403 | protein_coding | TCGA-AR-A256-01 | Breast | breast invasive carcinoma | Female | <65 | I/II | Chemotherapy | doxorubicin | PD | |||
| TMC6 | SNV | Missense_Mutation | rs750556964 | c.1333N>A | p.Ala445Thr | p.A445T | Q7Z403 | protein_coding | tolerated(0.7) | benign(0.003) | TCGA-2W-A8YY-01 | Cervix | cervical & endocervical cancer | Female | <65 | I/II | Chemotherapy | cisplatin | CR |
| TMC6 | SNV | Missense_Mutation | novel | c.272G>T | p.Gly91Val | p.G91V | Q7Z403 | protein_coding | deleterious(0) | possibly_damaging(0.826) | TCGA-C5-A2M1-01 | Cervix | cervical & endocervical cancer | Female | <65 | I/II | Unknown | Unknown | SD |
| TMC6 | SNV | Missense_Mutation | c.1380N>G | p.Ile460Met | p.I460M | Q7Z403 | protein_coding | tolerated(0.23) | benign(0.396) | TCGA-Q1-A73O-01 | Cervix | cervical & endocervical cancer | Female | <65 | I/II | Chemotherapy | cisplatin | CR | |
| TMC6 | SNV | Missense_Mutation | novel | c.2149T>C | p.Tyr717His | p.Y717H | Q7Z403 | protein_coding | tolerated(0.53) | benign(0.003) | TCGA-A6-6780-01 | Colorectum | colon adenocarcinoma | Male | >=65 | I/II | Unknown | Unknown | SD |
| TMC6 | SNV | Missense_Mutation | rs746180217 | c.1951G>A | p.Val651Ile | p.V651I | Q7Z403 | protein_coding | tolerated(0.43) | benign(0.009) | TCGA-AU-6004-01 | Colorectum | colon adenocarcinoma | Female | >=65 | I/II | Unknown | Unknown | SD |
| TMC6 | SNV | Missense_Mutation | rs774998109 | c.2108N>T | p.Ala703Val | p.A703V | Q7Z403 | protein_coding | deleterious(0.04) | benign(0.012) | TCGA-CM-6674-01 | Colorectum | colon adenocarcinoma | Male | <65 | I/II | Unknown | Unknown | SD |
| TMC6 | SNV | Missense_Mutation | rs148239603 | c.1916N>T | p.Pro639Leu | p.P639L | Q7Z403 | protein_coding | deleterious(0) | probably_damaging(0.986) | TCGA-D5-6927-01 | Colorectum | colon adenocarcinoma | Male | <65 | I/II | Unknown | Unknown | SD |
| TMC6 | SNV | Missense_Mutation | rs551782028 | c.1192C>T | p.Arg398Cys | p.R398C | Q7Z403 | protein_coding | deleterious(0) | possibly_damaging(0.786) | TCGA-D5-6930-01 | Colorectum | colon adenocarcinoma | Male | >=65 | I/II | Unknown | Unknown | SD |
| Page: 1 2 3 4 5 6 7 |
Top |
Related drugs of malignant transformation related genes |
| Identification of chemicals and drugs interact with genes involved in malignant transfromation |
| (DGIdb 4.0) |
| Entrez ID | Symbol | Category | Interaction Types | Drug Claim Name | Drug Name | PMIDs |
| Page: 1 |

Copyright 2023-Present -The University of Texas Health Science Center at Houston |