
|
|||||
|
 | |
| |
| |
| |
| |
| |
|
Gene: TMC5 |
Gene summary for TMC5 |
| Gene information | Species | Human | Gene symbol | TMC5 | Gene ID | 79838 |
| Gene name | transmembrane channel like 5 | |
| Gene Alias | TMC5 | |
| Cytomap | 16p12.3 | |
| Gene Type | protein-coding | GO ID | GO:0006810 | UniProtAcc | Q6UXY8 |
Top |
Malignant transformation analysis |
| Identification of the aberrant gene expression in precancerous and cancerous lesions by comparing the gene expression of stem-like cells in diseased tissues with normal stem cells |
| Entrez ID | Symbol | Replicates | Species | Organ | Tissue | Adj P-value | Log2FC | Malignancy |
| 79838 | TMC5 | GSM4909281 | Human | Breast | IDC | 5.53e-10 | -2.50e-01 | 0.21 |
| 79838 | TMC5 | GSM4909282 | Human | Breast | IDC | 1.34e-09 | -2.50e-01 | -0.0288 |
| 79838 | TMC5 | GSM4909285 | Human | Breast | IDC | 6.74e-13 | -2.52e-01 | 0.21 |
| 79838 | TMC5 | GSM4909286 | Human | Breast | IDC | 3.30e-12 | -2.55e-01 | 0.1081 |
| 79838 | TMC5 | GSM4909287 | Human | Breast | IDC | 1.16e-08 | -2.52e-01 | 0.2057 |
| 79838 | TMC5 | GSM4909293 | Human | Breast | IDC | 1.82e-07 | 3.65e-01 | 0.1581 |
| 79838 | TMC5 | GSM4909295 | Human | Breast | IDC | 4.72e-02 | -2.46e-01 | 0.0898 |
| 79838 | TMC5 | GSM4909296 | Human | Breast | IDC | 4.23e-05 | -2.09e-01 | 0.1524 |
| 79838 | TMC5 | GSM4909297 | Human | Breast | IDC | 6.72e-04 | 1.38e-01 | 0.1517 |
| 79838 | TMC5 | GSM4909302 | Human | Breast | IDC | 5.28e-17 | 6.17e-01 | 0.1545 |
| 79838 | TMC5 | GSM4909311 | Human | Breast | IDC | 3.10e-09 | -1.69e-01 | 0.1534 |
| 79838 | TMC5 | GSM4909315 | Human | Breast | IDC | 1.49e-12 | -2.55e-01 | 0.21 |
| 79838 | TMC5 | GSM4909319 | Human | Breast | IDC | 1.41e-12 | -2.13e-01 | 0.1563 |
| 79838 | TMC5 | GSM4909320 | Human | Breast | IDC | 2.44e-02 | -1.41e-01 | 0.1575 |
| 79838 | TMC5 | GSM4909321 | Human | Breast | IDC | 1.99e-05 | -1.96e-01 | 0.1559 |
| 79838 | TMC5 | brca2 | Human | Breast | Precancer | 1.65e-06 | 4.77e-01 | -0.024 |
| 79838 | TMC5 | brca3 | Human | Breast | Precancer | 3.38e-12 | 4.55e-01 | -0.0263 |
| 79838 | TMC5 | M1 | Human | Breast | IDC | 4.32e-03 | -2.43e-01 | 0.1577 |
| 79838 | TMC5 | NCCBC5 | Human | Breast | DCIS | 3.53e-03 | -2.06e-01 | 0.2046 |
| 79838 | TMC5 | P1 | Human | Breast | IDC | 1.36e-06 | -2.40e-01 | 0.1527 |
| Page: 1 2 3 4 5 6 7 8 |
| Tissue | Expression Dynamics | Abbreviation |
| Breast |  | IDC: Invasive ductal carcinoma |
| DCIS: Ductal carcinoma in situ | ||
| Precancer(BRCA1-mut): Precancerous lesion from BRCA1 mutation carriers | ||
| Cervix |  | CC: Cervix cancer |
| HSIL_HPV: HPV-infected high-grade squamous intraepithelial lesions | ||
| N_HPV: HPV-infected normal cervix | ||
| Colorectum (GSE201348) |  | FAP: Familial adenomatous polyposis |
| CRC: Colorectal cancer | ||
| Colorectum (HTA11) | 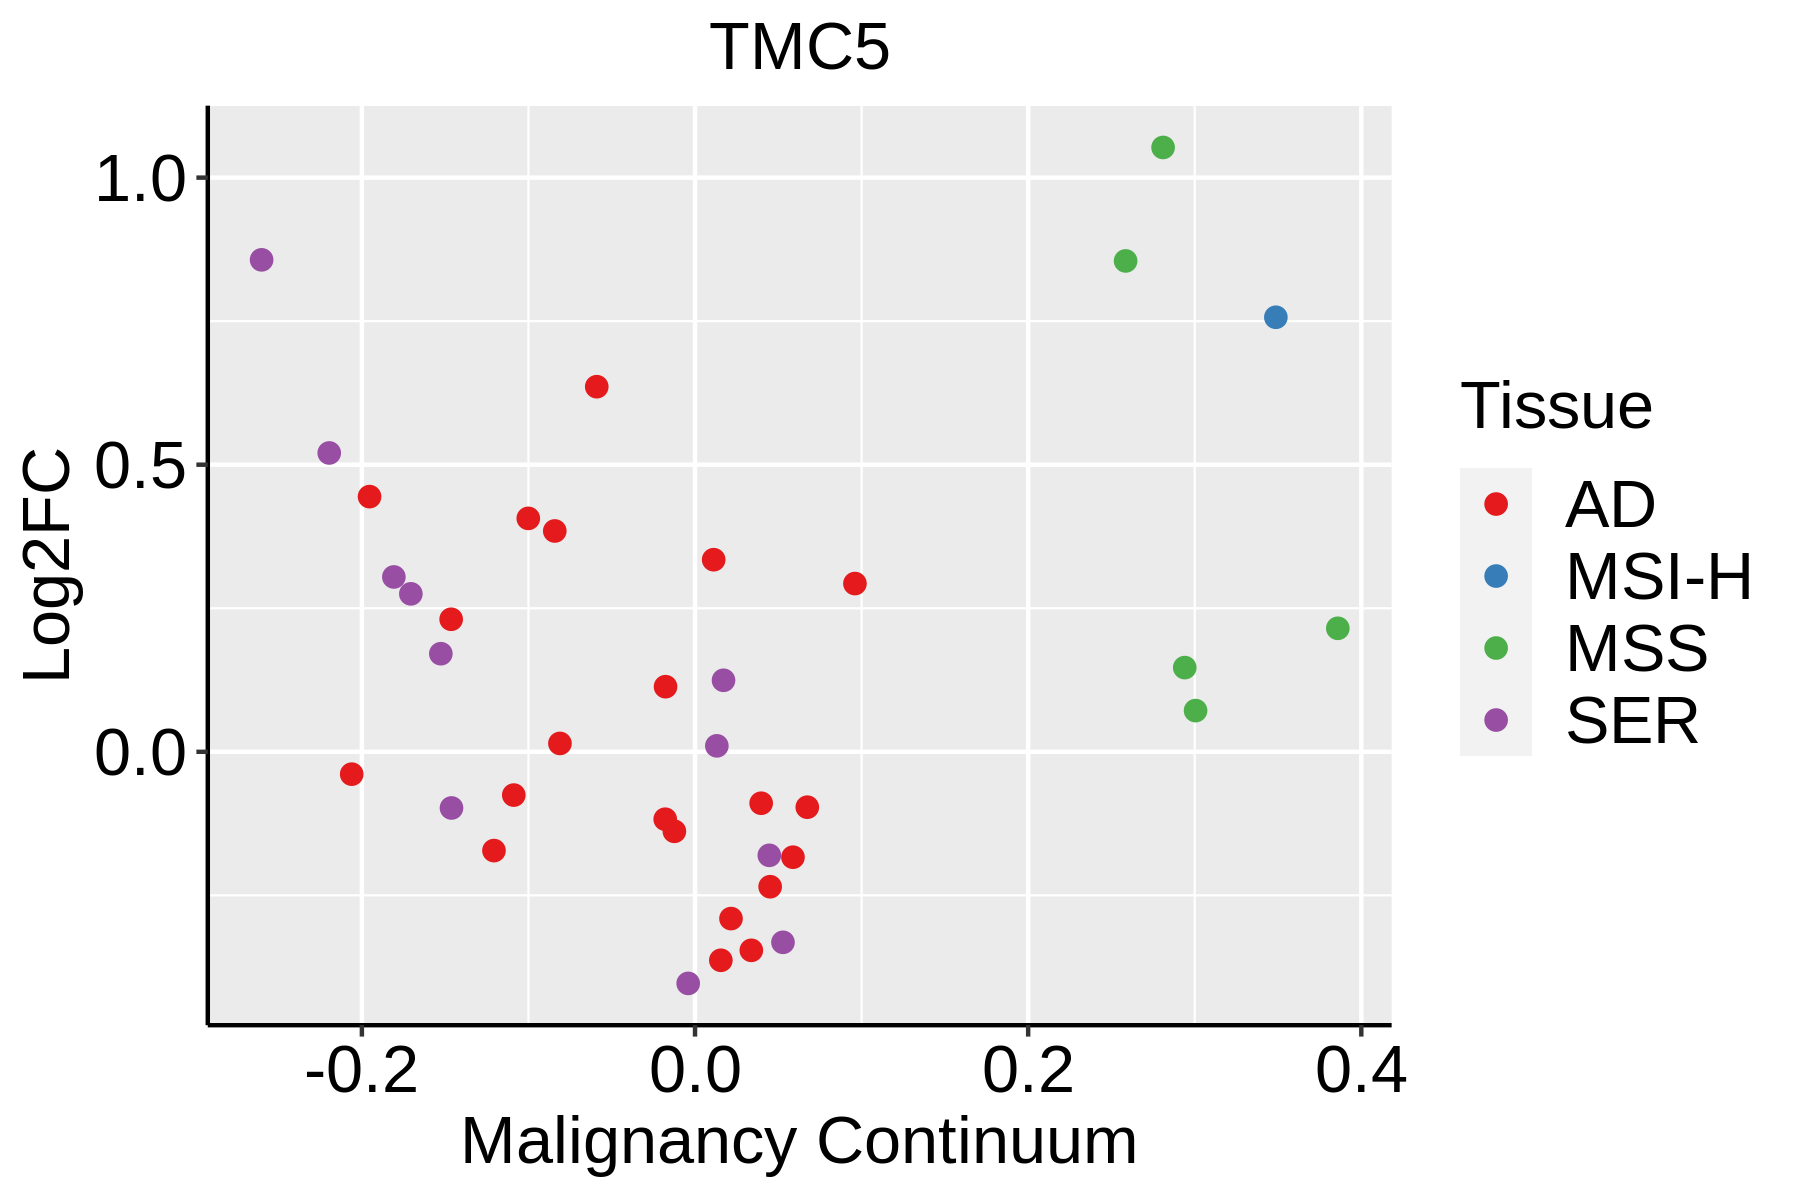 | AD: Adenomas |
| SER: Sessile serrated lesions | ||
| MSI-H: Microsatellite-high colorectal cancer | ||
| MSS: Microsatellite stable colorectal cancer | ||
| Endometrium | 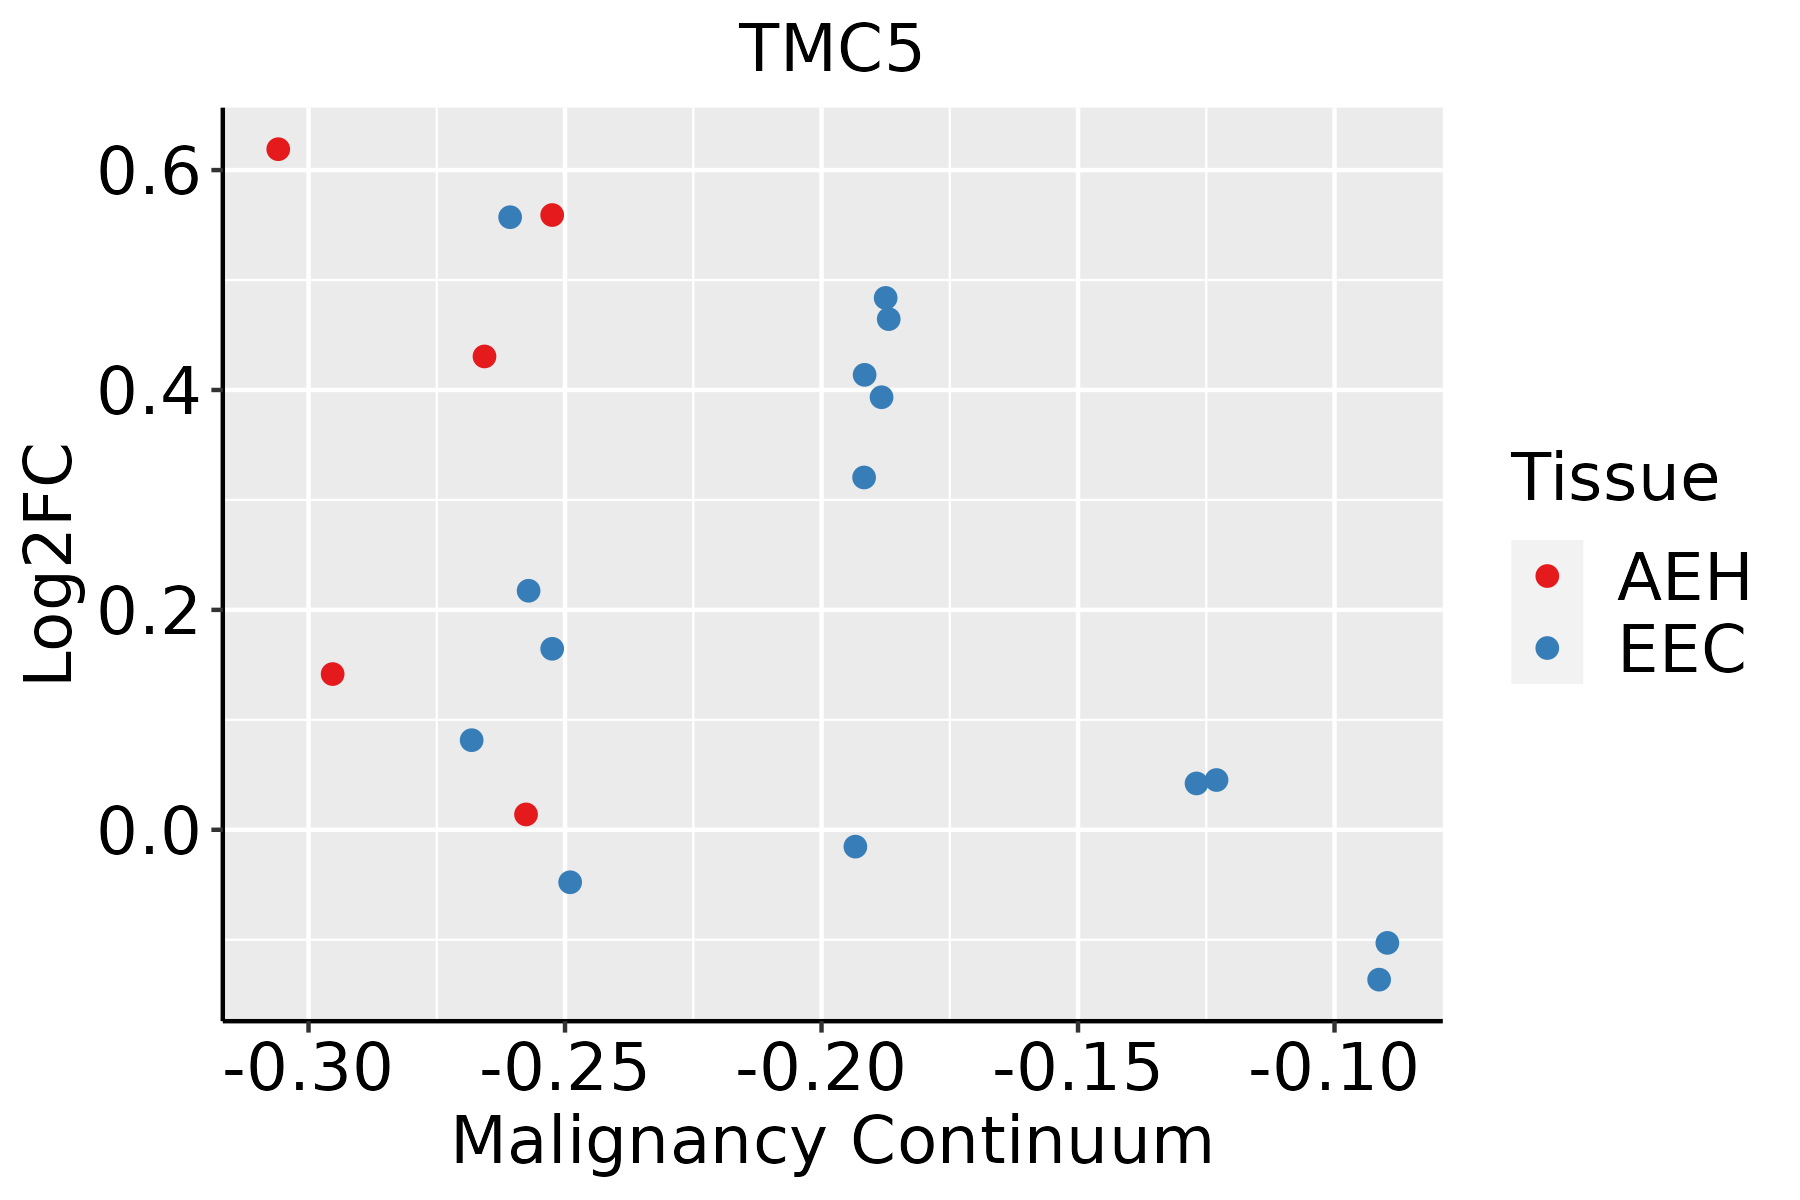 | AEH: Atypical endometrial hyperplasia |
| EEC: Endometrioid Cancer | ||
| Esophagus |  | ESCC: Esophageal squamous cell carcinoma |
| HGIN: High-grade intraepithelial neoplasias | ||
| LGIN: Low-grade intraepithelial neoplasias | ||
| GC | 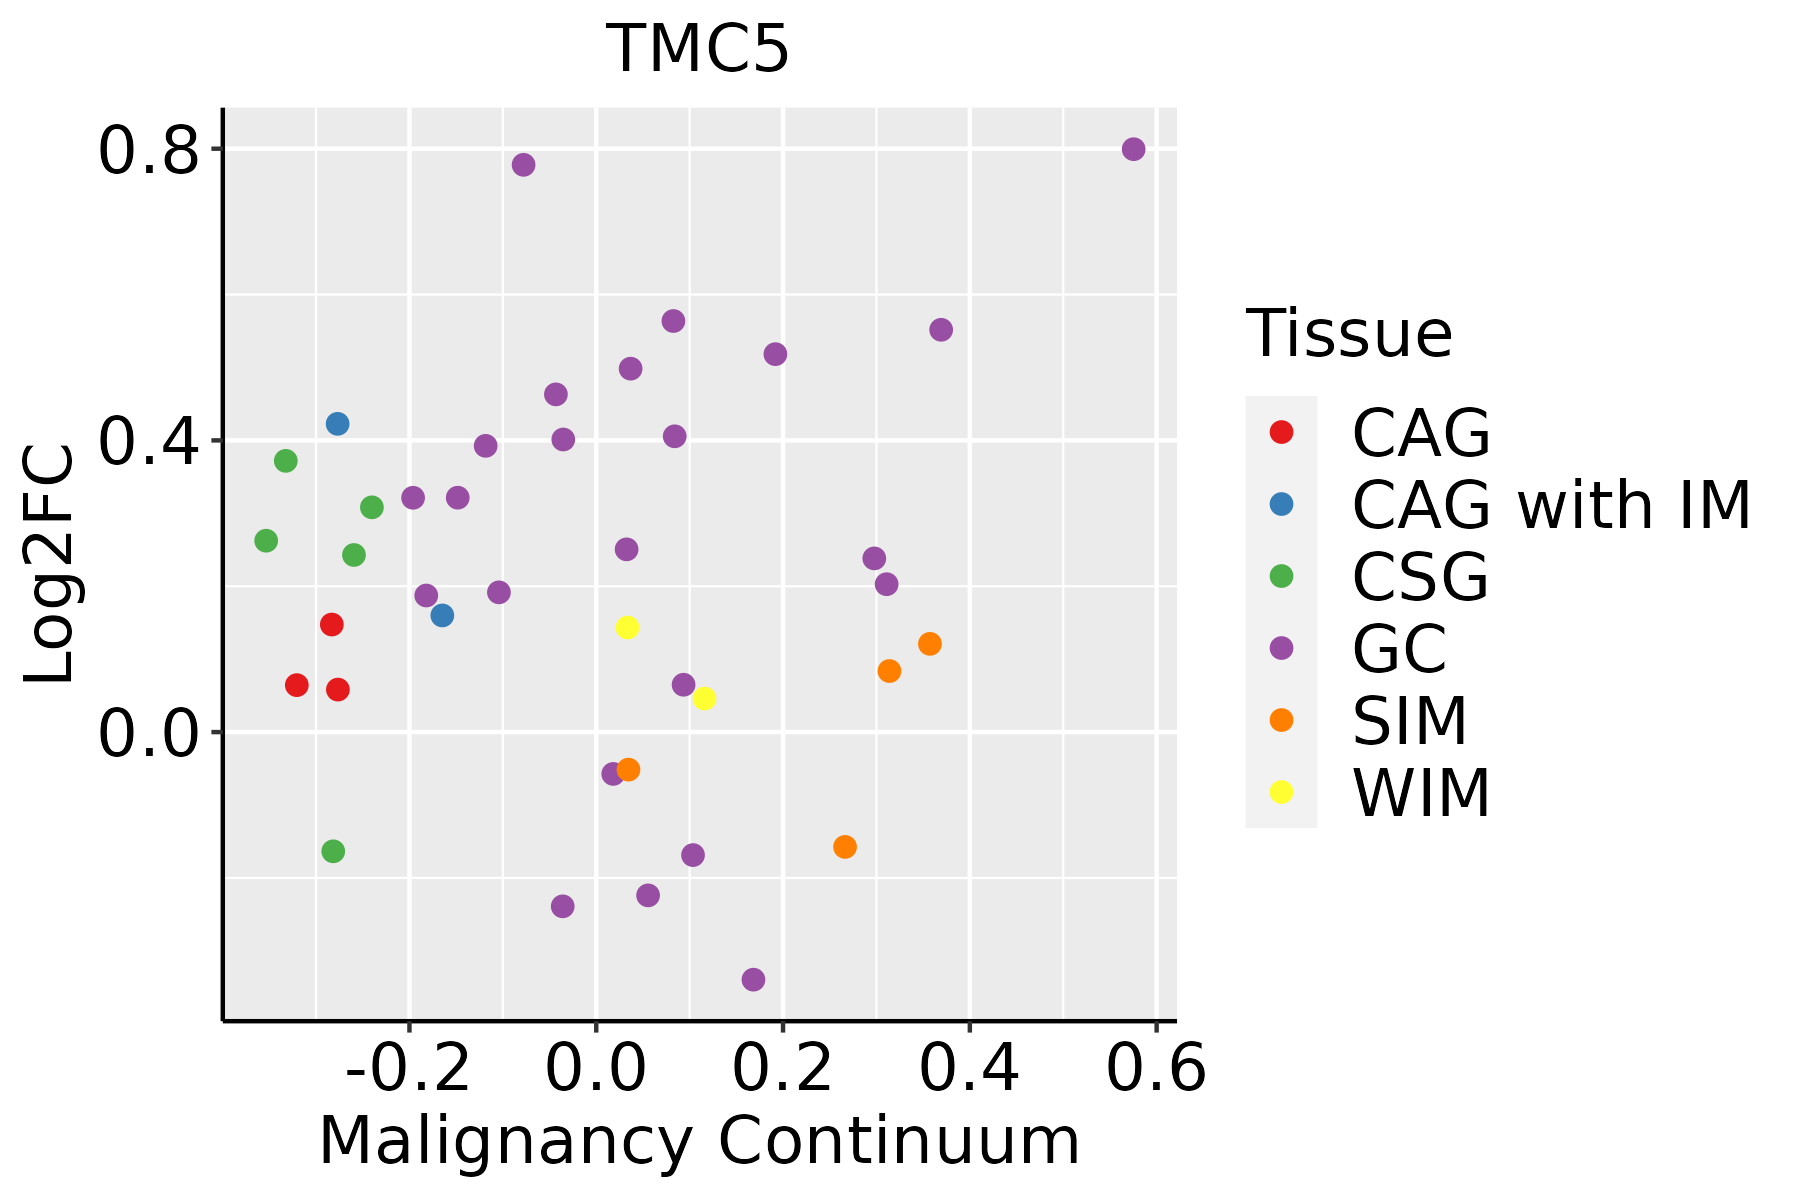 | CAG: Chronic atrophic gastritis |
| CAG with IM: Chronic atrophic gastritis with intestinal metaplasia | ||
| CSG: Chronic superficial gastritis | ||
| GC: Gastric cancer | ||
| SIM: Severe intestinal metaplasia | ||
| WIM: Wild intestinal metaplasia | ||
| Liver | 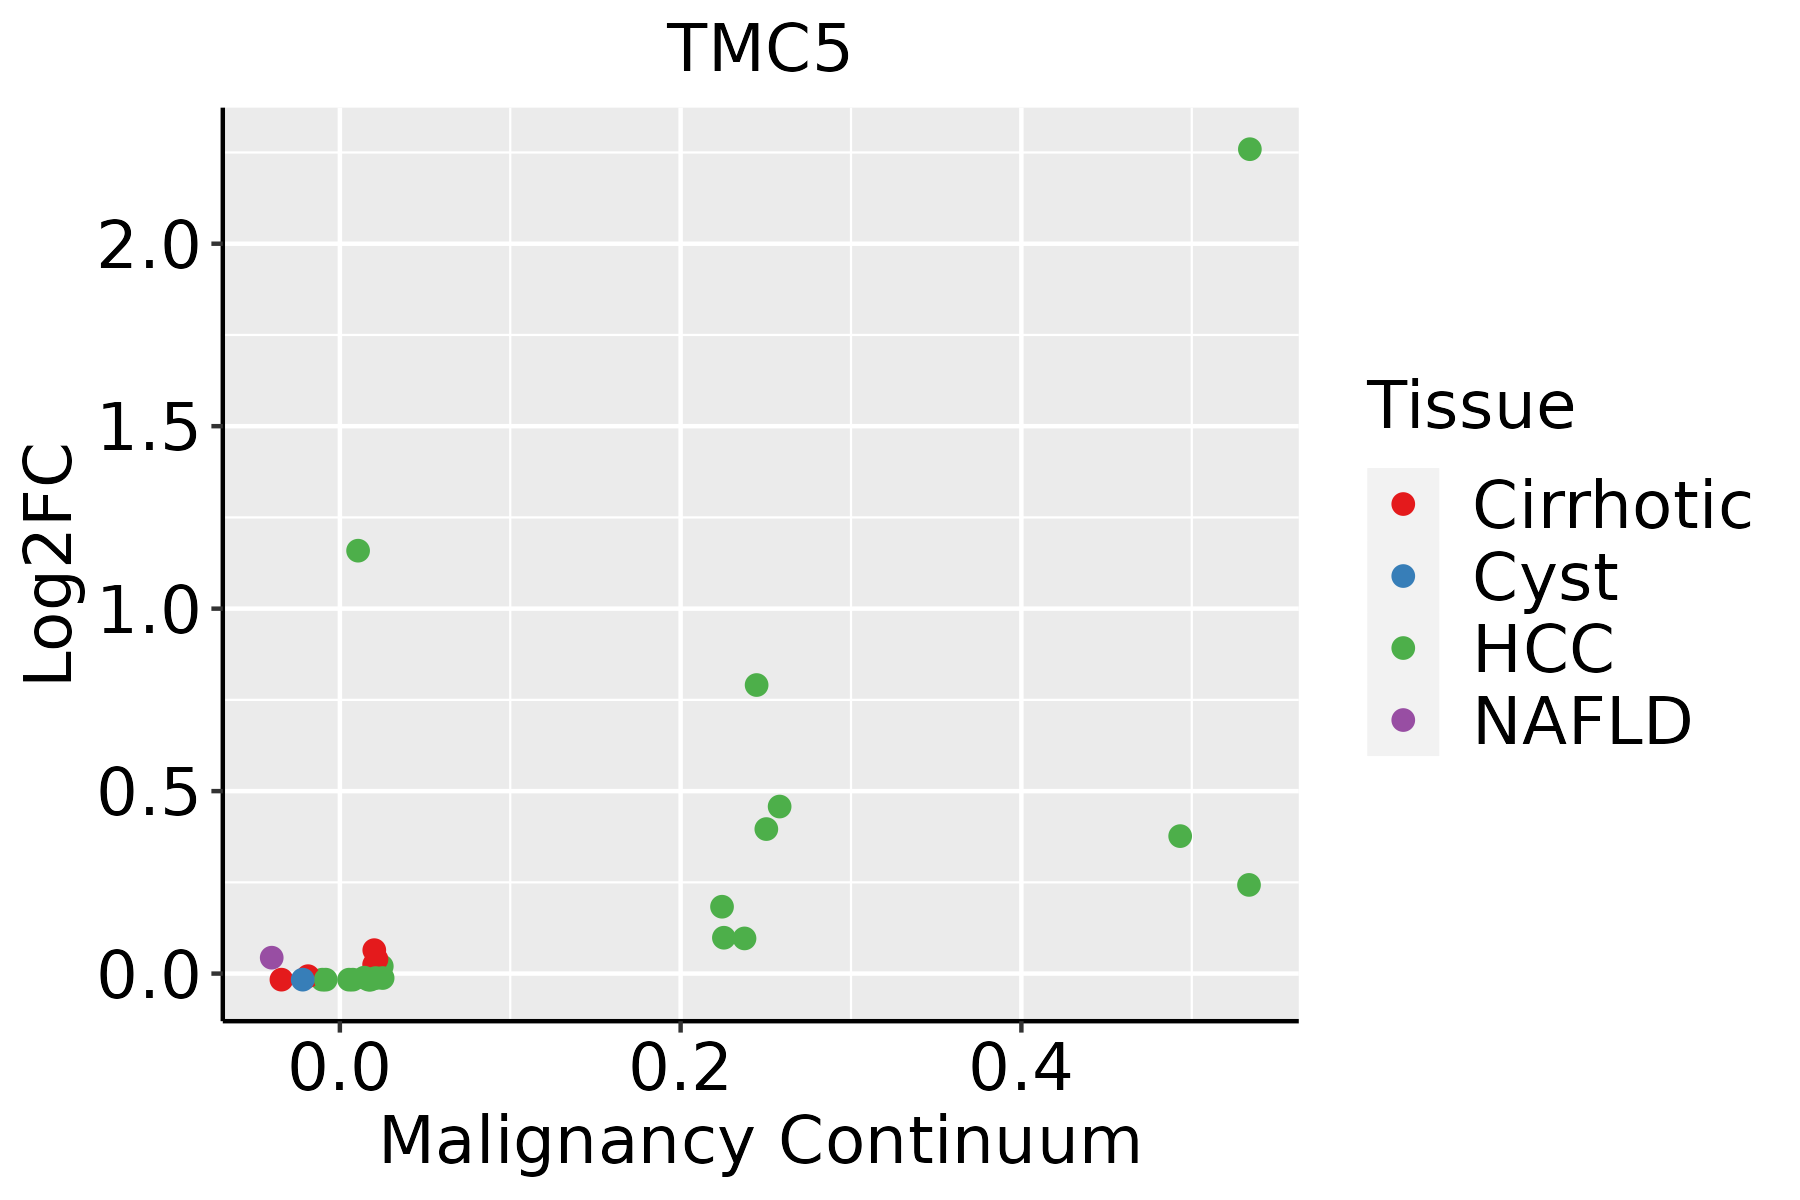 | HCC: Hepatocellular carcinoma |
| NAFLD: Non-alcoholic fatty liver disease | ||
| Lung | 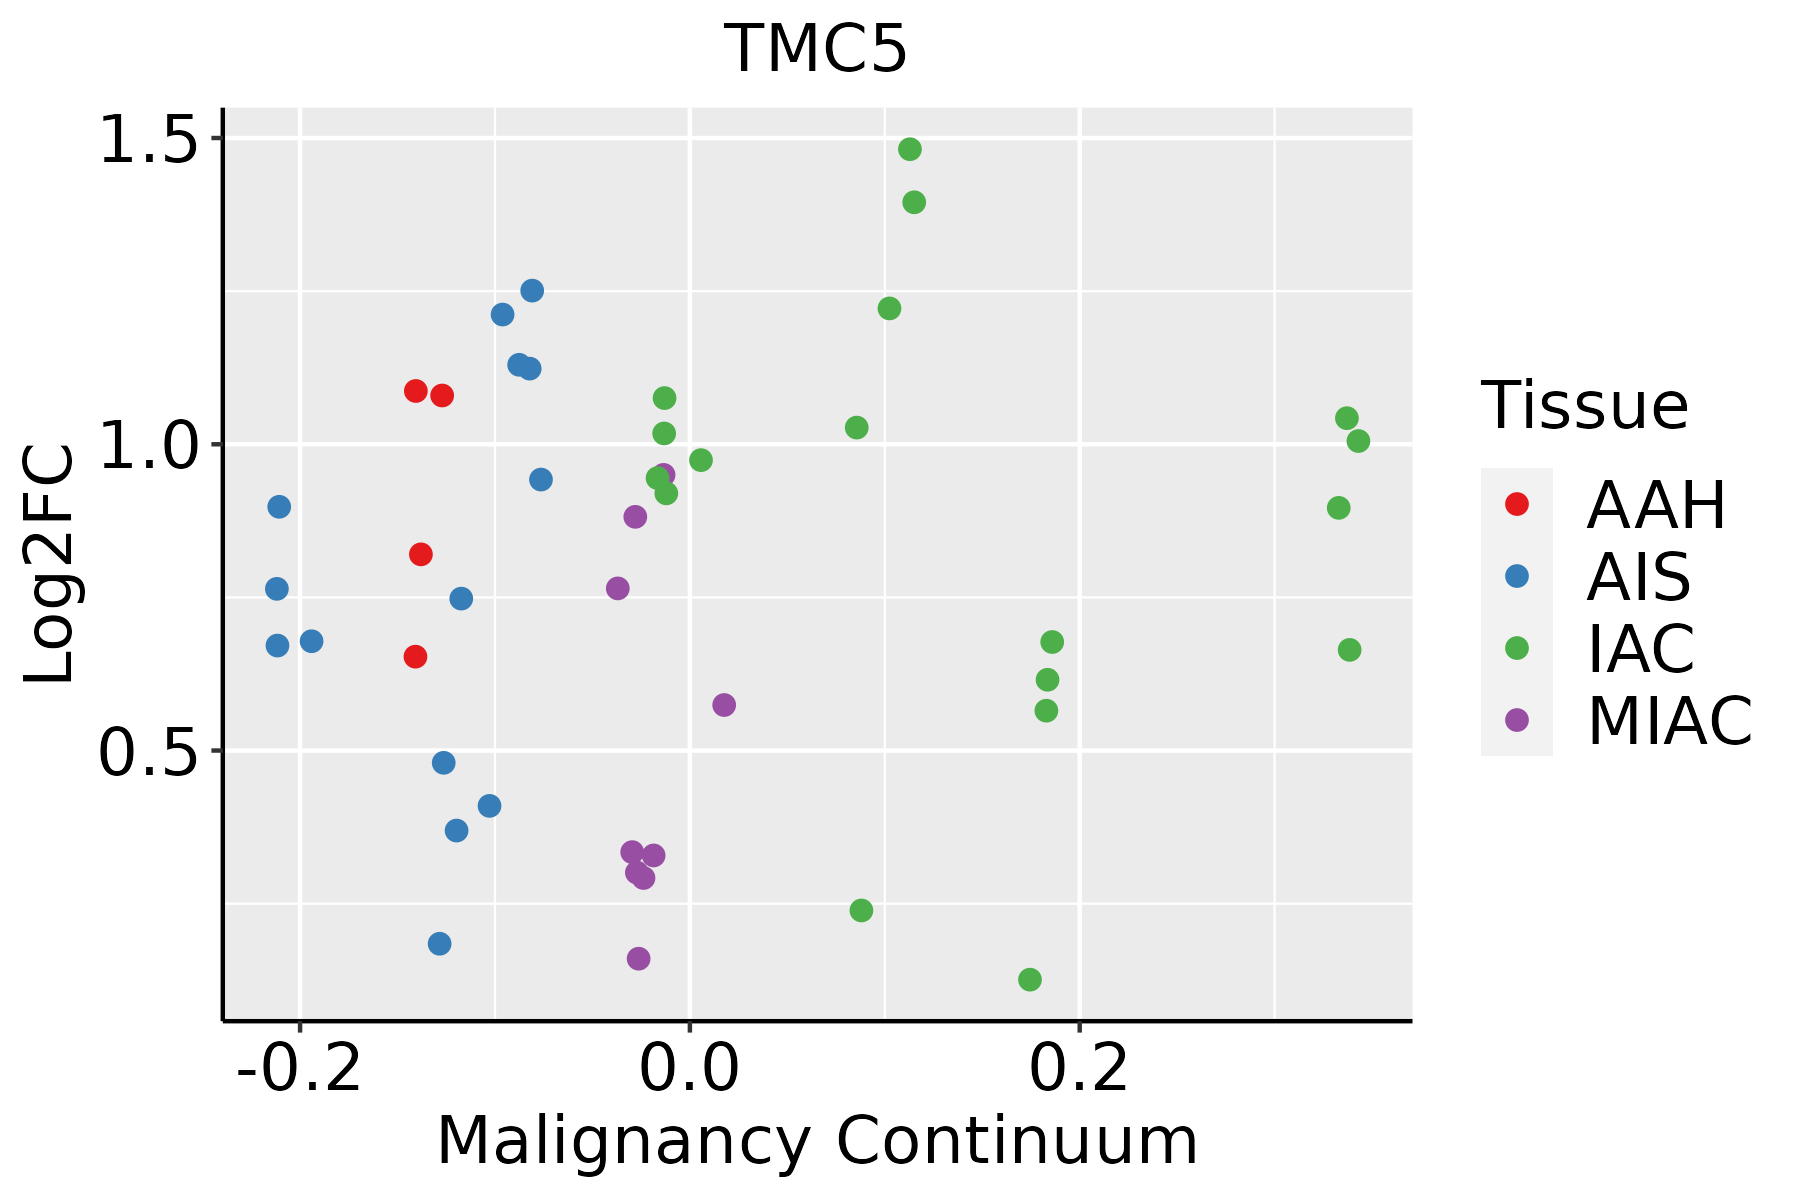 | AAH: Atypical adenomatous hyperplasia |
| AIS: Adenocarcinoma in situ | ||
| IAC: Invasive lung adenocarcinoma | ||
| MIA: Minimally invasive adenocarcinoma | ||
| Oral Cavity | 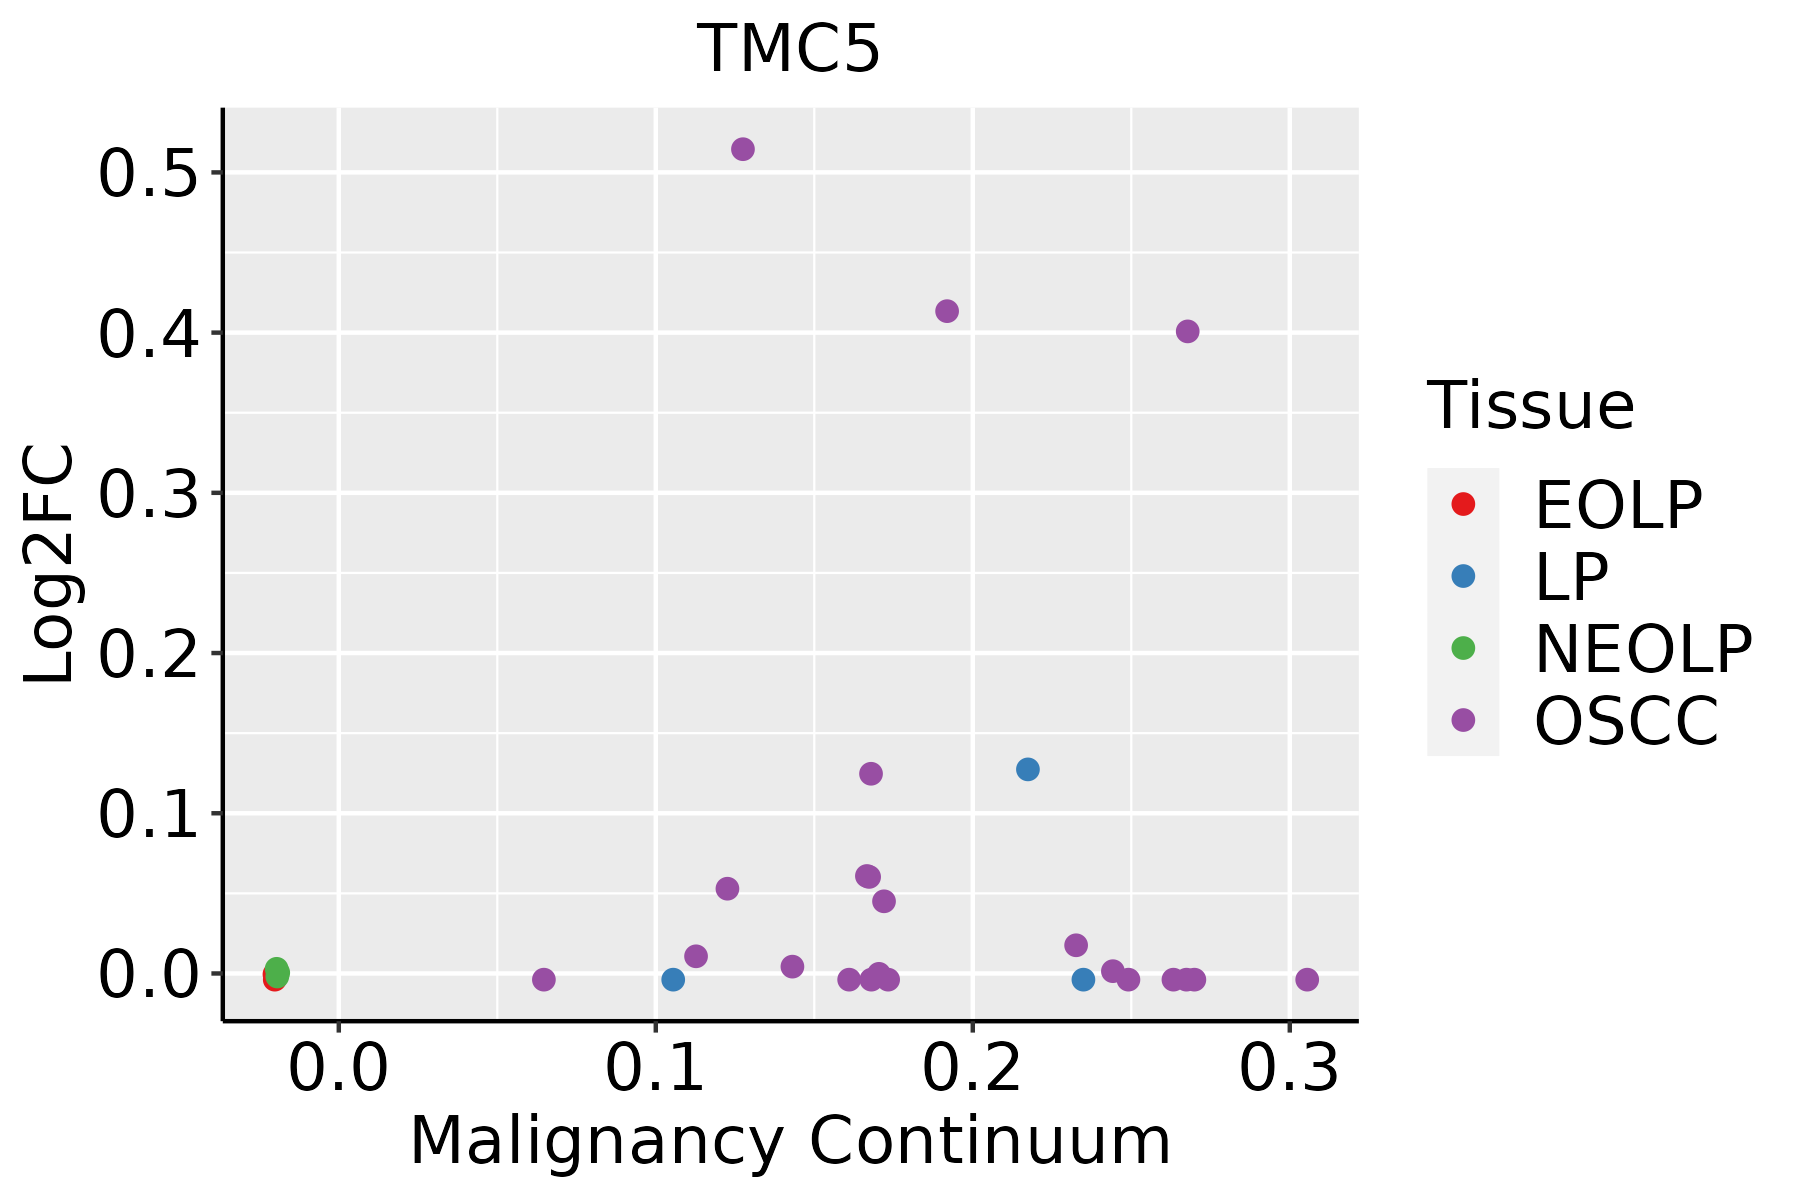 | EOLP: Erosive Oral lichen planus |
| LP: leukoplakia | ||
| NEOLP: Non-erosive oral lichen planus | ||
| OSCC: Oral squamous cell carcinoma | ||
| Prostate | 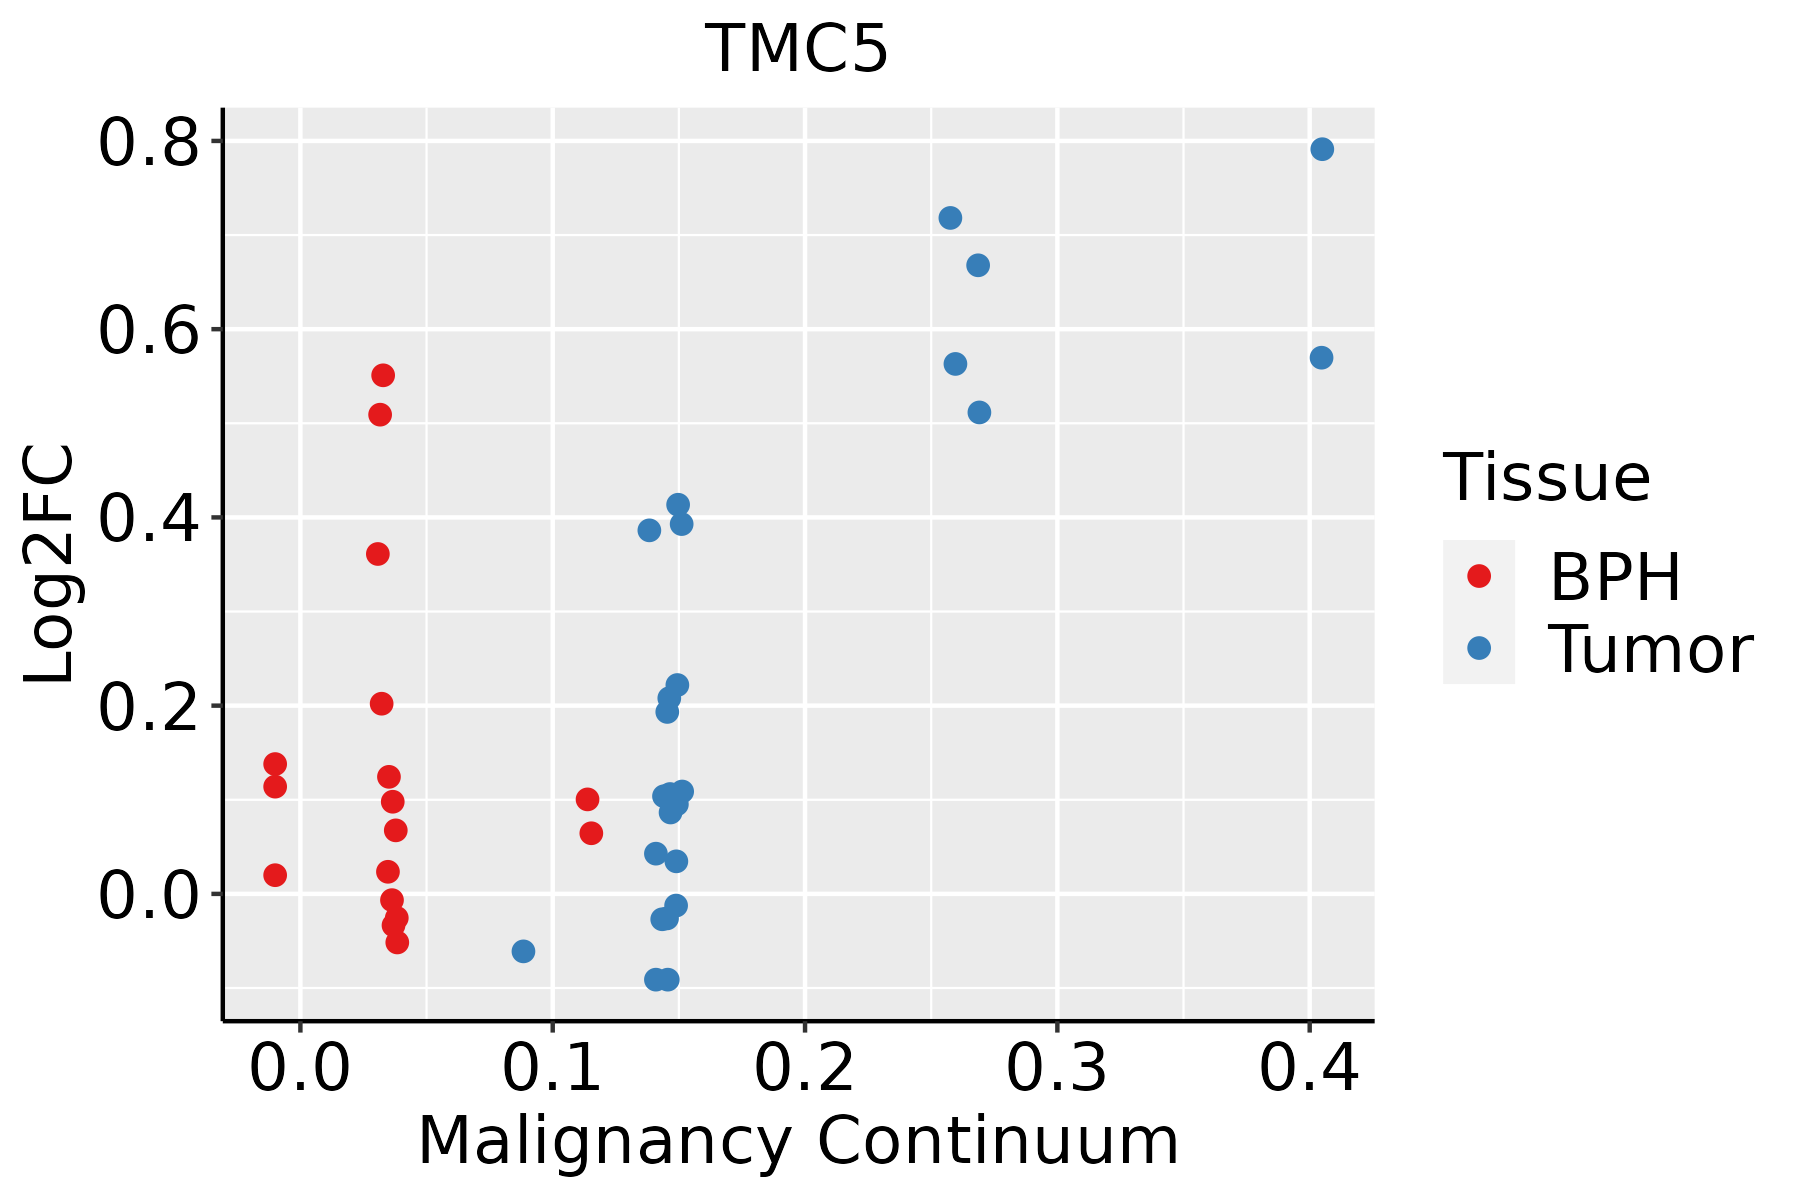 | BPH: Benign Prostatic Hyperplasia |
| ∗log2FC in expression of this searched gene in stem-like cells from each diseased tissue sample relative to stem-like cells in normal samples in each tissue plotted against the malignancy continuum. Samples are colored based on if they are from different disease stage. |
Top |
Malignant transformation related pathway analysis |
| Find out the enriched GO biological processes and KEGG pathways involved in transition from healthy to precancer to cancer |
| Tissue | Disease Stage | Enriched GO biological Processes |
| Colorectum | AD |  |
| Colorectum | SER |  |
| Colorectum | MSS |  |
| Colorectum | MSI-H |  |
| Colorectum | FAP |  |
| ∗Top 15 enriched GO BP terms are showed in the bar plot of each disease state in each tissue. Each row represents a significant GO biological process which is colored according to the -log10(p.adjust). |
| Page: 1 2 3 4 5 6 7 8 9 |
| GO ID | Tissue | Disease Stage | Description | Gene Ratio | Bg Ratio | pvalue | p.adjust | Count |
| Page: 1 |
| Pathway ID | Tissue | Disease Stage | Description | Gene Ratio | Bg Ratio | pvalue | p.adjust | qvalue | Count |
| Page: 1 |
Top |
Cell-cell communication analysis |
| Identification of potential cell-cell interactions between two cell types and their ligand-receptor pairs for different disease states |
| Ligand | Receptor | LRpair | Pathway | Tissue | Disease Stage |
| Page: 1 |
Top |
Single-cell gene regulatory network inference analysis |
| Find out the significant the regulons (TFs) and the target genes of each regulon across cell types for different disease states |
| TF | Cell Type | Tissue | Disease Stage | Target Gene | RSS | Regulon Activity |
| ∗The dot plots of a searched regulon are shown for all cell subpopulations in each disease state of each tissue based on the regulon specific score inferred using pySCENIC and by calculating the average expression. |
| Page: 1 |
Top |
Somatic mutation of malignant transformation related genes |
| Annotation of somatic variants for genes involved in malignant transformation |
| Hugo Symbol | Variant Class | Variant Classification | dbSNP RS | HGVSc | HGVSp | HGVSp Short | SWISSPROT | BIOTYPE | SIFT | PolyPhen | Tumor Sample Barcode | Tissue | Histology | Sex | Age | Stage | Therapy Types | Drugs | Outcome |
| TMC5 | SNV | Missense_Mutation | c.809N>T | p.Ser270Leu | p.S270L | Q6UXY8 | protein_coding | tolerated(0.08) | benign(0.366) | TCGA-AC-A23H-01 | Breast | breast invasive carcinoma | Female | >=65 | I/II | Unknown | Unknown | PD | |
| TMC5 | SNV | Missense_Mutation | c.2405N>A | p.Met802Lys | p.M802K | Q6UXY8 | protein_coding | deleterious(0) | probably_damaging(0.972) | TCGA-AN-A03Y-01 | Breast | breast invasive carcinoma | Female | >=65 | I/II | Unknown | Unknown | SD | |
| TMC5 | SNV | Missense_Mutation | rs766446786 | c.1553G>A | p.Ser518Asn | p.S518N | Q6UXY8 | protein_coding | tolerated(0.57) | benign(0.012) | TCGA-AN-A046-01 | Breast | breast invasive carcinoma | Female | >=65 | I/II | Unknown | Unknown | SD |
| TMC5 | SNV | Missense_Mutation | c.2230N>A | p.Ser744Thr | p.S744T | Q6UXY8 | protein_coding | tolerated(0.45) | benign(0.288) | TCGA-AO-A03O-01 | Breast | breast invasive carcinoma | Female | >=65 | I/II | Chemotherapy | doxorubicin | SD | |
| TMC5 | SNV | Missense_Mutation | c.142N>G | p.Pro48Ala | p.P48A | Q6UXY8 | protein_coding | deleterious_low_confidence(0.02) | benign(0.037) | TCGA-B6-A0RH-01 | Breast | breast invasive carcinoma | Female | <65 | I/II | Unknown | Unknown | PD | |
| TMC5 | SNV | Missense_Mutation | c.1882N>A | p.Gly628Arg | p.G628R | Q6UXY8 | protein_coding | deleterious(0) | probably_damaging(0.996) | TCGA-BH-A0HF-01 | Breast | breast invasive carcinoma | Female | >=65 | I/II | Hormone Therapy | arimidex | SD | |
| TMC5 | SNV | Missense_Mutation | c.1613C>G | p.Thr538Ser | p.T538S | Q6UXY8 | protein_coding | deleterious(0.03) | benign(0.035) | TCGA-D8-A1JN-01 | Breast | breast invasive carcinoma | Female | >=65 | III/IV | Hormone Therapy | anastrozolum | SD | |
| TMC5 | SNV | Missense_Mutation | c.1198N>T | p.Leu400Phe | p.L400F | Q6UXY8 | protein_coding | tolerated(0.33) | benign(0.006) | TCGA-E9-A1R4-01 | Breast | breast invasive carcinoma | Female | >=65 | I/II | Chemotherapy | 5-fluorouracil | SD | |
| TMC5 | insertion | Nonsense_Mutation | novel | c.45_46insCAAATGCAGGTCTTGGCTTTGTGTGCATGACCCAAGATGG | p.Tyr16GlnfsTer10 | p.Y16Qfs*10 | Q6UXY8 | protein_coding | TCGA-A8-A095-01 | Breast | breast invasive carcinoma | Female | <65 | I/II | Chemotherapy | 5-fluorouracil | CR | ||
| TMC5 | insertion | Frame_Shift_Ins | novel | c.86_87insCCAAATGCAGGTC | p.Leu30GlnfsTer51 | p.L30Qfs*51 | Q6UXY8 | protein_coding | TCGA-AO-A0JF-01 | Breast | breast invasive carcinoma | Female | >=65 | I/II | Chemotherapy | doxorubicin | SD |
| Page: 1 2 3 4 5 6 7 8 9 10 11 12 |
Top |
Related drugs of malignant transformation related genes |
| Identification of chemicals and drugs interact with genes involved in malignant transfromation |
| (DGIdb 4.0) |
| Entrez ID | Symbol | Category | Interaction Types | Drug Claim Name | Drug Name | PMIDs |
| Page: 1 |

Copyright 2023-Present -The University of Texas Health Science Center at Houston |