
|
|||||
|
 | |
| |
| |
| |
| |
| |
|
Gene: TMC4 |
Gene summary for TMC4 |
| Gene information | Species | Human | Gene symbol | TMC4 | Gene ID | 147798 |
| Gene name | transmembrane channel like 4 | |
| Gene Alias | TMC4 | |
| Cytomap | 19q13.42 | |
| Gene Type | protein-coding | GO ID | GO:0006810 | UniProtAcc | A0A087WT65 |
Top |
Malignant transformation analysis |
| Identification of the aberrant gene expression in precancerous and cancerous lesions by comparing the gene expression of stem-like cells in diseased tissues with normal stem cells |
| Entrez ID | Symbol | Replicates | Species | Organ | Tissue | Adj P-value | Log2FC | Malignancy |
| 147798 | TMC4 | HTA11_2487_2000001011 | Human | Colorectum | SER | 2.25e-08 | 7.27e-01 | -0.1808 |
| 147798 | TMC4 | HTA11_78_2000001011 | Human | Colorectum | AD | 1.50e-03 | 5.86e-01 | -0.1088 |
| 147798 | TMC4 | HTA11_347_2000001011 | Human | Colorectum | AD | 1.25e-18 | 7.53e-01 | -0.1954 |
| 147798 | TMC4 | HTA11_411_2000001011 | Human | Colorectum | SER | 6.28e-07 | 1.25e+00 | -0.2602 |
| 147798 | TMC4 | HTA11_83_2000001011 | Human | Colorectum | SER | 2.79e-02 | 5.63e-01 | -0.1526 |
| 147798 | TMC4 | HTA11_696_2000001011 | Human | Colorectum | AD | 1.76e-16 | 7.05e-01 | -0.1464 |
| 147798 | TMC4 | HTA11_866_2000001011 | Human | Colorectum | AD | 2.95e-08 | 4.70e-01 | -0.1001 |
| 147798 | TMC4 | HTA11_1391_2000001011 | Human | Colorectum | AD | 1.31e-06 | 6.72e-01 | -0.059 |
| 147798 | TMC4 | HTA11_10711_2000001011 | Human | Colorectum | AD | 7.13e-03 | 4.96e-01 | 0.0338 |
| 147798 | TMC4 | HTA11_7696_3000711011 | Human | Colorectum | AD | 4.44e-16 | 6.72e-01 | 0.0674 |
| 147798 | TMC4 | HTA11_99999965104_69814 | Human | Colorectum | MSS | 2.52e-03 | 5.41e-01 | 0.281 |
| 147798 | TMC4 | HTA11_99999974143_84620 | Human | Colorectum | MSS | 1.25e-07 | 4.71e-01 | 0.3005 |
| 147798 | TMC4 | A015-C-203 | Human | Colorectum | FAP | 7.12e-25 | 1.88e-01 | -0.1294 |
| 147798 | TMC4 | A015-C-204 | Human | Colorectum | FAP | 1.60e-02 | 1.31e-01 | -0.0228 |
| 147798 | TMC4 | A014-C-040 | Human | Colorectum | FAP | 8.59e-04 | 3.24e-01 | -0.1184 |
| 147798 | TMC4 | A002-C-201 | Human | Colorectum | FAP | 2.54e-10 | 1.91e-01 | 0.0324 |
| 147798 | TMC4 | A001-C-119 | Human | Colorectum | FAP | 4.87e-05 | 3.04e-01 | -0.1557 |
| 147798 | TMC4 | A001-C-108 | Human | Colorectum | FAP | 9.55e-09 | 2.24e-02 | -0.0272 |
| 147798 | TMC4 | A002-C-205 | Human | Colorectum | FAP | 6.91e-16 | -6.05e-02 | -0.1236 |
| 147798 | TMC4 | A015-C-006 | Human | Colorectum | FAP | 2.25e-12 | 4.63e-02 | -0.0994 |
| Page: 1 2 3 4 5 6 7 |
| Tissue | Expression Dynamics | Abbreviation |
| Colorectum (GSE201348) |  | FAP: Familial adenomatous polyposis |
| CRC: Colorectal cancer | ||
| Colorectum (HTA11) |  | AD: Adenomas |
| SER: Sessile serrated lesions | ||
| MSI-H: Microsatellite-high colorectal cancer | ||
| MSS: Microsatellite stable colorectal cancer | ||
| Esophagus |  | ESCC: Esophageal squamous cell carcinoma |
| HGIN: High-grade intraepithelial neoplasias | ||
| LGIN: Low-grade intraepithelial neoplasias | ||
| GC |  | CAG: Chronic atrophic gastritis |
| CAG with IM: Chronic atrophic gastritis with intestinal metaplasia | ||
| CSG: Chronic superficial gastritis | ||
| GC: Gastric cancer | ||
| SIM: Severe intestinal metaplasia | ||
| WIM: Wild intestinal metaplasia | ||
| Lung |  | AAH: Atypical adenomatous hyperplasia |
| AIS: Adenocarcinoma in situ | ||
| IAC: Invasive lung adenocarcinoma | ||
| MIA: Minimally invasive adenocarcinoma | ||
| Oral Cavity | 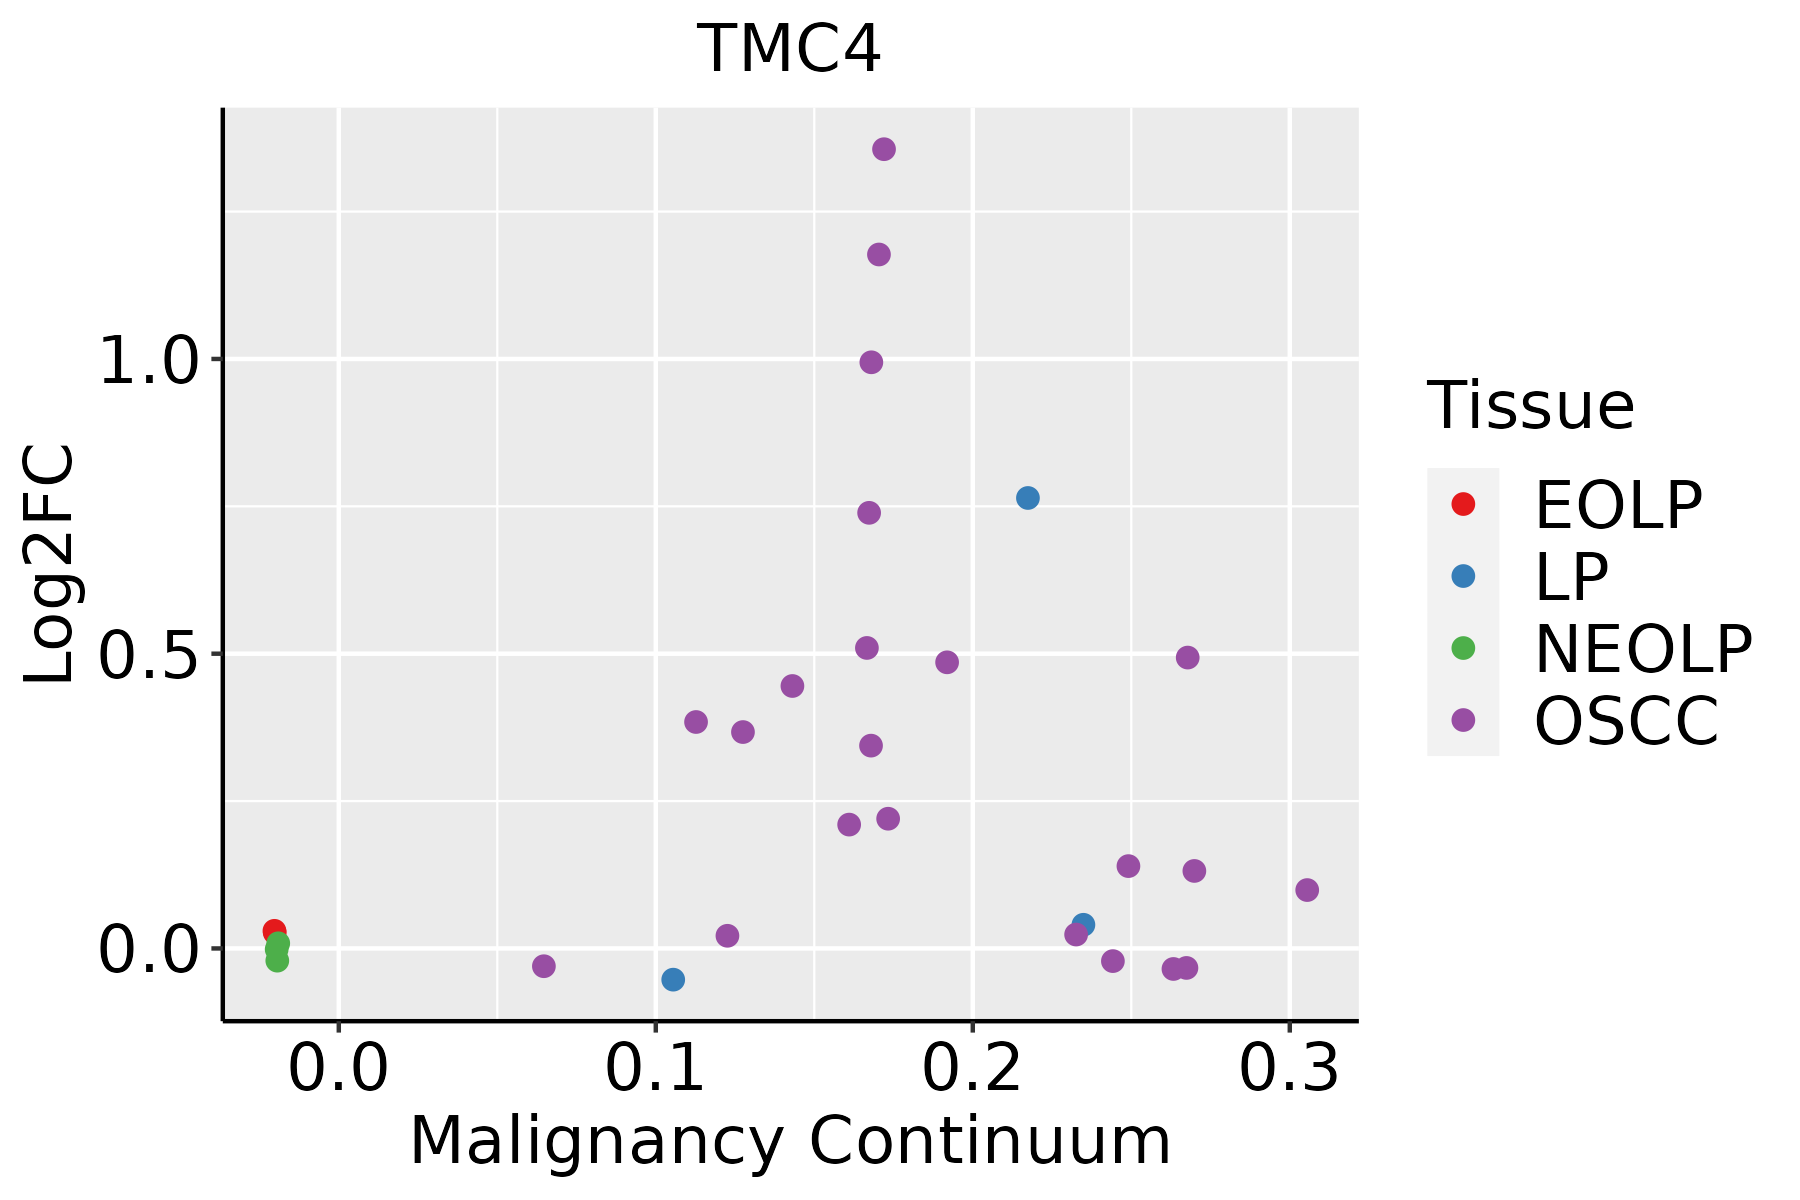 | EOLP: Erosive Oral lichen planus |
| LP: leukoplakia | ||
| NEOLP: Non-erosive oral lichen planus | ||
| OSCC: Oral squamous cell carcinoma | ||
| Thyroid | 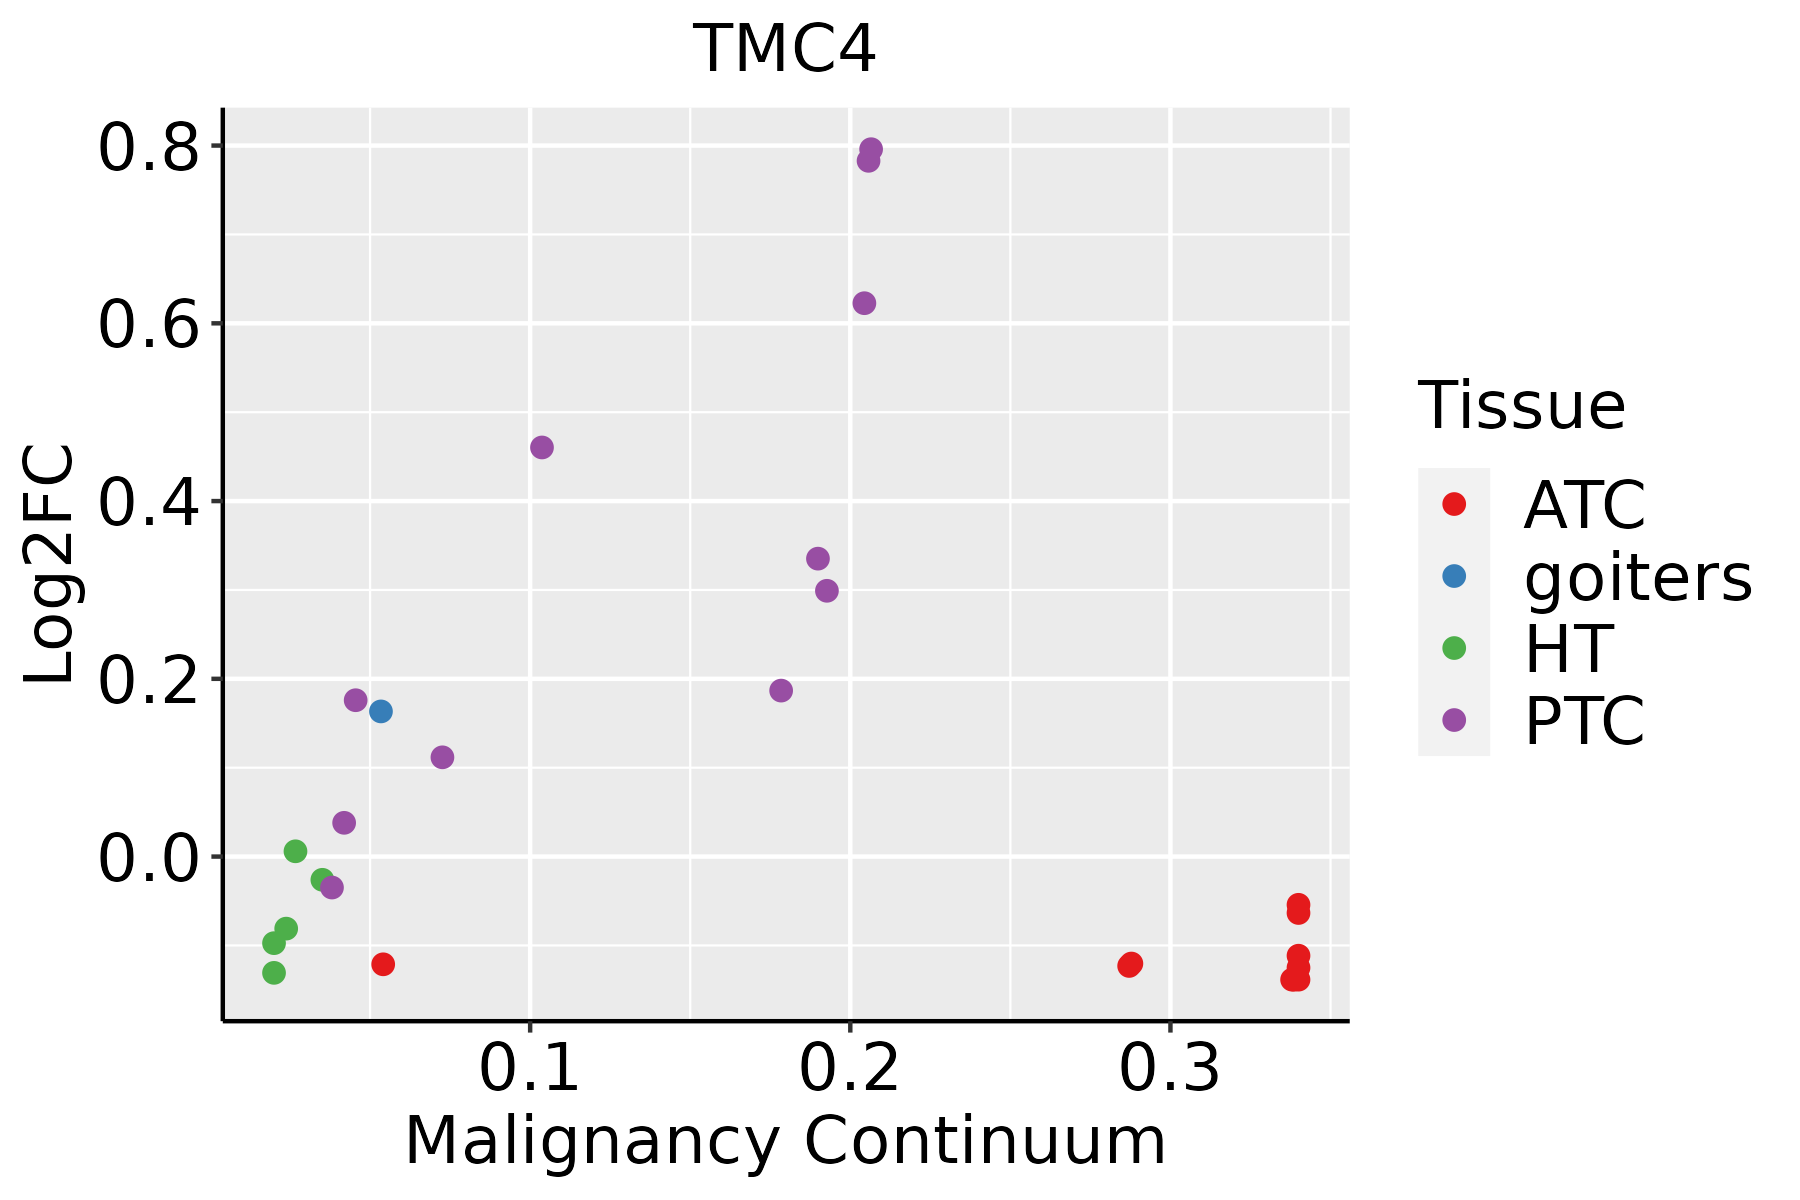 | ATC: Anaplastic thyroid cancer |
| HT: Hashimoto's thyroiditis | ||
| PTC: Papillary thyroid cancer |
| ∗log2FC in expression of this searched gene in stem-like cells from each diseased tissue sample relative to stem-like cells in normal samples in each tissue plotted against the malignancy continuum. Samples are colored based on if they are from different disease stage. |
Top |
Malignant transformation related pathway analysis |
| Find out the enriched GO biological processes and KEGG pathways involved in transition from healthy to precancer to cancer |
| Tissue | Disease Stage | Enriched GO biological Processes |
| Colorectum | AD |  |
| Colorectum | SER |  |
| Colorectum | MSS |  |
| Colorectum | MSI-H |  |
| Colorectum | FAP |  |
| ∗Top 15 enriched GO BP terms are showed in the bar plot of each disease state in each tissue. Each row represents a significant GO biological process which is colored according to the -log10(p.adjust). |
| Page: 1 2 3 4 5 6 7 8 9 |
| GO ID | Tissue | Disease Stage | Description | Gene Ratio | Bg Ratio | pvalue | p.adjust | Count |
| Page: 1 |
| Pathway ID | Tissue | Disease Stage | Description | Gene Ratio | Bg Ratio | pvalue | p.adjust | qvalue | Count |
| Page: 1 |
Top |
Cell-cell communication analysis |
| Identification of potential cell-cell interactions between two cell types and their ligand-receptor pairs for different disease states |
| Ligand | Receptor | LRpair | Pathway | Tissue | Disease Stage |
| Page: 1 |
Top |
Single-cell gene regulatory network inference analysis |
| Find out the significant the regulons (TFs) and the target genes of each regulon across cell types for different disease states |
| TF | Cell Type | Tissue | Disease Stage | Target Gene | RSS | Regulon Activity |
| ∗The dot plots of a searched regulon are shown for all cell subpopulations in each disease state of each tissue based on the regulon specific score inferred using pySCENIC and by calculating the average expression. |
| Page: 1 |
Top |
Somatic mutation of malignant transformation related genes |
| Annotation of somatic variants for genes involved in malignant transformation |
| Hugo Symbol | Variant Class | Variant Classification | dbSNP RS | HGVSc | HGVSp | HGVSp Short | SWISSPROT | BIOTYPE | SIFT | PolyPhen | Tumor Sample Barcode | Tissue | Histology | Sex | Age | Stage | Therapy Types | Drugs | Outcome |
| TMC4 | SNV | Missense_Mutation | novel | c.1353N>T | p.Gln451His | p.Q451H | protein_coding | deleterious(0.02) | probably_damaging(0.914) | TCGA-A2-A3Y0-01 | Breast | breast invasive carcinoma | Female | <65 | I/II | Chemotherapy | adriamycin | CR | |
| TMC4 | SNV | Missense_Mutation | novel | c.41N>T | p.Ser14Phe | p.S14F | protein_coding | tolerated_low_confidence(0.22) | benign(0.266) | TCGA-BH-A0HO-01 | Breast | breast invasive carcinoma | Female | <65 | I/II | Chemotherapy | cyclophosphamide | SD | |
| TMC4 | SNV | Missense_Mutation | novel | c.800N>C | p.Leu267Pro | p.L267P | protein_coding | deleterious(0) | probably_damaging(0.967) | TCGA-PL-A8LV-01 | Breast | breast invasive carcinoma | Female | <65 | III/IV | Unknown | Unknown | SD | |
| TMC4 | insertion | Frame_Shift_Ins | novel | c.725_726insT | p.Phe243LeufsTer219 | p.F243Lfs*219 | protein_coding | TCGA-A2-A0CP-01 | Breast | breast invasive carcinoma | Female | <65 | I/II | Chemotherapy | cytoxan | SD | |||
| TMC4 | insertion | In_Frame_Ins | novel | c.723_724insCGCCATGTTGGCCAGGCTGGTCTCGAACTCCTGATCTCA | p.Tyr241_Gly242insArgHisValGlyGlnAlaGlyLeuGluLeuLeuIleSer | p.Y241_G242insRHVGQAGLELLIS | protein_coding | TCGA-A2-A0CP-01 | Breast | breast invasive carcinoma | Female | <65 | I/II | Chemotherapy | cytoxan | SD | |||
| TMC4 | insertion | In_Frame_Ins | novel | c.1658_1659insTCAAAAAGAGAAAACAAACAAACAACAACAACA | p.Pro553_Leu554insGlnLysGluLysThrAsnLysGlnGlnGlnHis | p.P553_L554insQKEKTNKQQQH | protein_coding | TCGA-AN-A0FN-01 | Breast | breast invasive carcinoma | Female | <65 | I/II | Unknown | Unknown | SD | |||
| TMC4 | SNV | Missense_Mutation | novel | c.1876N>C | p.Ser626Pro | p.S626P | protein_coding | tolerated(0.3) | benign(0.007) | TCGA-2W-A8YY-01 | Cervix | cervical & endocervical cancer | Female | <65 | I/II | Chemotherapy | cisplatin | CR | |
| TMC4 | SNV | Missense_Mutation | novel | c.1613N>T | p.Ala538Val | p.A538V | protein_coding | deleterious(0) | possibly_damaging(0.899) | TCGA-2W-A8YY-01 | Cervix | cervical & endocervical cancer | Female | <65 | I/II | Chemotherapy | cisplatin | CR | |
| TMC4 | SNV | Missense_Mutation | c.992N>A | p.Arg331His | p.R331H | protein_coding | deleterious(0.03) | benign(0.073) | TCGA-2W-A8YY-01 | Cervix | cervical & endocervical cancer | Female | <65 | I/II | Chemotherapy | cisplatin | CR | ||
| TMC4 | SNV | Missense_Mutation | novel | c.1427N>T | p.Trp476Leu | p.W476L | protein_coding | deleterious(0) | probably_damaging(0.997) | TCGA-C5-A7CM-01 | Cervix | cervical & endocervical cancer | Female | <65 | I/II | Chemotherapy | cisplatin | SD |
| Page: 1 2 3 4 5 6 7 8 9 |
Top |
Related drugs of malignant transformation related genes |
| Identification of chemicals and drugs interact with genes involved in malignant transfromation |
| (DGIdb 4.0) |
| Entrez ID | Symbol | Category | Interaction Types | Drug Claim Name | Drug Name | PMIDs |
| Page: 1 |

Copyright 2023-Present -The University of Texas Health Science Center at Houston |