Schematic overview of the cellular and molecular mechanisms involved in the cancer progression, including the proposed cellular and molecular mechanisms in cancer cells trajectory. AT1: alveolar type 1 cells; AT2: alveolar type 2 cells; AAH: atypical adenomatous hyperplasia; AIS: adenocarcinoma in situ; MIA: minimally invasive adenocarcinoma; IA: invasive adenocarcinoma; EMT: epithelial-mesenchymal transition

Home

Download

Statistics

Help

Contact

Center for Computational Systems Medicine
leaf

Gene summary

leaf

Malignant transformation analysis

leaf

Malignant transformation related pathway analysis

leaf

Cell-cell communication analysis

leaf

Single-cell gene regulatory network inference analysis

leaf

Somatic mutation of malignant transformation related genes

leaf

Related drugs of malignant transformation related genes

Gene: TM9SF4

Gene summary for TM9SF4

check button Gene summary.

Gene informationSpeciesHuman
Gene symbol

TM9SF4

Gene ID

9777

Gene nametransmembrane 9 superfamily member 4
Gene AliasdJ836N17.2
Cytomap20q11.21
Gene Typeprotein-coding
GO ID

GO:0001666

UniProtAcc

A0A024QYR3


Top

Malignant transformation analysis

check button Identification of the aberrant gene expression in precancerous and cancerous lesions by comparing the gene expression of stem-like cells in diseased tissues with normal stem cells
check button Malignant transformation involving gene list.
Entrez IDSymbolReplicatesSpeciesOrganTissueAdj P-valueLog2FCMalignancy
9777TM9SF4LZE4THumanEsophagusESCC2.34e-135.00e-010.0811
9777TM9SF4LZE5THumanEsophagusESCC1.87e-022.10e-010.0514
9777TM9SF4LZE7THumanEsophagusESCC2.16e-054.94e-010.0667
9777TM9SF4LZE8THumanEsophagusESCC1.09e-081.95e-010.067
9777TM9SF4LZE20THumanEsophagusESCC3.18e-113.48e-010.0662
9777TM9SF4LZE22THumanEsophagusESCC5.57e-053.19e-010.068
9777TM9SF4LZE24THumanEsophagusESCC1.31e-237.72e-010.0596
9777TM9SF4P1T-EHumanEsophagusESCC1.68e-065.86e-010.0875
9777TM9SF4P2T-EHumanEsophagusESCC1.53e-234.29e-010.1177
9777TM9SF4P4T-EHumanEsophagusESCC2.29e-215.45e-010.1323
9777TM9SF4P5T-EHumanEsophagusESCC1.20e-162.98e-010.1327
9777TM9SF4P8T-EHumanEsophagusESCC1.73e-427.11e-010.0889
9777TM9SF4P9T-EHumanEsophagusESCC6.42e-172.62e-010.1131
9777TM9SF4P10T-EHumanEsophagusESCC7.99e-366.76e-010.116
9777TM9SF4P11T-EHumanEsophagusESCC5.35e-197.76e-010.1426
9777TM9SF4P12T-EHumanEsophagusESCC2.81e-377.13e-010.1122
9777TM9SF4P15T-EHumanEsophagusESCC7.54e-356.52e-010.1149
9777TM9SF4P16T-EHumanEsophagusESCC2.92e-408.02e-010.1153
9777TM9SF4P17T-EHumanEsophagusESCC6.73e-134.90e-010.1278
9777TM9SF4P20T-EHumanEsophagusESCC4.91e-287.15e-010.1124
Page: 1 2 3 4 5 6 

check button Transcriptomic changes along malignancy continuum.
TissueExpression DynamicsAbbreviation
EsophagusThe image shows the transcriptomic changes along malignancy continuum.log2FC in expression of this searched gene in stem-like cells from each diseased tissue sample relative to stem-like cells in normal samples in each tissue plotted against the malignancy continuum. Samples are colored based on if they are from different disease stage.
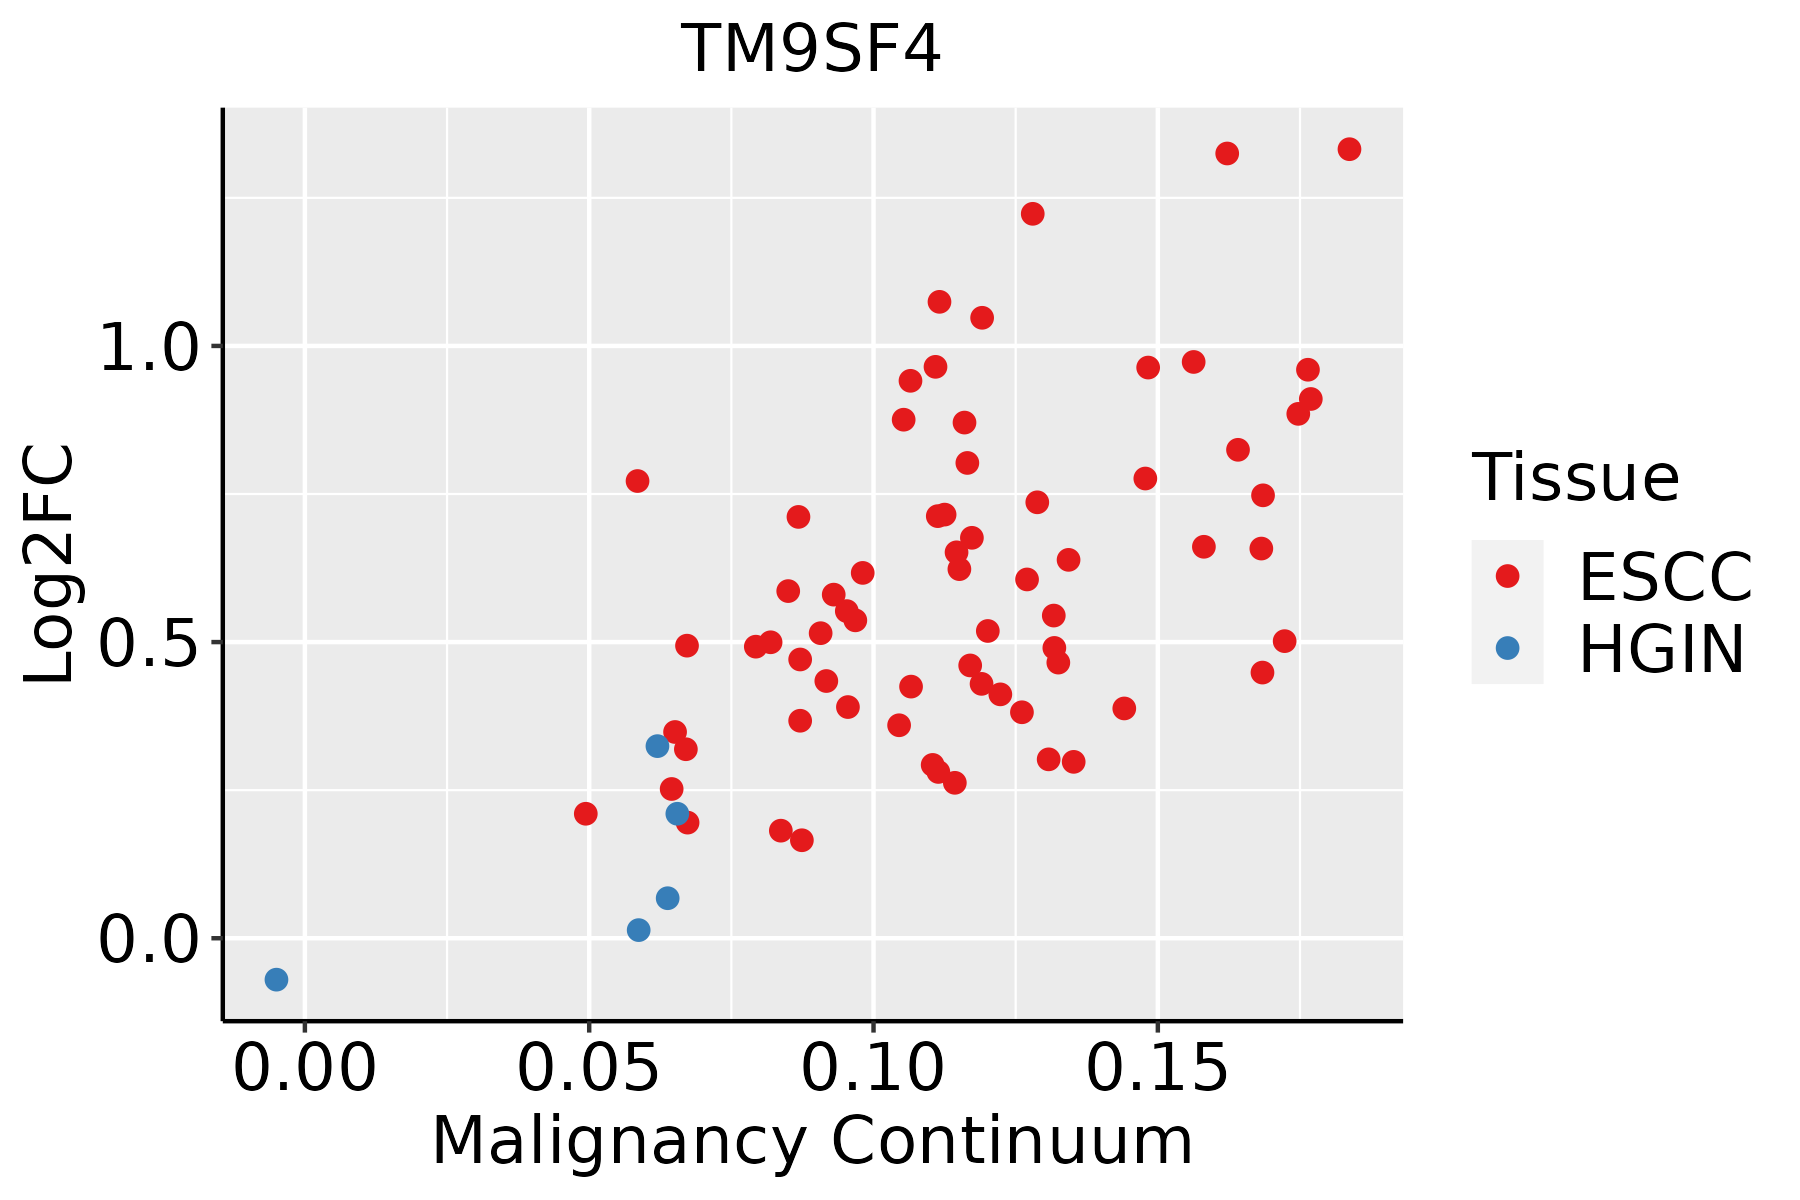
ESCC: Esophageal squamous cell carcinoma
HGIN: High-grade intraepithelial neoplasias
LGIN: Low-grade intraepithelial neoplasias
LiverThe image shows the transcriptomic changes along malignancy continuum.log2FC in expression of this searched gene in stem-like cells from each diseased tissue sample relative to stem-like cells in normal samples in each tissue plotted against the malignancy continuum. Samples are colored based on if they are from different disease stage.
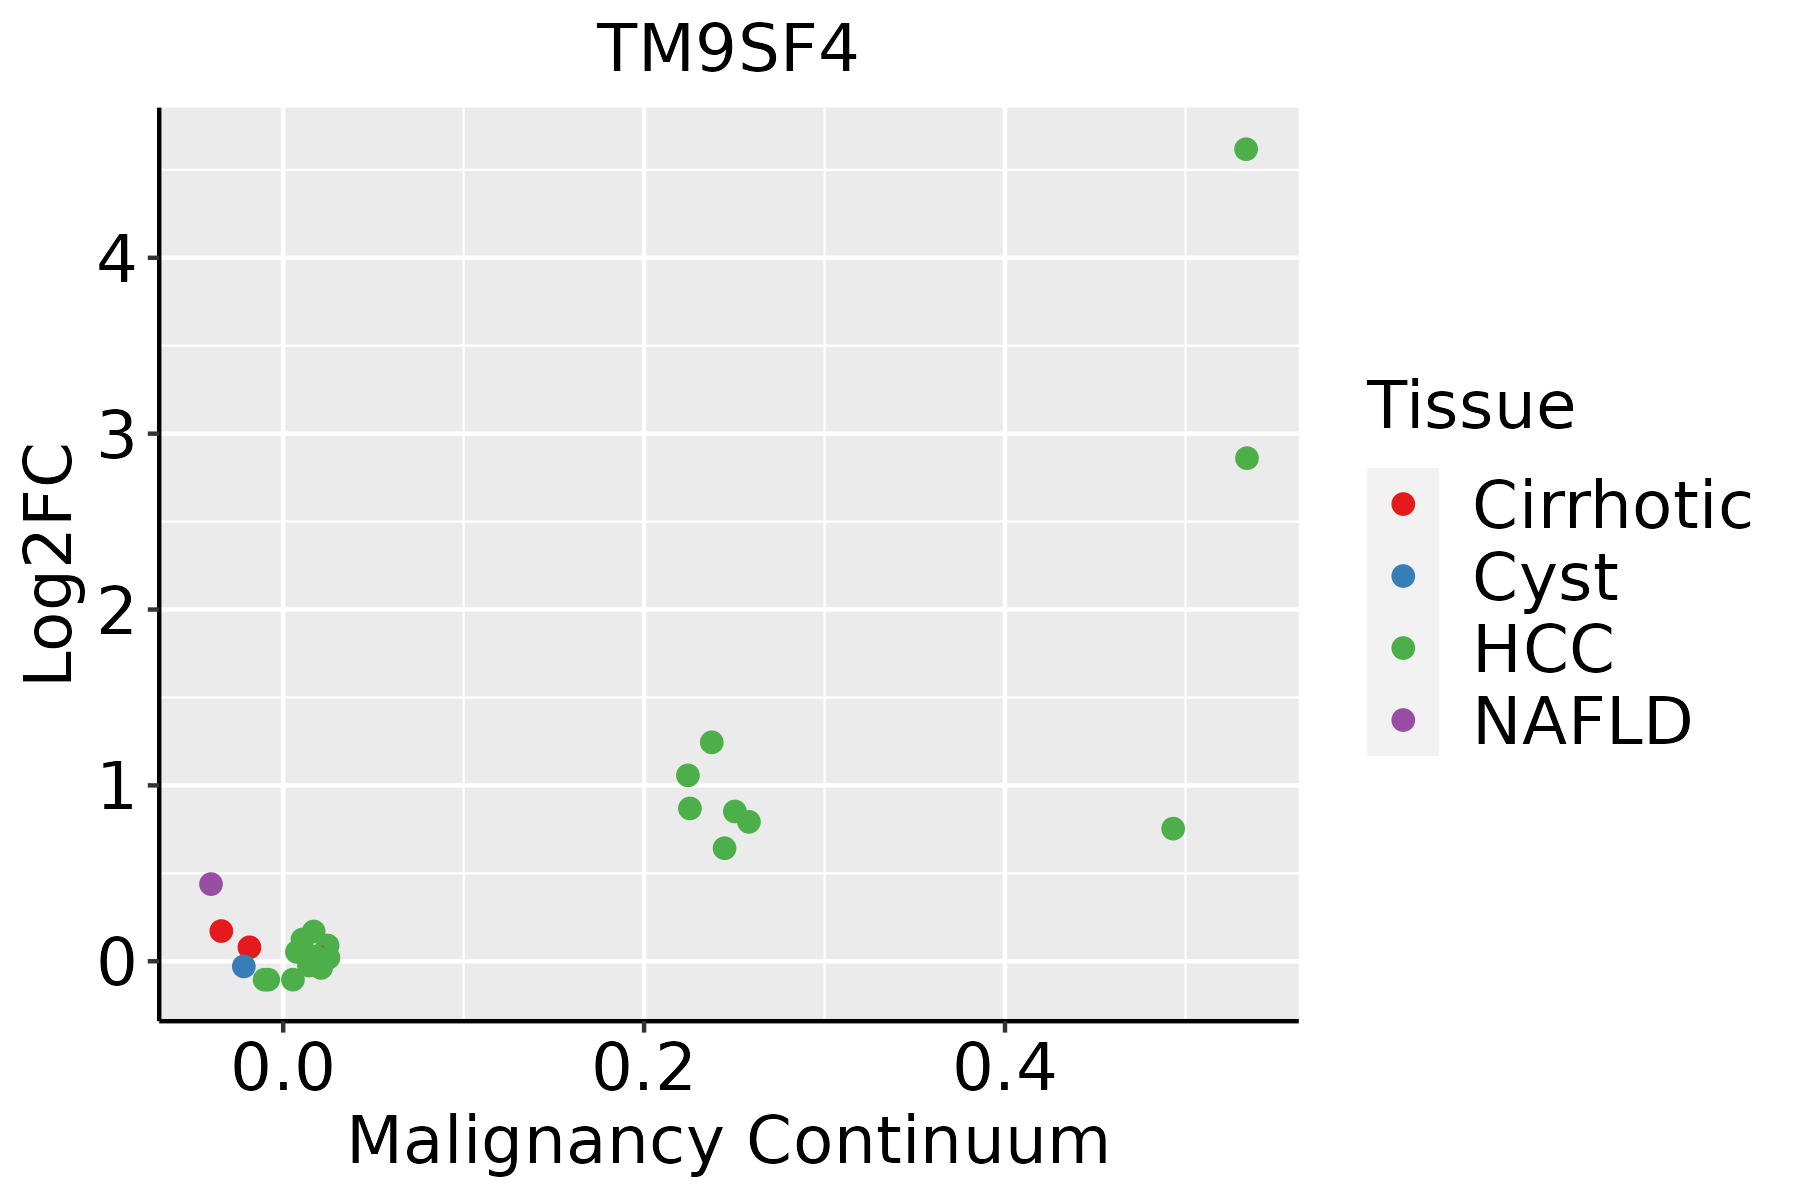
HCC: Hepatocellular carcinoma
NAFLD: Non-alcoholic fatty liver disease
Oral CavityThe image shows the transcriptomic changes along malignancy continuum.log2FC in expression of this searched gene in stem-like cells from each diseased tissue sample relative to stem-like cells in normal samples in each tissue plotted against the malignancy continuum. Samples are colored based on if they are from different disease stage.
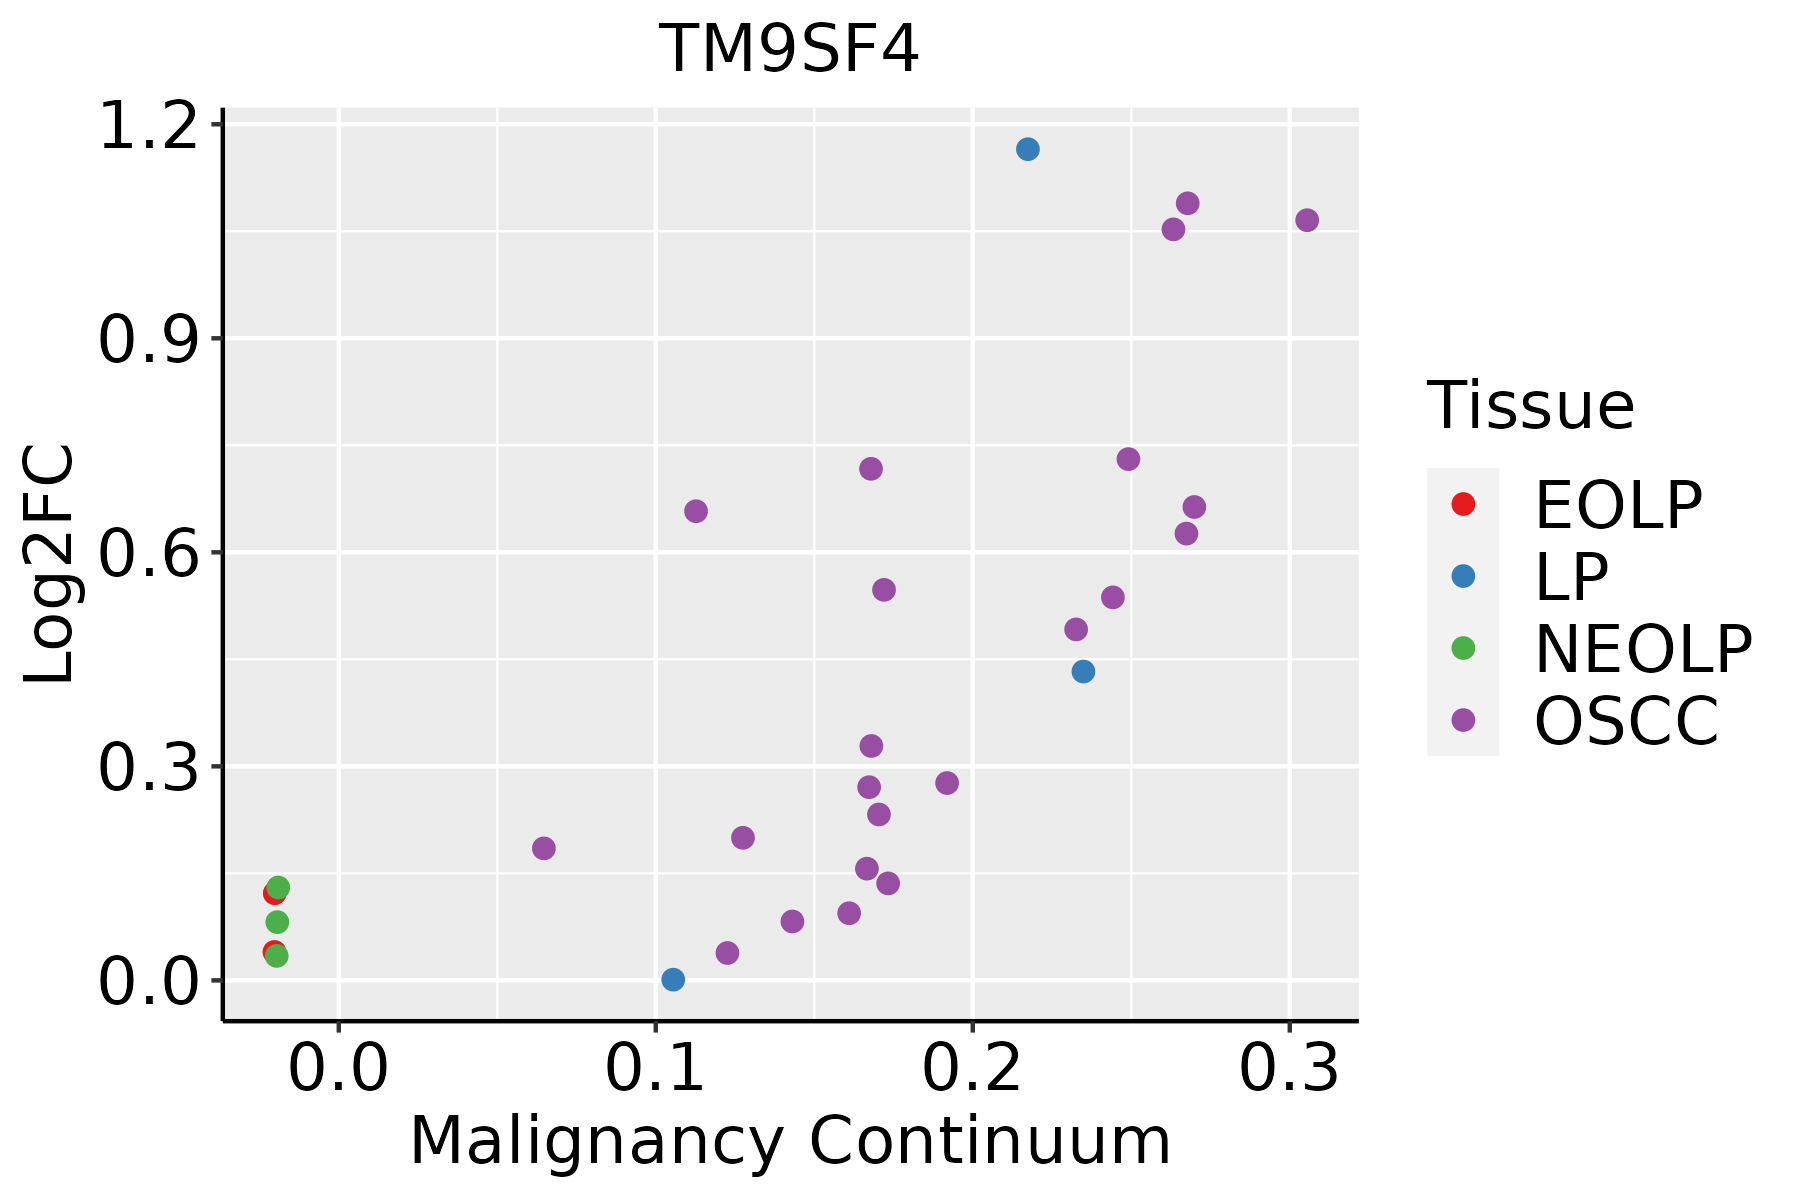
EOLP: Erosive Oral lichen planus
LP: leukoplakia
NEOLP: Non-erosive oral lichen planus
OSCC: Oral squamous cell carcinoma
ThyroidThe image shows the transcriptomic changes along malignancy continuum.log2FC in expression of this searched gene in stem-like cells from each diseased tissue sample relative to stem-like cells in normal samples in each tissue plotted against the malignancy continuum. Samples are colored based on if they are from different disease stage.
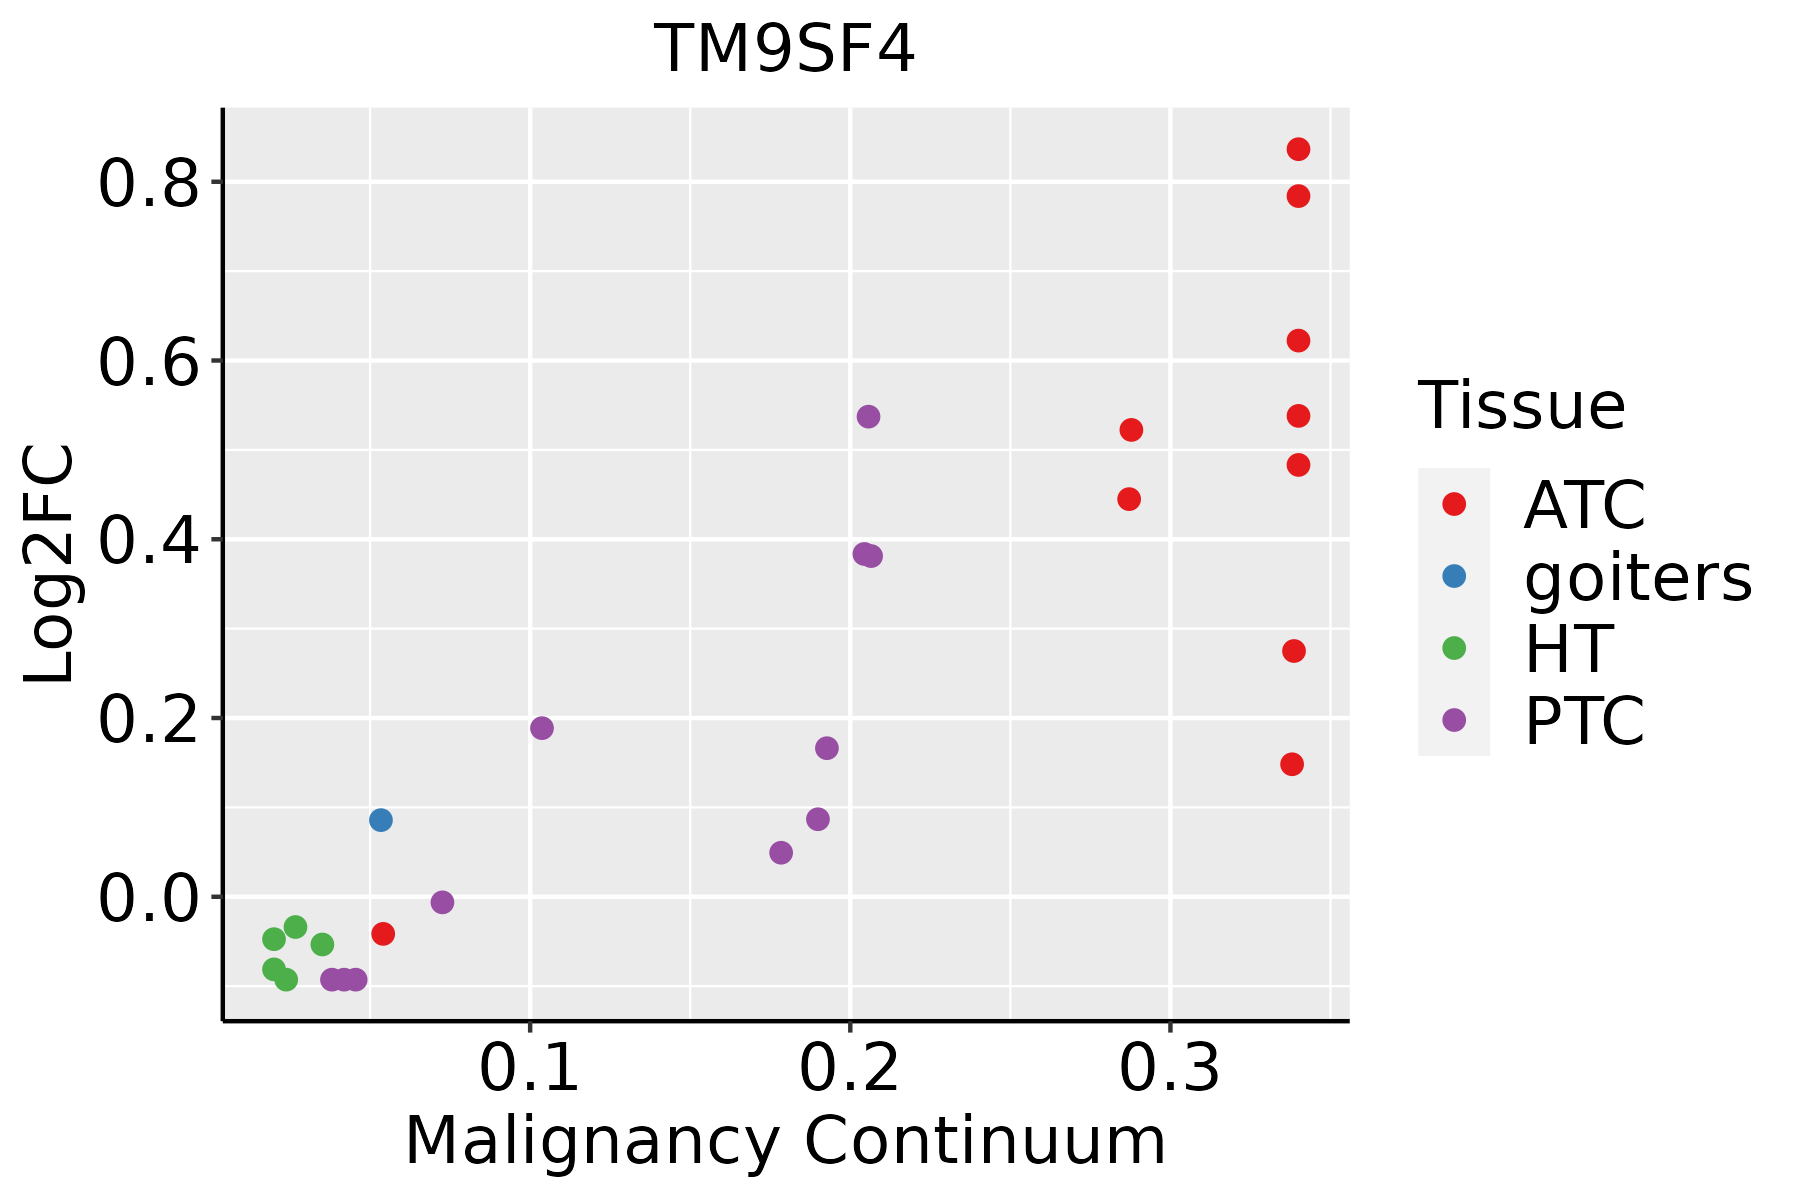
ATC: Anaplastic thyroid cancer
HT: Hashimoto's thyroiditis
PTC: Papillary thyroid cancer
∗log2FC in expression of this searched gene in stem-like cells from each diseased tissue sample relative to stem-like cells in normal samples in each tissue plotted against the malignancy continuum. Samples are colored based on if they are from different disease stage.

Top

Malignant transformation related pathway analysis

check buttonFind out the enriched GO biological processes and KEGG pathways involved in transition from healthy to precancer to cancer
check button Figure of enriched GO biological processes.
TissueDisease StageEnriched GO biological Processes
ColorectumADGO analysis - Figure of enriched GO biological processes: Top 15 enriched GO BP terms are showed in the bar plot of each disease state in each tissue. Each row represents a significant GO biological process which is colored according to the -log10(p.adjust).
ColorectumSERGO analysis - Figure of enriched GO biological processes: Top 15 enriched GO BP terms are showed in the bar plot of each disease state in each tissue. Each row represents a significant GO biological process which is colored according to the -log10(p.adjust).
ColorectumMSSGO analysis - Figure of enriched GO biological processes: Top 15 enriched GO BP terms are showed in the bar plot of each disease state in each tissue. Each row represents a significant GO biological process which is colored according to the -log10(p.adjust).
ColorectumMSI-HGO analysis - Figure of enriched GO biological processes: Top 15 enriched GO BP terms are showed in the bar plot of each disease state in each tissue. Each row represents a significant GO biological process which is colored according to the -log10(p.adjust).
ColorectumFAPGO analysis - Figure of enriched GO biological processes: Top 15 enriched GO BP terms are showed in the bar plot of each disease state in each tissue. Each row represents a significant GO biological process which is colored according to the -log10(p.adjust).
∗Top 15 enriched GO BP terms are showed in the bar plot of each disease state in each tissue. Each row represents a significant GO biological process which is colored according to the -log10(p.adjust).
Page: 1 2 3 4 5 6 7 8 9 

check button Enriched GO biological processes.
GO IDTissueDisease StageDescriptionGene RatioBg Ratiopvaluep.adjustCount
GO:003238618EsophagusESCCregulation of intracellular transport243/8552337/187233.20e-237.25e-21243
GO:1903829111EsophagusESCCpositive regulation of cellular protein localization199/8552276/187232.99e-193.45e-17199
GO:0033157110EsophagusESCCregulation of intracellular protein transport169/8552229/187233.31e-183.23e-16169
GO:0032388110EsophagusESCCpositive regulation of intracellular transport152/8552202/187237.89e-187.36e-16152
GO:1904951111EsophagusESCCpositive regulation of establishment of protein localization216/8552319/187231.01e-156.86e-14216
GO:009031617EsophagusESCCpositive regulation of intracellular protein transport122/8552160/187232.45e-151.49e-13122
GO:0051222111EsophagusESCCpositive regulation of protein transport204/8552303/187231.56e-148.38e-13204
GO:0070482111EsophagusESCCresponse to oxygen levels218/8552347/187236.91e-112.17e-09218
GO:0036293111EsophagusESCCresponse to decreased oxygen levels201/8552322/187238.37e-102.04e-08201
GO:0001666111EsophagusESCCresponse to hypoxia192/8552307/187231.59e-093.69e-08192
GO:003252714EsophagusESCCprotein exit from endoplasmic reticulum37/855248/187238.99e-068.65e-0537
GO:00700711EsophagusESCCproton-transporting two-sector ATPase complex assembly12/855215/187237.31e-032.63e-0212
GO:00708615EsophagusESCCregulation of protein exit from endoplasmic reticulum19/855227/187238.35e-032.95e-0219
GO:00512227LiverNAFLDpositive regulation of protein transport55/1882303/187231.07e-053.35e-0455
GO:19049517LiverNAFLDpositive regulation of establishment of protein localization55/1882319/187234.79e-051.14e-0355
GO:00903166LiverNAFLDpositive regulation of intracellular protein transport29/1882160/187231.24e-031.41e-0229
GO:00325273LiverNAFLDprotein exit from endoplasmic reticulum12/188248/187232.30e-032.19e-0212
GO:00331576LiverNAFLDregulation of intracellular protein transport37/1882229/187232.55e-032.36e-0237
GO:0070861LiverNAFLDregulation of protein exit from endoplasmic reticulum8/188227/187233.97e-033.34e-028
GO:00323866LiverNAFLDregulation of intracellular transport49/1882337/187235.34e-034.11e-0249
Page: 1 2 3 4 5 

check button Enriched KEGG pathways.
Pathway IDTissueDisease StageDescriptionGene RatioBg Ratiopvaluep.adjustqvalueCount
Page: 1 

Top

Cell-cell communication analysis

check buttonIdentification of potential cell-cell interactions between two cell types and their ligand-receptor pairs for different disease states
LigandReceptorLRpairPathwayTissueDisease Stage
Page: 1 

Top

Single-cell gene regulatory network inference analysis

check buttonFind out the significant the regulons (TFs) and the target genes of each regulon across cell types for different disease states
TFCell TypeTissueDisease StageTarget GeneRSSRegulon Activity
∗The dot plots of a searched regulon are shown for all cell subpopulations in each disease state of each tissue based on the regulon specific score inferred using pySCENIC and by calculating the average expression.
Page: 1 

Top

Somatic mutation of malignant transformation related genes

check buttonAnnotation of somatic variants for genes involved in malignant transformation
Hugo SymbolVariant ClassVariant ClassificationdbSNP RSHGVScHGVSpHGVSp ShortSWISSPROTBIOTYPESIFTPolyPhenTumor Sample BarcodeTissueHistologySexAgeStageTherapy TypesDrugsOutcome
TM9SF4SNVMissense_Mutationc.1532T>Cp.Phe511Serp.F511SQ92544protein_codingdeleterious(0)probably_damaging(1)TCGA-AC-A23H-01Breastbreast invasive carcinomaFemale>=65I/IIUnknownUnknownPD
TM9SF4SNVMissense_Mutationnovelc.1724C>Ap.Ser575Tyrp.S575YQ92544protein_codingdeleterious(0)probably_damaging(0.995)TCGA-AO-A03T-01Breastbreast invasive carcinomaFemale<65I/IIChemotherapycyclophosphamideSD
TM9SF4SNVMissense_Mutationc.1124G>Ap.Arg375Glnp.R375QQ92544protein_codingdeleterious(0.03)probably_damaging(0.972)TCGA-D8-A1XQ-01Breastbreast invasive carcinomaFemale>=65I/IIUnknownUnknownSD
TM9SF4insertionIn_Frame_Insnovelc.1375_1376insCTTTATATATATATTp.Ile459delinsThrLeuTyrIleTyrPhep.I459delinsTLYIYFQ92544protein_codingTCGA-A7-A0CJ-01Breastbreast invasive carcinomaFemale<65I/IIChemotherapycytoxanSD
TM9SF4insertionIn_Frame_Insnovelc.1292_1293insCTTTTTTTTGAGACGp.Leu431delinsPhePhePheLeuArgArgp.L431delinsFFFLRRQ92544protein_codingTCGA-AO-A0JB-01Breastbreast invasive carcinomaFemale<65III/IVChemotherapycyclophosphamideSD
TM9SF4SNVMissense_Mutationc.1444N>Tp.Arg482Cysp.R482CQ92544protein_codingdeleterious(0)probably_damaging(0.998)TCGA-A6-2686-01Colorectumcolon adenocarcinomaFemale>=65I/IIUnknownUnknownSD
TM9SF4SNVMissense_Mutationrs750795353c.1195C>Tp.Arg399Cysp.R399CQ92544protein_codingdeleterious(0)probably_damaging(1)TCGA-AA-3680-01Colorectumcolon adenocarcinomaFemale>=65III/IVChemotherapyfolinicPD
TM9SF4SNVMissense_Mutationc.1300T>Cp.Phe434Leup.F434LQ92544protein_codingtolerated(0.78)benign(0.323)TCGA-D5-6529-01Colorectumcolon adenocarcinomaMale>=65I/IIChemotherapyoxaliplatinum+SD
TM9SF4SNVMissense_Mutationrs777279514c.1912N>Ap.Ala638Thrp.A638TQ92544protein_codingdeleterious(0)possibly_damaging(0.835)TCGA-AG-4015-01Colorectumrectum adenocarcinomaFemale>=65I/IIUnknownUnknownSD
TM9SF4SNVMissense_Mutationc.1871N>Tp.Gly624Valp.G624VQ92544protein_codingdeleterious(0)probably_damaging(0.991)TCGA-AG-A01J-01Colorectumrectum adenocarcinomaFemale<65I/IIUnknownUnknownSD
Page: 1 2 3 4 5 6 

Top

Related drugs of malignant transformation related genes

check buttonIdentification of chemicals and drugs interact with genes involved in malignant transfromation
(DGIdb 4.0)
Entrez IDSymbolCategoryInteraction TypesDrug Claim NameDrug NamePMIDs
Page: 1