
|
|||||
|
 | |
| |
| |
| |
| |
| |
|
Gene: TM9SF2 |
Gene summary for TM9SF2 |
| Gene information | Species | Human | Gene symbol | TM9SF2 | Gene ID | 9375 |
| Gene name | transmembrane 9 superfamily member 2 | |
| Gene Alias | P76 | |
| Cytomap | 13q32.3 | |
| Gene Type | protein-coding | GO ID | GO:0008104 | UniProtAcc | A0A024QYR8 |
Top |
Malignant transformation analysis |
| Identification of the aberrant gene expression in precancerous and cancerous lesions by comparing the gene expression of stem-like cells in diseased tissues with normal stem cells |
| Entrez ID | Symbol | Replicates | Species | Organ | Tissue | Adj P-value | Log2FC | Malignancy |
| 9375 | TM9SF2 | HTA11_78_2000001011 | Human | Colorectum | AD | 2.04e-03 | 4.89e-01 | -0.1088 |
| 9375 | TM9SF2 | HTA11_347_2000001011 | Human | Colorectum | AD | 6.04e-10 | 5.64e-01 | -0.1954 |
| 9375 | TM9SF2 | HTA11_2992_2000001011 | Human | Colorectum | SER | 2.40e-02 | 5.02e-01 | -0.1706 |
| 9375 | TM9SF2 | HTA11_99999970781_79442 | Human | Colorectum | MSS | 4.12e-08 | 5.93e-01 | 0.294 |
| 9375 | TM9SF2 | HTA11_99999965062_69753 | Human | Colorectum | MSI-H | 3.21e-04 | 7.94e-01 | 0.3487 |
| 9375 | TM9SF2 | HTA11_99999965104_69814 | Human | Colorectum | MSS | 6.01e-14 | 1.05e+00 | 0.281 |
| 9375 | TM9SF2 | HTA11_99999971662_82457 | Human | Colorectum | MSS | 1.78e-08 | 7.69e-01 | 0.3859 |
| 9375 | TM9SF2 | A015-C-203 | Human | Colorectum | FAP | 5.06e-18 | -3.11e-01 | -0.1294 |
| 9375 | TM9SF2 | A015-C-204 | Human | Colorectum | FAP | 3.38e-04 | -2.88e-01 | -0.0228 |
| 9375 | TM9SF2 | A002-C-201 | Human | Colorectum | FAP | 1.35e-07 | -2.93e-01 | 0.0324 |
| 9375 | TM9SF2 | A001-C-119 | Human | Colorectum | FAP | 1.66e-03 | -2.49e-01 | -0.1557 |
| 9375 | TM9SF2 | A001-C-108 | Human | Colorectum | FAP | 1.57e-13 | -2.20e-01 | -0.0272 |
| 9375 | TM9SF2 | A002-C-205 | Human | Colorectum | FAP | 1.51e-12 | -3.25e-01 | -0.1236 |
| 9375 | TM9SF2 | A015-C-006 | Human | Colorectum | FAP | 1.48e-07 | -2.98e-01 | -0.0994 |
| 9375 | TM9SF2 | A015-C-106 | Human | Colorectum | FAP | 9.85e-10 | -2.45e-01 | -0.0511 |
| 9375 | TM9SF2 | A002-C-114 | Human | Colorectum | FAP | 4.81e-10 | -3.72e-01 | -0.1561 |
| 9375 | TM9SF2 | A015-C-104 | Human | Colorectum | FAP | 1.83e-20 | -3.68e-01 | -0.1899 |
| 9375 | TM9SF2 | A001-C-014 | Human | Colorectum | FAP | 1.54e-07 | -2.13e-01 | 0.0135 |
| 9375 | TM9SF2 | A002-C-016 | Human | Colorectum | FAP | 4.76e-14 | -2.61e-01 | 0.0521 |
| 9375 | TM9SF2 | A015-C-002 | Human | Colorectum | FAP | 1.40e-04 | -2.93e-01 | -0.0763 |
| Page: 1 2 3 4 5 6 7 8 9 |
| Tissue | Expression Dynamics | Abbreviation |
| Colorectum (GSE201348) |  | FAP: Familial adenomatous polyposis |
| CRC: Colorectal cancer | ||
| Colorectum (HTA11) |  | AD: Adenomas |
| SER: Sessile serrated lesions | ||
| MSI-H: Microsatellite-high colorectal cancer | ||
| MSS: Microsatellite stable colorectal cancer | ||
| Esophagus |  | ESCC: Esophageal squamous cell carcinoma |
| HGIN: High-grade intraepithelial neoplasias | ||
| LGIN: Low-grade intraepithelial neoplasias | ||
| Liver |  | HCC: Hepatocellular carcinoma |
| NAFLD: Non-alcoholic fatty liver disease | ||
| Oral Cavity | 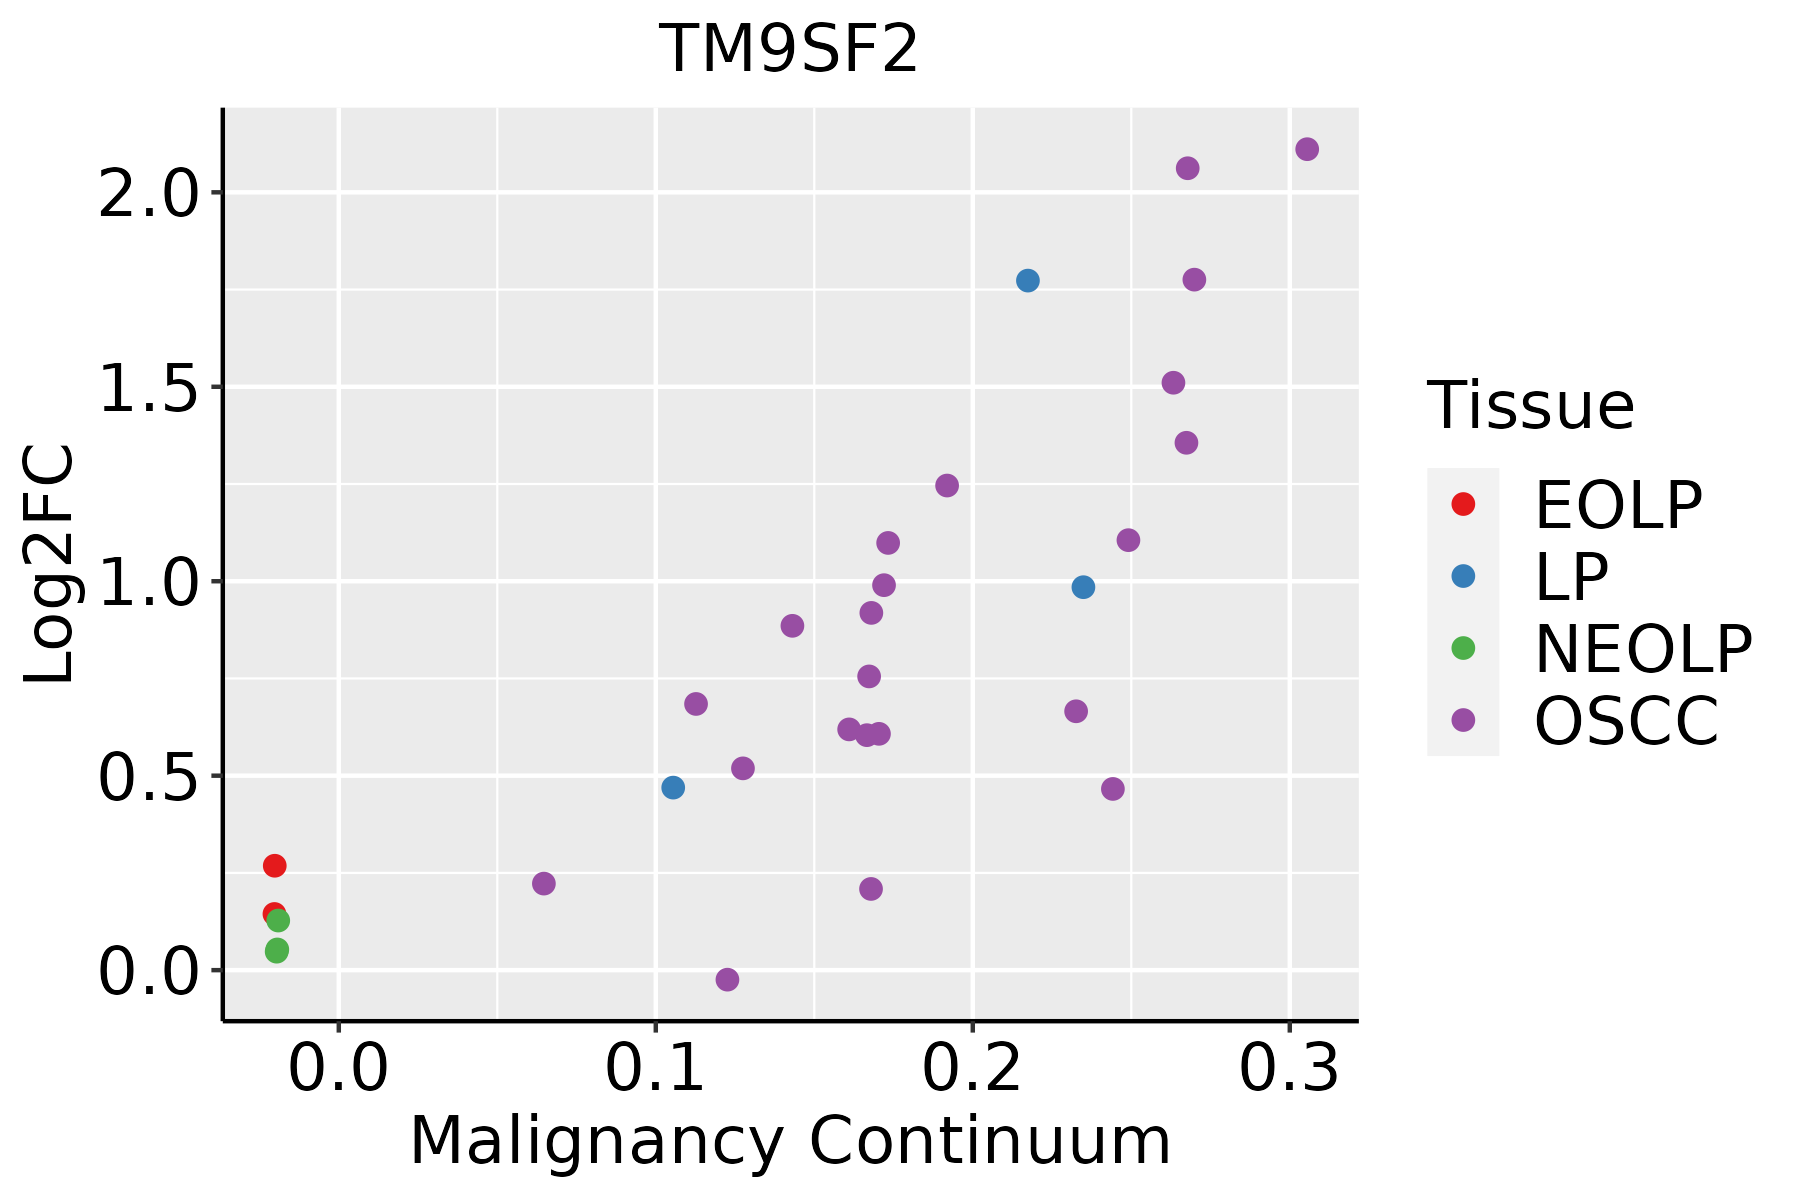 | EOLP: Erosive Oral lichen planus |
| LP: leukoplakia | ||
| NEOLP: Non-erosive oral lichen planus | ||
| OSCC: Oral squamous cell carcinoma | ||
| Prostate | 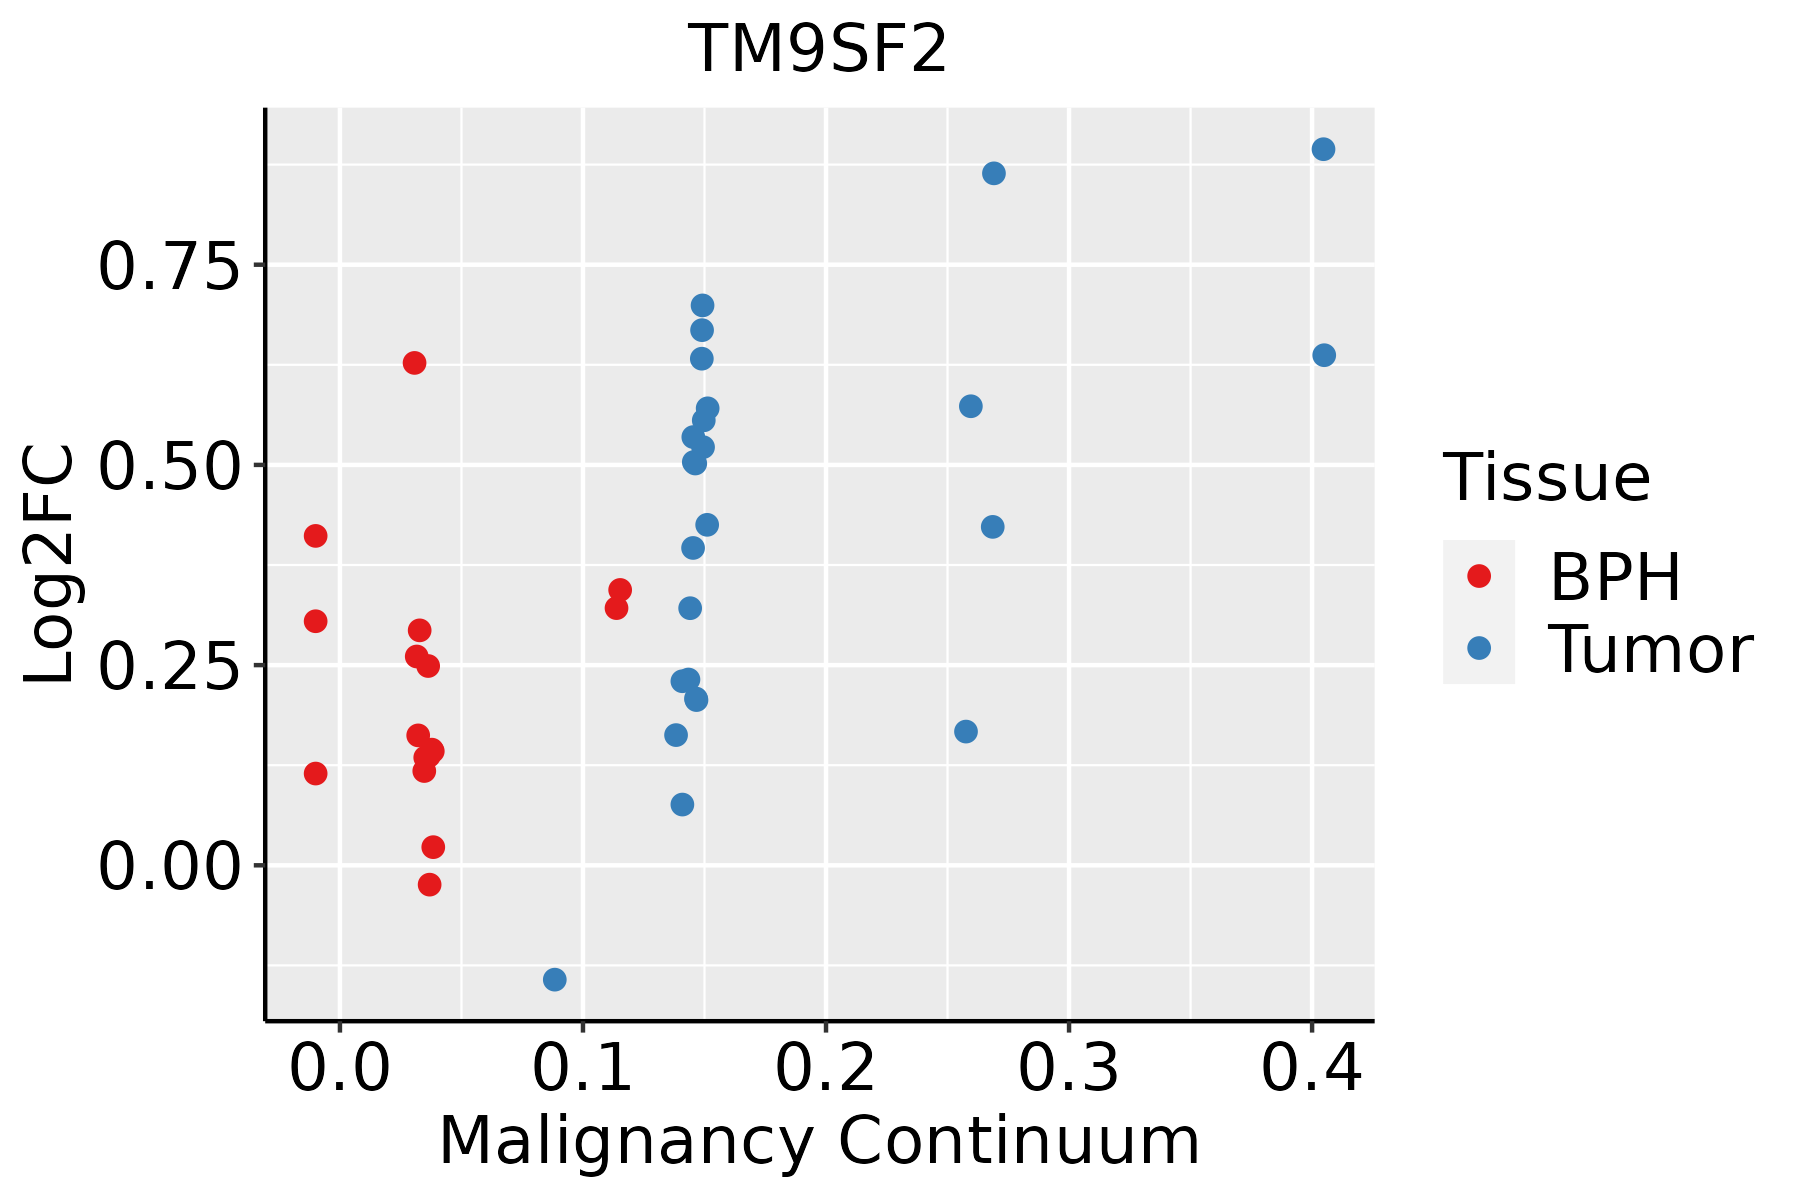 | BPH: Benign Prostatic Hyperplasia |
| Skin | 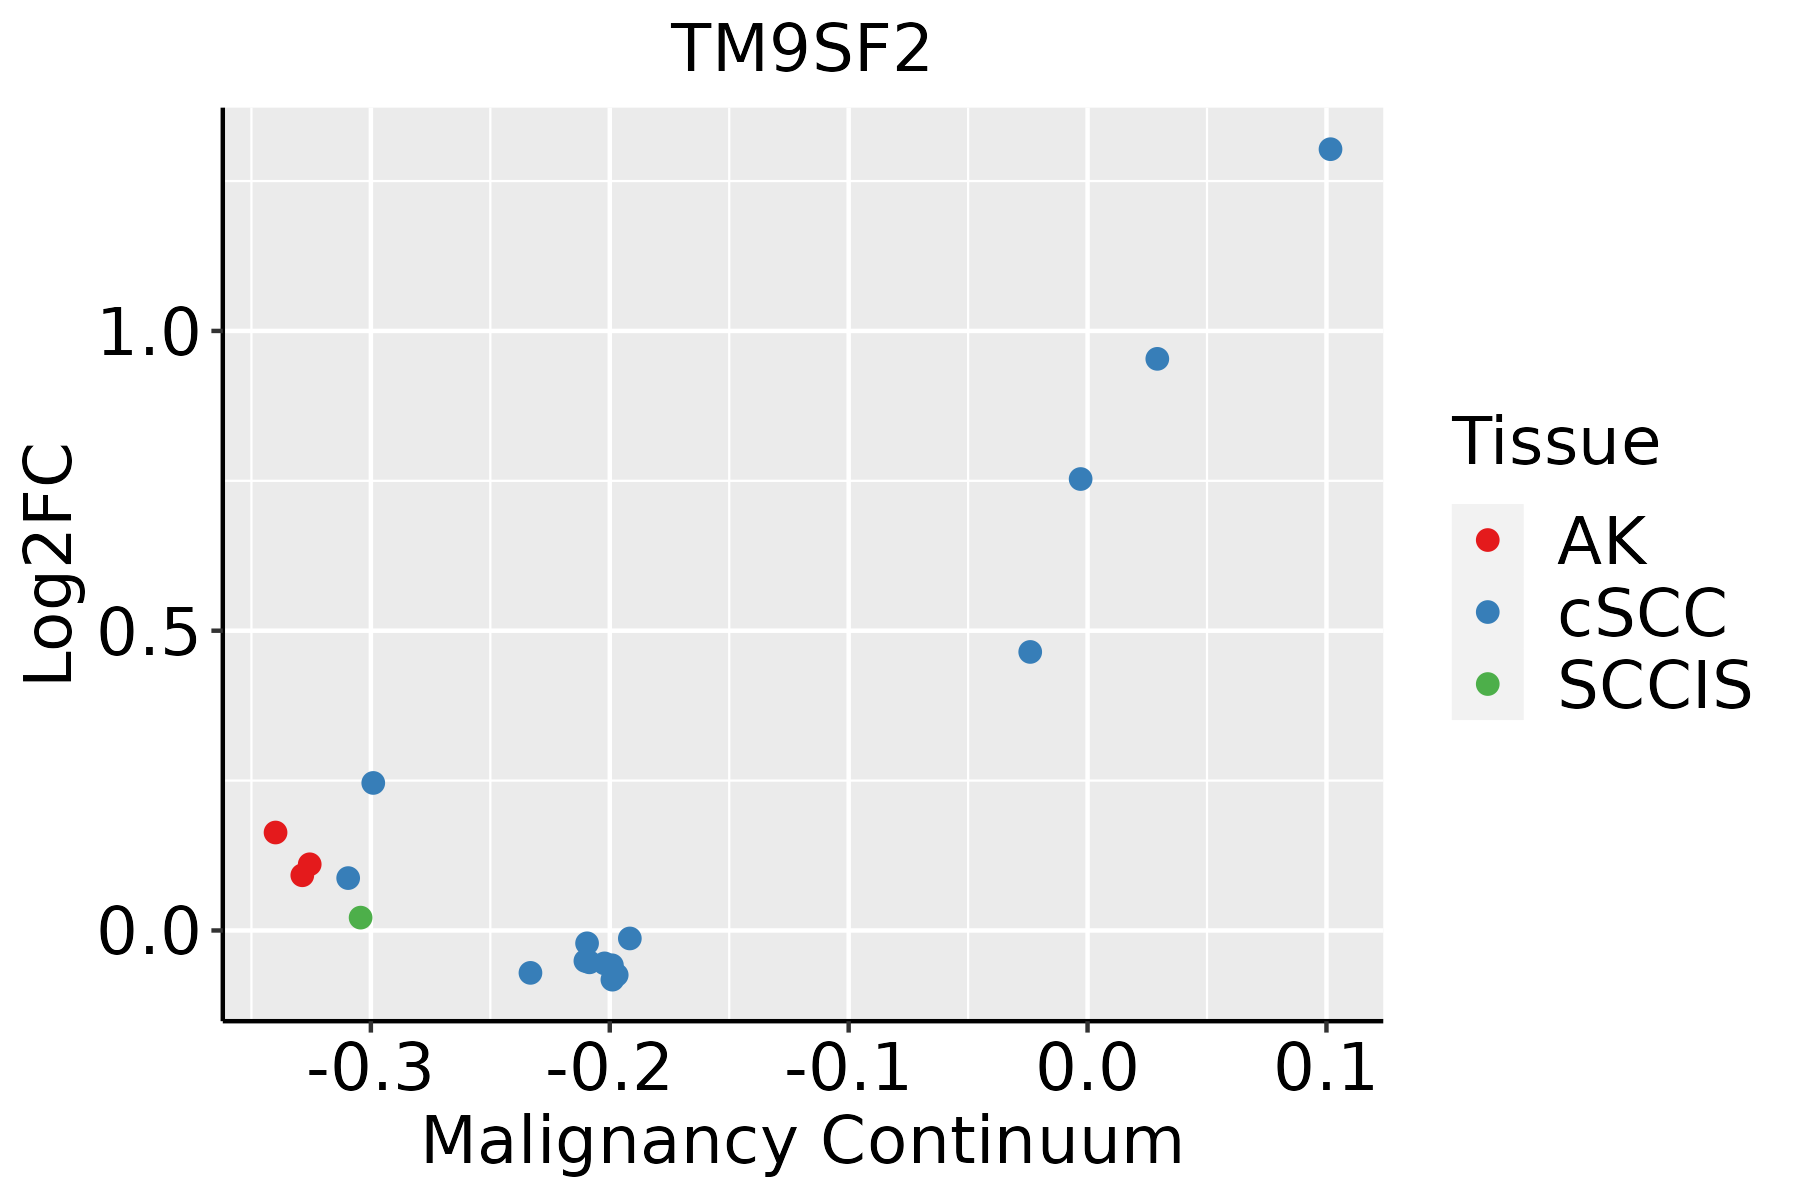 | AK: Actinic keratosis |
| cSCC: Cutaneous squamous cell carcinoma | ||
| SCCIS:squamous cell carcinoma in situ | ||
| Thyroid | 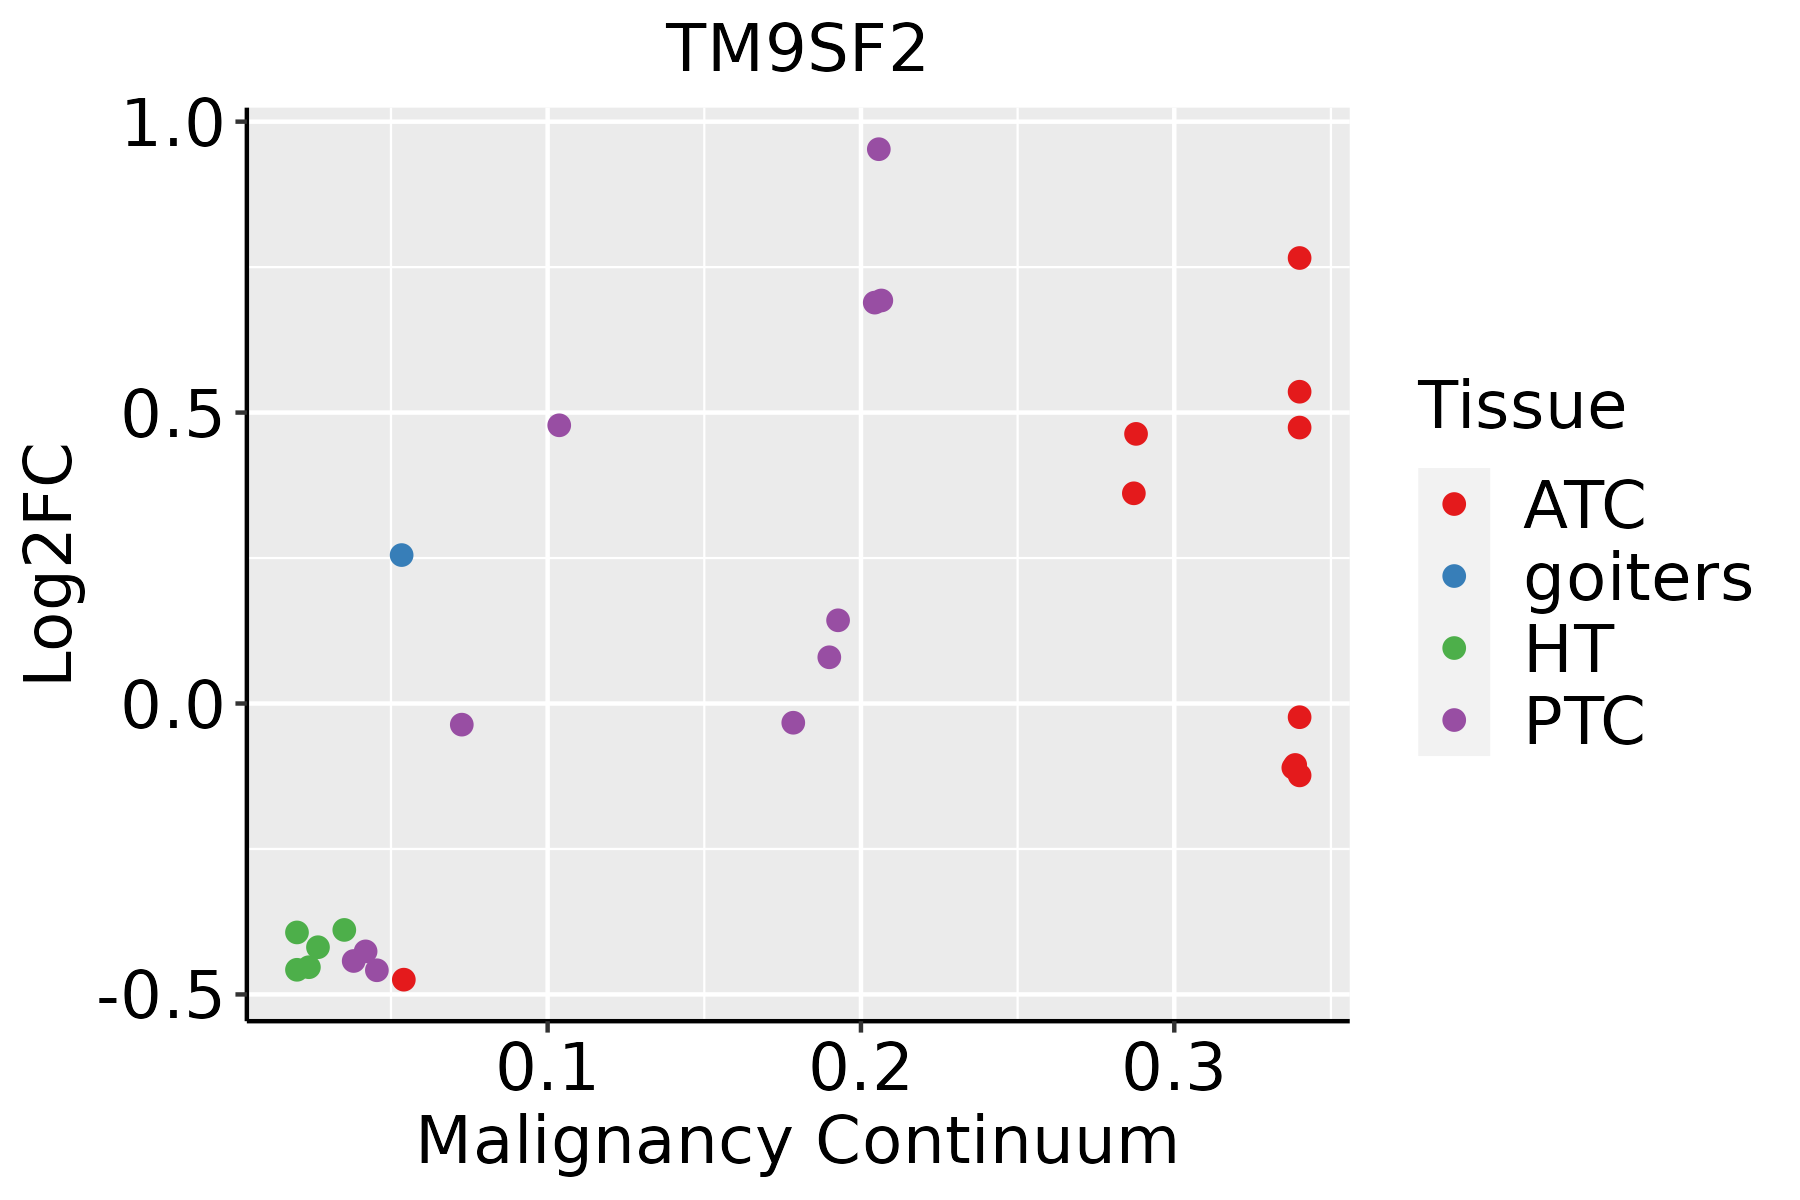 | ATC: Anaplastic thyroid cancer |
| HT: Hashimoto's thyroiditis | ||
| PTC: Papillary thyroid cancer |
| ∗log2FC in expression of this searched gene in stem-like cells from each diseased tissue sample relative to stem-like cells in normal samples in each tissue plotted against the malignancy continuum. Samples are colored based on if they are from different disease stage. |
Top |
Malignant transformation related pathway analysis |
| Find out the enriched GO biological processes and KEGG pathways involved in transition from healthy to precancer to cancer |
| Tissue | Disease Stage | Enriched GO biological Processes |
| Colorectum | AD |  |
| Colorectum | SER |  |
| Colorectum | MSS |  |
| Colorectum | MSI-H |  |
| Colorectum | FAP |  |
| ∗Top 15 enriched GO BP terms are showed in the bar plot of each disease state in each tissue. Each row represents a significant GO biological process which is colored according to the -log10(p.adjust). |
| Page: 1 2 3 4 5 6 7 8 9 |
| GO ID | Tissue | Disease Stage | Description | Gene Ratio | Bg Ratio | pvalue | p.adjust | Count |
| Page: 1 |
| Pathway ID | Tissue | Disease Stage | Description | Gene Ratio | Bg Ratio | pvalue | p.adjust | qvalue | Count |
| Page: 1 |
Top |
Cell-cell communication analysis |
| Identification of potential cell-cell interactions between two cell types and their ligand-receptor pairs for different disease states |
| Ligand | Receptor | LRpair | Pathway | Tissue | Disease Stage |
| Page: 1 |
Top |
Single-cell gene regulatory network inference analysis |
| Find out the significant the regulons (TFs) and the target genes of each regulon across cell types for different disease states |
| TF | Cell Type | Tissue | Disease Stage | Target Gene | RSS | Regulon Activity |
| ∗The dot plots of a searched regulon are shown for all cell subpopulations in each disease state of each tissue based on the regulon specific score inferred using pySCENIC and by calculating the average expression. |
| Page: 1 |
Top |
Somatic mutation of malignant transformation related genes |
| Annotation of somatic variants for genes involved in malignant transformation |
| Hugo Symbol | Variant Class | Variant Classification | dbSNP RS | HGVSc | HGVSp | HGVSp Short | SWISSPROT | BIOTYPE | SIFT | PolyPhen | Tumor Sample Barcode | Tissue | Histology | Sex | Age | Stage | Therapy Types | Drugs | Outcome |
| TM9SF2 | SNV | Missense_Mutation | c.949A>G | p.Met317Val | p.M317V | Q99805 | protein_coding | deleterious(0.02) | benign(0.088) | TCGA-AO-A128-01 | Breast | breast invasive carcinoma | Female | <65 | I/II | Chemotherapy | doxorubicin | SD | |
| TM9SF2 | SNV | Missense_Mutation | c.172N>A | p.Ala58Thr | p.A58T | Q99805 | protein_coding | tolerated(0.18) | benign(0) | TCGA-BH-A0HF-01 | Breast | breast invasive carcinoma | Female | >=65 | I/II | Hormone Therapy | arimidex | SD | |
| TM9SF2 | SNV | Missense_Mutation | c.610N>C | p.Asp204His | p.D204H | Q99805 | protein_coding | deleterious(0.03) | benign(0.144) | TCGA-BH-A1ES-06 | Breast | breast invasive carcinoma | Female | <65 | I/II | Unknown | Unknown | PD | |
| TM9SF2 | SNV | Missense_Mutation | c.1815N>G | p.Ile605Met | p.I605M | Q99805 | protein_coding | tolerated(0.18) | benign(0.213) | TCGA-D8-A27G-01 | Breast | breast invasive carcinoma | Female | >=65 | I/II | Unknown | Unknown | SD | |
| TM9SF2 | deletion | Frame_Shift_Del | c.1074_1102delNNNNNNNNNNNNNNNNNNNNNNNNNNNNN | p.Pro359SerfsTer55 | p.P359Sfs*55 | Q99805 | protein_coding | TCGA-AN-A0XU-01 | Breast | breast invasive carcinoma | Female | <65 | I/II | Unknown | Unknown | SD | |||
| TM9SF2 | SNV | Missense_Mutation | novel | c.337A>G | p.Thr113Ala | p.T113A | Q99805 | protein_coding | tolerated(0.43) | benign(0.009) | TCGA-2W-A8YY-01 | Cervix | cervical & endocervical cancer | Female | <65 | I/II | Chemotherapy | cisplatin | CR |
| TM9SF2 | SNV | Missense_Mutation | novel | c.1097C>T | p.Ser366Leu | p.S366L | Q99805 | protein_coding | deleterious(0.03) | possibly_damaging(0.904) | TCGA-MA-AA41-01 | Cervix | cervical & endocervical cancer | Female | <65 | I/II | Unknown | Unknown | SD |
| TM9SF2 | SNV | Missense_Mutation | novel | c.1178C>T | p.Pro393Leu | p.P393L | Q99805 | protein_coding | deleterious(0.02) | probably_damaging(0.924) | TCGA-MA-AA42-01 | Cervix | cervical & endocervical cancer | Female | >=65 | I/II | Unknown | Unknown | SD |
| TM9SF2 | insertion | Frame_Shift_Ins | novel | c.426_427insA | p.Ser145LysfsTer14 | p.S145Kfs*14 | Q99805 | protein_coding | TCGA-EA-A410-01 | Cervix | cervical & endocervical cancer | Female | <65 | I/II | Unknown | Unknown | SD | ||
| TM9SF2 | SNV | Missense_Mutation | c.1534N>T | p.Pro512Ser | p.P512S | Q99805 | protein_coding | deleterious(0) | probably_damaging(0.982) | TCGA-AA-3510-01 | Colorectum | colon adenocarcinoma | Male | >=65 | I/II | Unknown | Unknown | SD |
| Page: 1 2 3 4 5 6 7 8 |
Top |
Related drugs of malignant transformation related genes |
| Identification of chemicals and drugs interact with genes involved in malignant transfromation |
| (DGIdb 4.0) |
| Entrez ID | Symbol | Category | Interaction Types | Drug Claim Name | Drug Name | PMIDs |
| Page: 1 |

Copyright 2023-Present -The University of Texas Health Science Center at Houston |