
|
|||||
|
 | |
| |
| |
| |
| |
| |
|
Gene: TM9SF1 |
Gene summary for TM9SF1 |
| Gene information | Species | Human | Gene symbol | TM9SF1 | Gene ID | 10548 |
| Gene name | transmembrane 9 superfamily member 1 | |
| Gene Alias | HMP70 | |
| Cytomap | 14q12 | |
| Gene Type | protein-coding | GO ID | GO:0006914 | UniProtAcc | O15321 |
Top |
Malignant transformation analysis |
| Identification of the aberrant gene expression in precancerous and cancerous lesions by comparing the gene expression of stem-like cells in diseased tissues with normal stem cells |
| Entrez ID | Symbol | Replicates | Species | Organ | Tissue | Adj P-value | Log2FC | Malignancy |
| 10548 | TM9SF1 | LZE2D | Human | Esophagus | HGIN | 3.64e-03 | 3.63e-01 | 0.0642 |
| 10548 | TM9SF1 | LZE2T | Human | Esophagus | ESCC | 9.54e-06 | 5.92e-01 | 0.082 |
| 10548 | TM9SF1 | LZE3D | Human | Esophagus | HGIN | 6.21e-05 | 9.10e-01 | 0.0668 |
| 10548 | TM9SF1 | LZE4T | Human | Esophagus | ESCC | 1.39e-20 | 5.15e-01 | 0.0811 |
| 10548 | TM9SF1 | LZE5T | Human | Esophagus | ESCC | 1.00e-09 | 4.74e-01 | 0.0514 |
| 10548 | TM9SF1 | LZE7T | Human | Esophagus | ESCC | 6.13e-07 | 3.02e-01 | 0.0667 |
| 10548 | TM9SF1 | LZE8T | Human | Esophagus | ESCC | 2.41e-13 | 3.70e-01 | 0.067 |
| 10548 | TM9SF1 | LZE20T | Human | Esophagus | ESCC | 8.11e-14 | 4.12e-01 | 0.0662 |
| 10548 | TM9SF1 | LZE21D1 | Human | Esophagus | HGIN | 4.41e-04 | 4.09e-01 | 0.0632 |
| 10548 | TM9SF1 | LZE22T | Human | Esophagus | ESCC | 1.15e-08 | 4.25e-01 | 0.068 |
| 10548 | TM9SF1 | LZE24D1 | Human | Esophagus | HGIN | 3.66e-03 | 5.69e-01 | 0.054 |
| 10548 | TM9SF1 | LZE24T | Human | Esophagus | ESCC | 3.85e-38 | 8.78e-01 | 0.0596 |
| 10548 | TM9SF1 | LZE22D3 | Human | Esophagus | HGIN | 1.73e-02 | 3.47e-01 | 0.0653 |
| 10548 | TM9SF1 | LZE21T | Human | Esophagus | ESCC | 1.97e-09 | 4.74e-01 | 0.0655 |
| 10548 | TM9SF1 | LZE6T | Human | Esophagus | ESCC | 3.41e-18 | 5.87e-01 | 0.0845 |
| 10548 | TM9SF1 | P1T-E | Human | Esophagus | ESCC | 1.98e-11 | 7.21e-01 | 0.0875 |
| 10548 | TM9SF1 | P2T-E | Human | Esophagus | ESCC | 1.07e-44 | 7.15e-01 | 0.1177 |
| 10548 | TM9SF1 | P4T-E | Human | Esophagus | ESCC | 8.46e-47 | 8.30e-01 | 0.1323 |
| 10548 | TM9SF1 | P5T-E | Human | Esophagus | ESCC | 1.78e-20 | 4.33e-01 | 0.1327 |
| 10548 | TM9SF1 | P8T-E | Human | Esophagus | ESCC | 8.43e-63 | 9.27e-01 | 0.0889 |
| Page: 1 2 3 4 5 |
| Tissue | Expression Dynamics | Abbreviation |
| Esophagus | 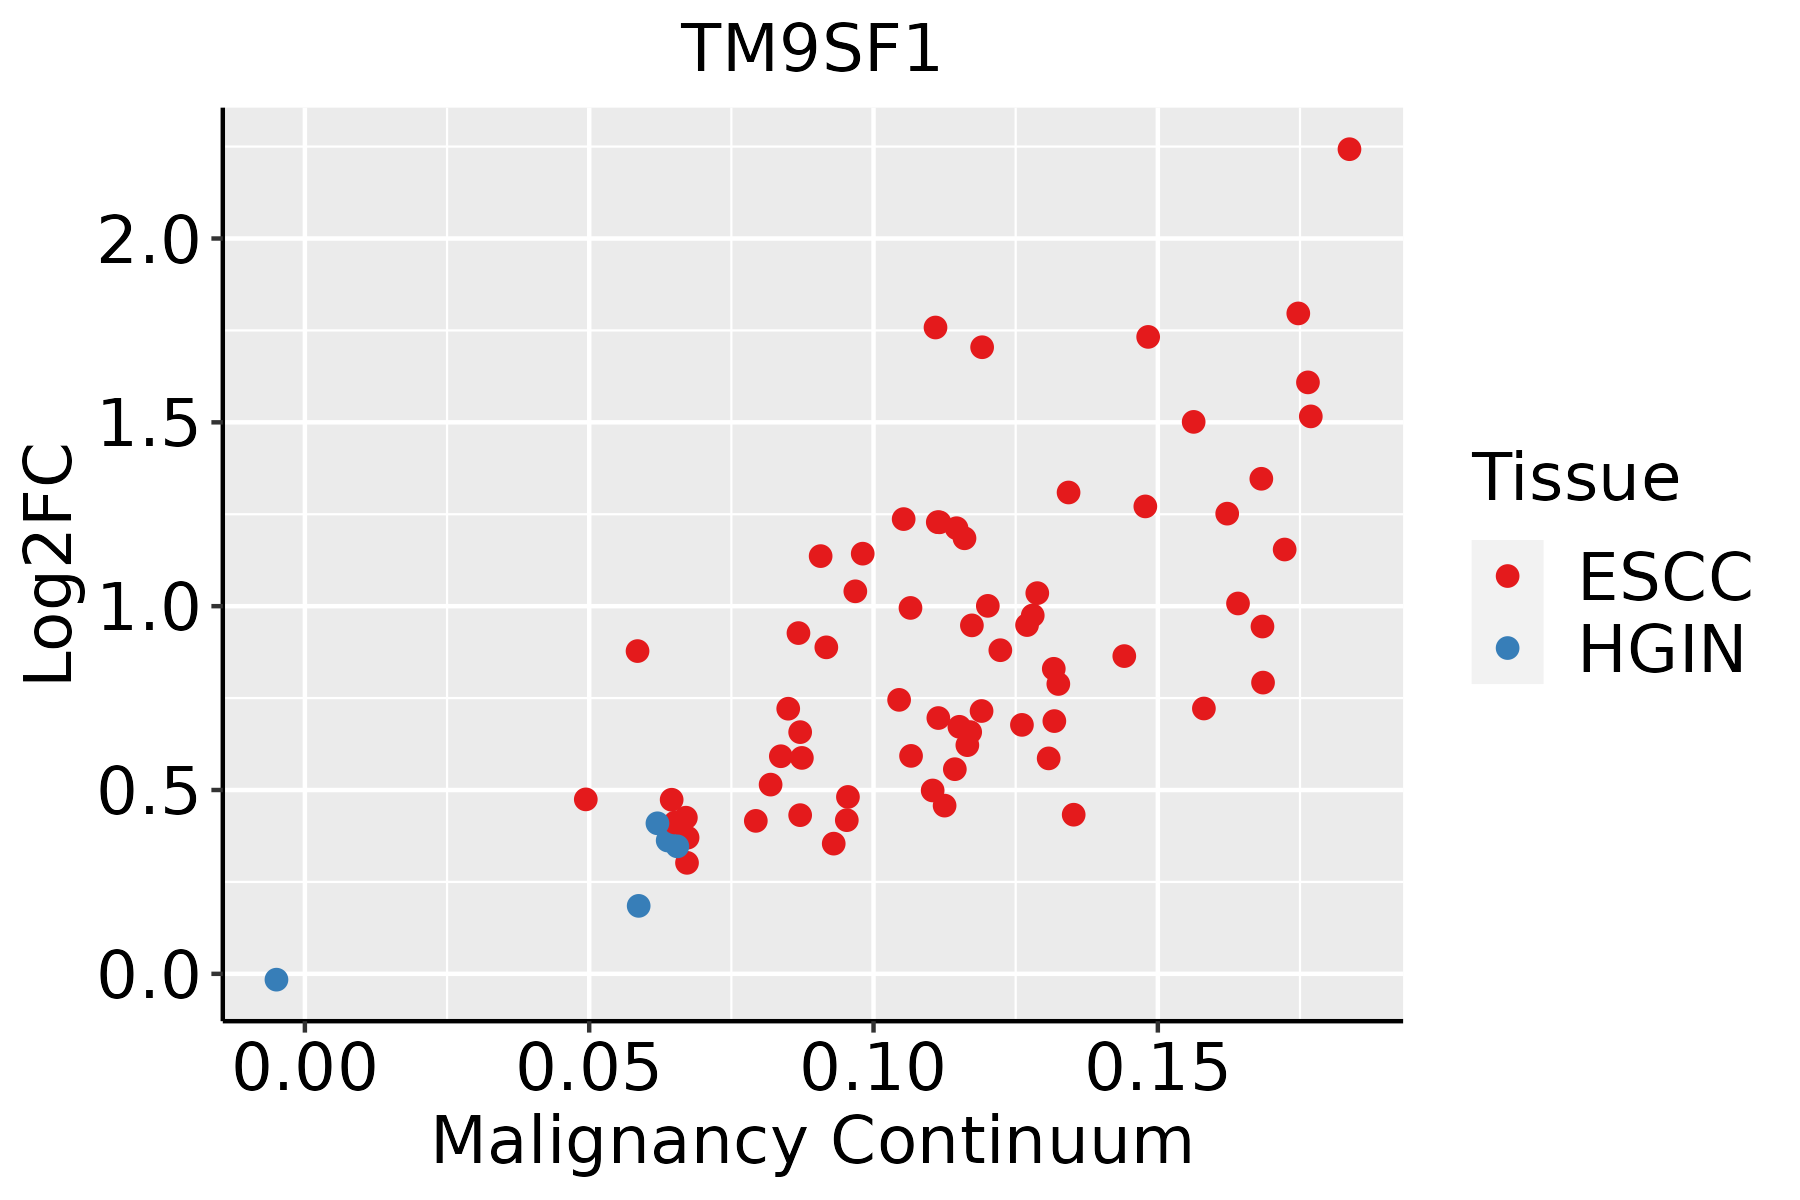 | ESCC: Esophageal squamous cell carcinoma |
| HGIN: High-grade intraepithelial neoplasias | ||
| LGIN: Low-grade intraepithelial neoplasias | ||
| Liver |  | HCC: Hepatocellular carcinoma |
| NAFLD: Non-alcoholic fatty liver disease |
| ∗log2FC in expression of this searched gene in stem-like cells from each diseased tissue sample relative to stem-like cells in normal samples in each tissue plotted against the malignancy continuum. Samples are colored based on if they are from different disease stage. |
Top |
Malignant transformation related pathway analysis |
| Find out the enriched GO biological processes and KEGG pathways involved in transition from healthy to precancer to cancer |
| Tissue | Disease Stage | Enriched GO biological Processes |
| Colorectum | AD |  |
| Colorectum | SER |  |
| Colorectum | MSS |  |
| Colorectum | MSI-H |  |
| Colorectum | FAP |  |
| ∗Top 15 enriched GO BP terms are showed in the bar plot of each disease state in each tissue. Each row represents a significant GO biological process which is colored according to the -log10(p.adjust). |
| Page: 1 2 3 4 5 6 7 8 9 |
| GO ID | Tissue | Disease Stage | Description | Gene Ratio | Bg Ratio | pvalue | p.adjust | Count |
| Page: 1 |
| Pathway ID | Tissue | Disease Stage | Description | Gene Ratio | Bg Ratio | pvalue | p.adjust | qvalue | Count |
| Page: 1 |
Top |
Cell-cell communication analysis |
| Identification of potential cell-cell interactions between two cell types and their ligand-receptor pairs for different disease states |
| Ligand | Receptor | LRpair | Pathway | Tissue | Disease Stage |
| Page: 1 |
Top |
Single-cell gene regulatory network inference analysis |
| Find out the significant the regulons (TFs) and the target genes of each regulon across cell types for different disease states |
| TF | Cell Type | Tissue | Disease Stage | Target Gene | RSS | Regulon Activity |
| ∗The dot plots of a searched regulon are shown for all cell subpopulations in each disease state of each tissue based on the regulon specific score inferred using pySCENIC and by calculating the average expression. |
| Page: 1 |
Top |
Somatic mutation of malignant transformation related genes |
| Annotation of somatic variants for genes involved in malignant transformation |
| Hugo Symbol | Variant Class | Variant Classification | dbSNP RS | HGVSc | HGVSp | HGVSp Short | SWISSPROT | BIOTYPE | SIFT | PolyPhen | Tumor Sample Barcode | Tissue | Histology | Sex | Age | Stage | Therapy Types | Drugs | Outcome |
| TM9SF1 | SNV | Missense_Mutation | c.208N>A | p.Glu70Lys | p.E70K | O15321 | protein_coding | tolerated(0.23) | benign(0.02) | TCGA-A8-A08L-01 | Breast | breast invasive carcinoma | Female | >=65 | III/IV | Unknown | Unknown | SD | |
| TM9SF1 | SNV | Missense_Mutation | novel | c.22C>G | p.Arg8Gly | p.R8G | O15321 | protein_coding | tolerated_low_confidence(0.12) | benign(0) | TCGA-AC-A6IX-01 | Breast | breast invasive carcinoma | Female | <65 | III/IV | Unknown | Unknown | SD |
| TM9SF1 | SNV | Missense_Mutation | c.1807N>G | p.Leu603Val | p.L603V | O15321 | protein_coding | tolerated(0.41) | benign(0.011) | TCGA-BH-A0BZ-01 | Breast | breast invasive carcinoma | Female | <65 | III/IV | Chemotherapy | doxorubicin | CR | |
| TM9SF1 | insertion | In_Frame_Ins | novel | c.505_506insGGCTGGAAAATTATCCATACAGATGTCTTCCGCTTCCCCCCATAC | p.Phe169delinsTrpLeuGluAsnTyrProTyrArgCysLeuProLeuProProIleLeu | p.F169delinsWLENYPYRCLPLPPIL | O15321 | protein_coding | TCGA-A2-A04X-01 | Breast | breast invasive carcinoma | Female | <65 | I/II | Chemotherapy | adriamycin | SD | ||
| TM9SF1 | insertion | Nonsense_Mutation | novel | c.828_829insATAACAAAAAATTAGCCGGGCATGGTGGTTCACATCTGTAA | p.Ala277IlefsTer5 | p.A277Ifs*5 | O15321 | protein_coding | TCGA-A8-A06X-01 | Breast | breast invasive carcinoma | Female | >=65 | I/II | Unknown | Unknown | SD | ||
| TM9SF1 | SNV | Missense_Mutation | novel | c.282N>C | p.Glu94Asp | p.E94D | O15321 | protein_coding | tolerated(0.57) | benign(0.001) | TCGA-JW-A5VL-01 | Cervix | cervical & endocervical cancer | Female | <65 | I/II | Unknown | Unknown | SD |
| TM9SF1 | SNV | Missense_Mutation | c.1408N>C | p.Gly470Arg | p.G470R | O15321 | protein_coding | deleterious(0) | probably_damaging(0.986) | TCGA-Q1-A5R2-01 | Cervix | cervical & endocervical cancer | Female | <65 | I/II | Chemotherapy | cisplatin | PR | |
| TM9SF1 | SNV | Missense_Mutation | novel | c.1789N>T | p.Arg597Trp | p.R597W | O15321 | protein_coding | deleterious(0) | benign(0.43) | TCGA-A6-2686-01 | Colorectum | colon adenocarcinoma | Female | >=65 | I/II | Unknown | Unknown | SD |
| TM9SF1 | SNV | Missense_Mutation | novel | c.1337G>A | p.Arg446His | p.R446H | O15321 | protein_coding | deleterious(0.04) | probably_damaging(0.946) | TCGA-A6-5665-01 | Colorectum | colon adenocarcinoma | Female | >=65 | I/II | Unknown | Unknown | PD |
| TM9SF1 | SNV | Missense_Mutation | c.1144N>G | p.Leu382Val | p.L382V | O15321 | protein_coding | deleterious(0.03) | benign(0.377) | TCGA-AA-3530-01 | Colorectum | colon adenocarcinoma | Male | >=65 | I/II | Unknown | Unknown | SD |
| Page: 1 2 3 4 5 6 7 |
Top |
Related drugs of malignant transformation related genes |
| Identification of chemicals and drugs interact with genes involved in malignant transfromation |
| (DGIdb 4.0) |
| Entrez ID | Symbol | Category | Interaction Types | Drug Claim Name | Drug Name | PMIDs |
| Page: 1 |

Copyright 2023-Present -The University of Texas Health Science Center at Houston |