
|
|||||
|
 | |
| |
| |
| |
| |
| |
|
Gene: TM7SF3 |
Gene summary for TM7SF3 |
| Gene information | Species | Human | Gene symbol | TM7SF3 | Gene ID | 51768 |
| Gene name | transmembrane 7 superfamily member 3 | |
| Gene Alias | TM7SF3 | |
| Cytomap | 12p11.23 | |
| Gene Type | protein-coding | GO ID | GO:0002790 | UniProtAcc | Q9NS93 |
Top |
Malignant transformation analysis |
| Identification of the aberrant gene expression in precancerous and cancerous lesions by comparing the gene expression of stem-like cells in diseased tissues with normal stem cells |
| Entrez ID | Symbol | Replicates | Species | Organ | Tissue | Adj P-value | Log2FC | Malignancy |
| 51768 | TM7SF3 | HTA11_1938_2000001011 | Human | Colorectum | AD | 1.54e-06 | 5.60e-01 | -0.0811 |
| 51768 | TM7SF3 | HTA11_347_2000001011 | Human | Colorectum | AD | 4.91e-07 | 4.05e-01 | -0.1954 |
| 51768 | TM7SF3 | HTA11_1391_2000001011 | Human | Colorectum | AD | 5.14e-06 | 6.19e-01 | -0.059 |
| 51768 | TM7SF3 | HTA11_99999965062_69753 | Human | Colorectum | MSI-H | 4.16e-04 | 9.99e-01 | 0.3487 |
| 51768 | TM7SF3 | HTA11_99999965104_69814 | Human | Colorectum | MSS | 3.78e-02 | 4.12e-01 | 0.281 |
| 51768 | TM7SF3 | A015-C-203 | Human | Colorectum | FAP | 3.73e-13 | -2.80e-01 | -0.1294 |
| 51768 | TM7SF3 | A015-C-204 | Human | Colorectum | FAP | 4.84e-02 | -2.04e-01 | -0.0228 |
| 51768 | TM7SF3 | A002-C-201 | Human | Colorectum | FAP | 3.28e-05 | -2.08e-01 | 0.0324 |
| 51768 | TM7SF3 | A001-C-119 | Human | Colorectum | FAP | 1.95e-02 | -2.55e-01 | -0.1557 |
| 51768 | TM7SF3 | A001-C-108 | Human | Colorectum | FAP | 1.50e-06 | -1.62e-01 | -0.0272 |
| 51768 | TM7SF3 | A002-C-205 | Human | Colorectum | FAP | 3.28e-08 | -2.55e-01 | -0.1236 |
| 51768 | TM7SF3 | A001-C-104 | Human | Colorectum | FAP | 1.75e-02 | -1.83e-01 | 0.0184 |
| 51768 | TM7SF3 | A015-C-006 | Human | Colorectum | FAP | 4.26e-03 | -1.46e-01 | -0.0994 |
| 51768 | TM7SF3 | A015-C-106 | Human | Colorectum | FAP | 4.69e-06 | -1.06e-01 | -0.0511 |
| 51768 | TM7SF3 | A002-C-114 | Human | Colorectum | FAP | 2.49e-06 | -2.36e-01 | -0.1561 |
| 51768 | TM7SF3 | A015-C-104 | Human | Colorectum | FAP | 6.55e-12 | -2.39e-01 | -0.1899 |
| 51768 | TM7SF3 | A001-C-014 | Human | Colorectum | FAP | 1.38e-10 | -2.30e-01 | 0.0135 |
| 51768 | TM7SF3 | A002-C-016 | Human | Colorectum | FAP | 7.31e-07 | -1.47e-01 | 0.0521 |
| 51768 | TM7SF3 | A015-C-002 | Human | Colorectum | FAP | 1.44e-02 | -2.29e-01 | -0.0763 |
| 51768 | TM7SF3 | A001-C-203 | Human | Colorectum | FAP | 8.77e-07 | -1.55e-01 | -0.0481 |
| Page: 1 2 3 4 5 6 7 8 9 |
| Tissue | Expression Dynamics | Abbreviation |
| Colorectum (GSE201348) |  | FAP: Familial adenomatous polyposis |
| CRC: Colorectal cancer | ||
| Colorectum (HTA11) |  | AD: Adenomas |
| SER: Sessile serrated lesions | ||
| MSI-H: Microsatellite-high colorectal cancer | ||
| MSS: Microsatellite stable colorectal cancer | ||
| Esophagus | 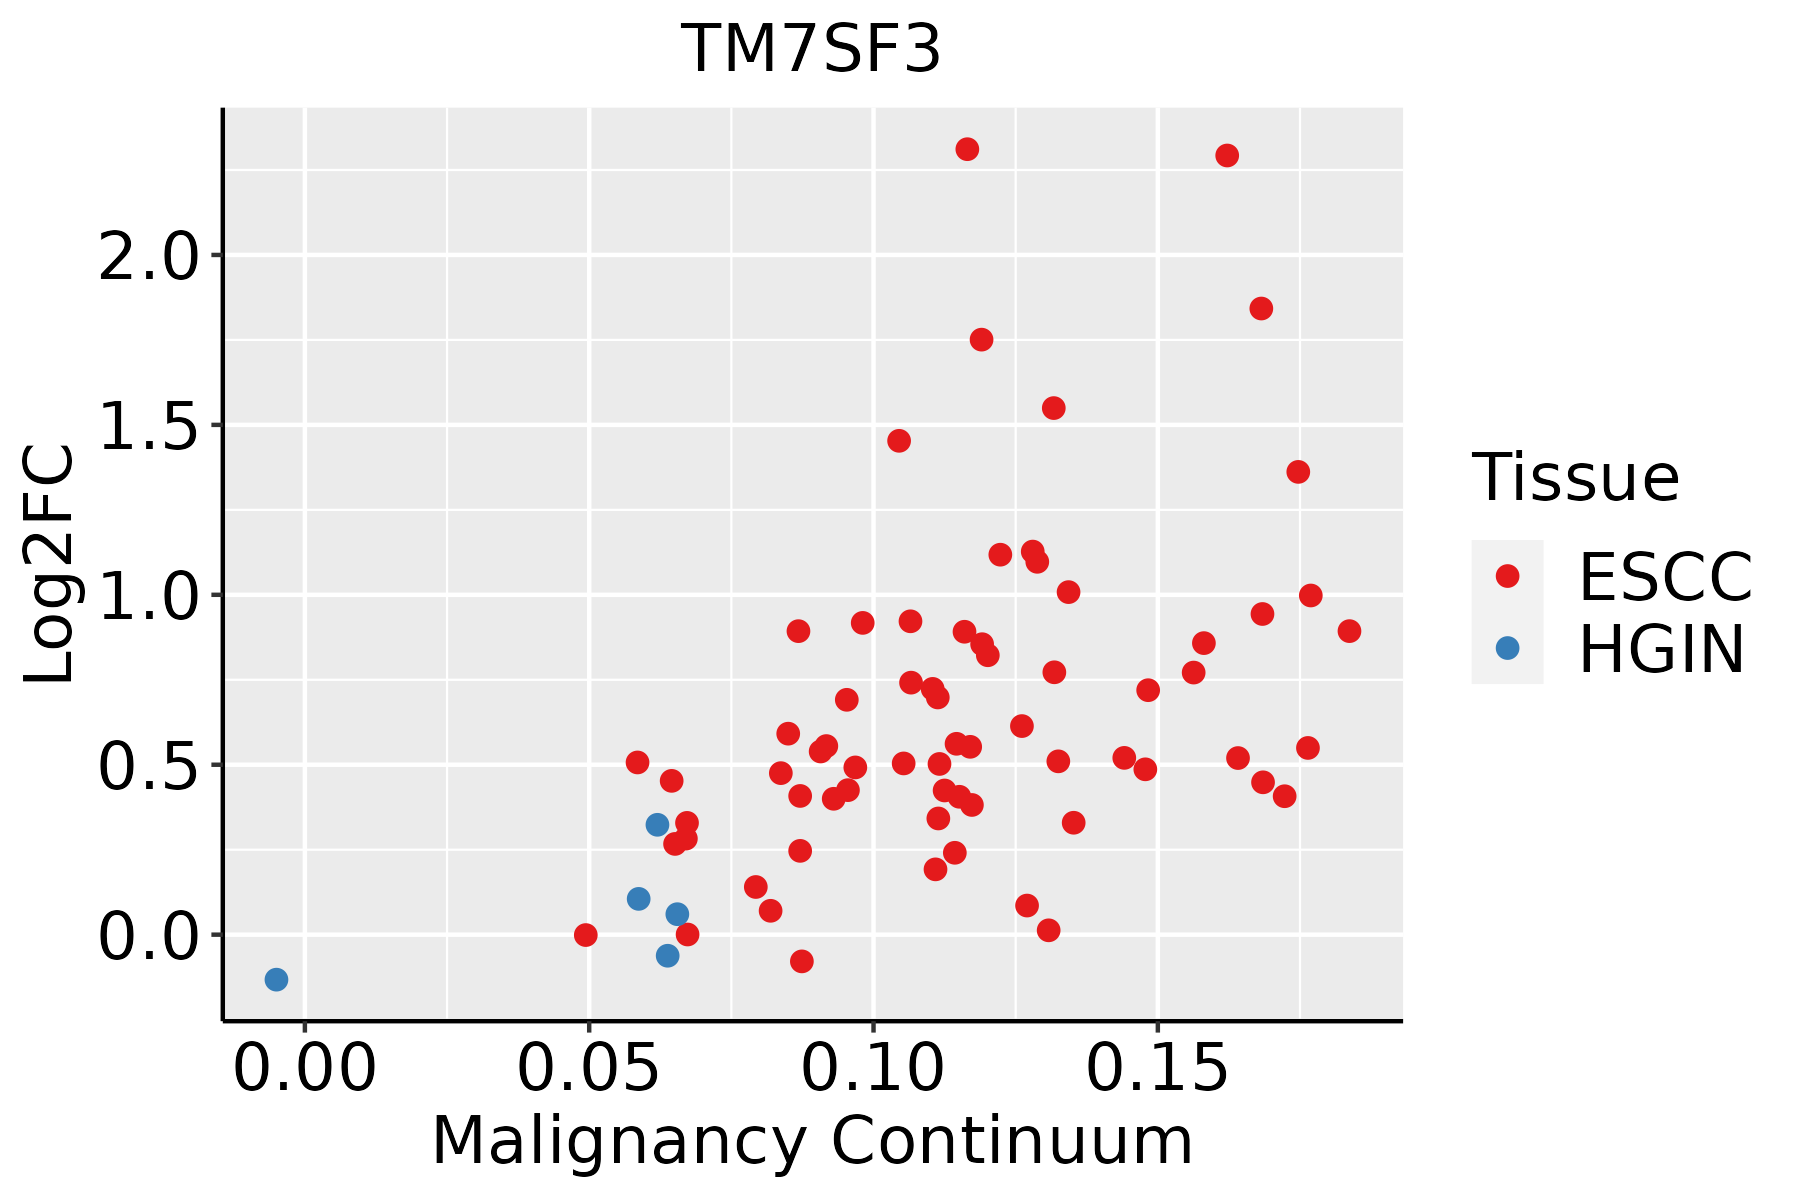 | ESCC: Esophageal squamous cell carcinoma |
| HGIN: High-grade intraepithelial neoplasias | ||
| LGIN: Low-grade intraepithelial neoplasias | ||
| Liver | 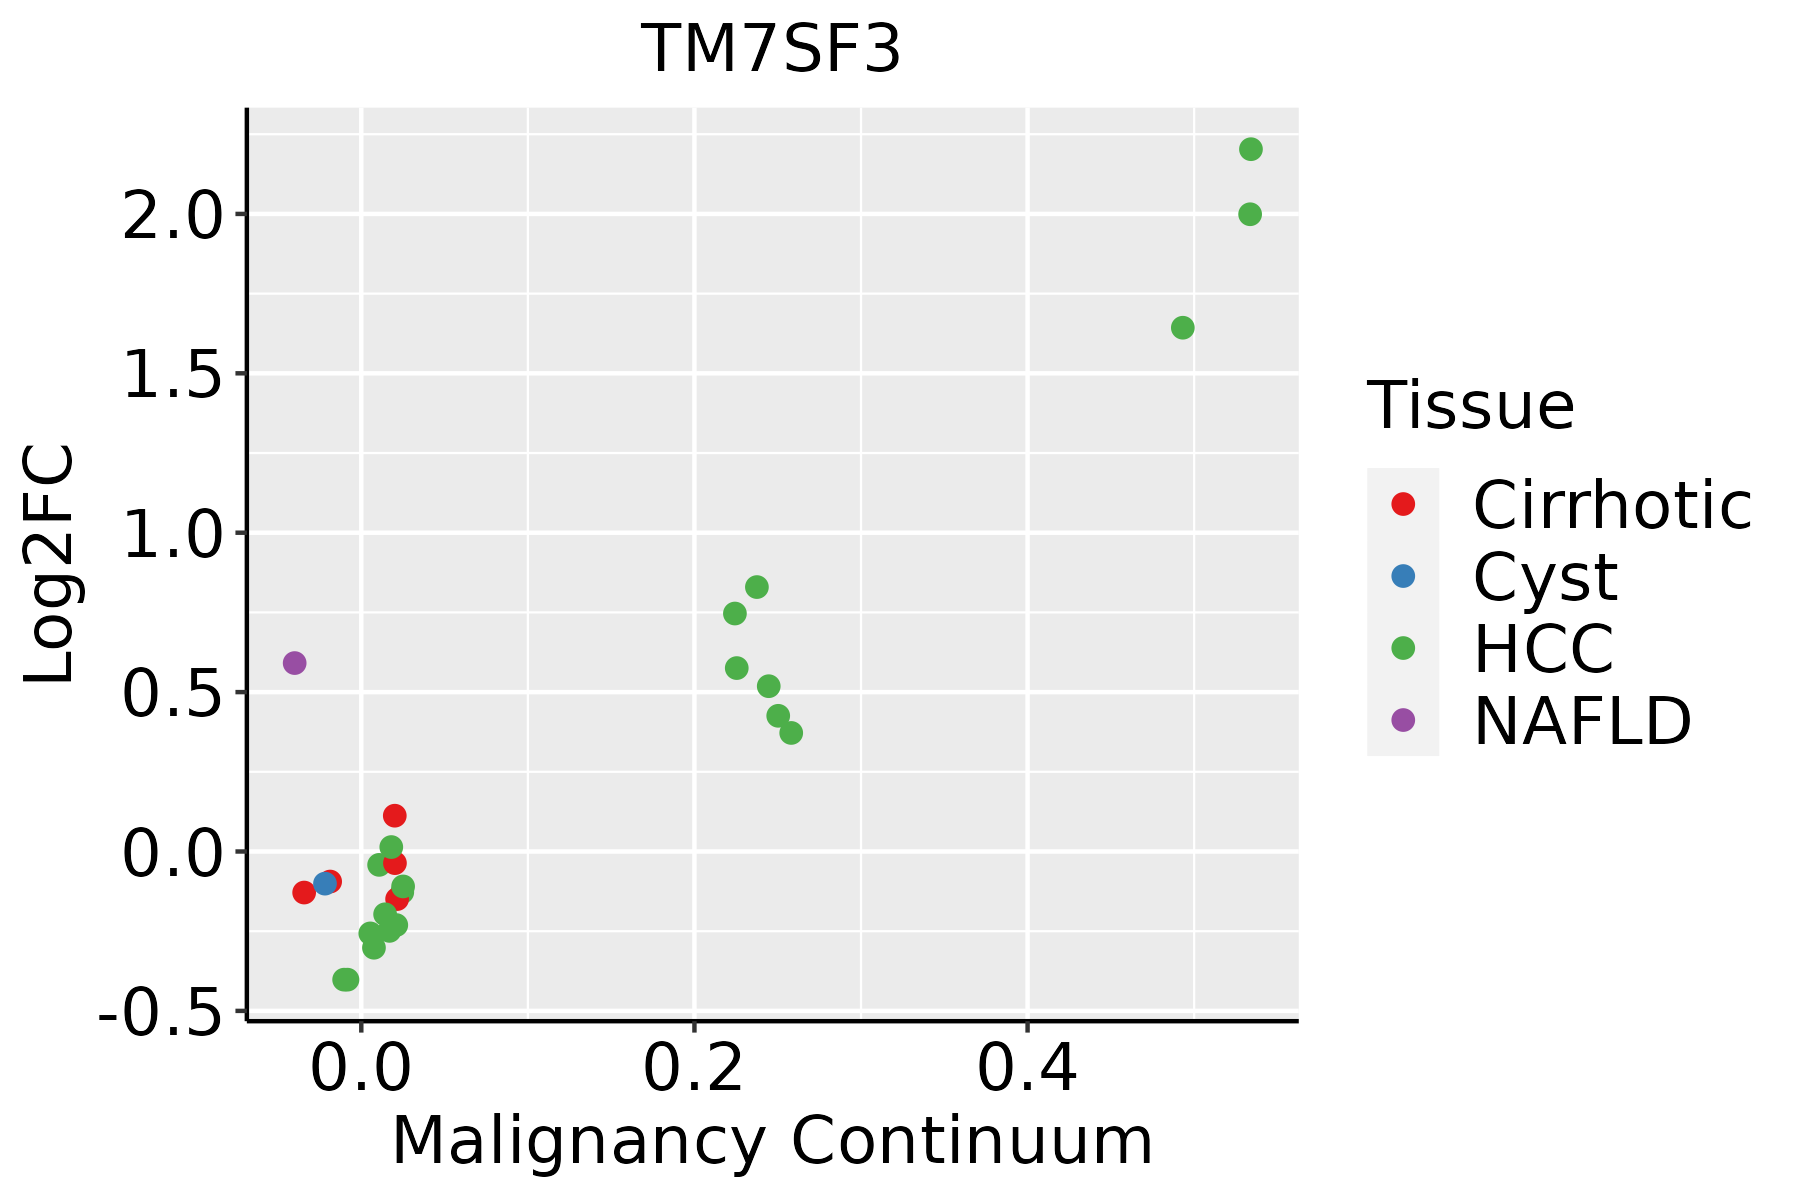 | HCC: Hepatocellular carcinoma |
| NAFLD: Non-alcoholic fatty liver disease | ||
| Lung | 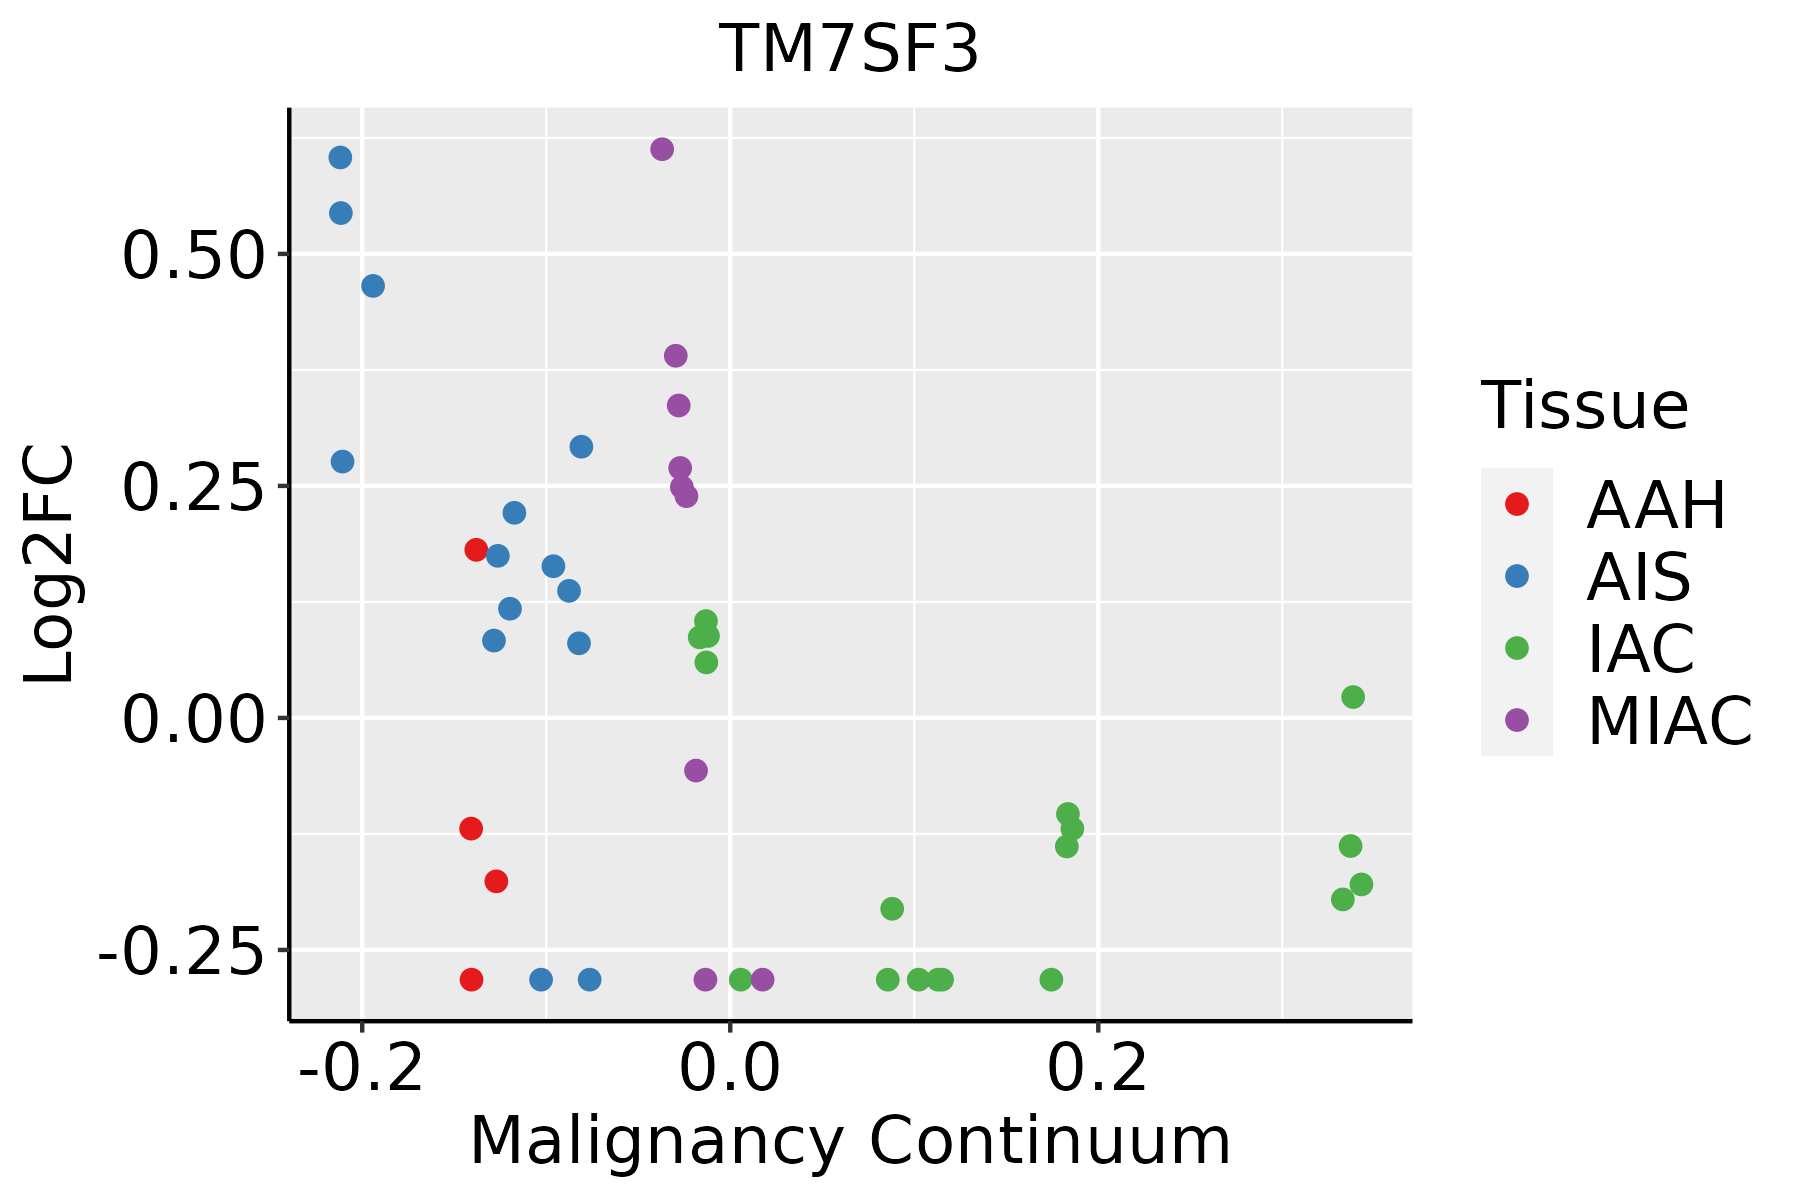 | AAH: Atypical adenomatous hyperplasia |
| AIS: Adenocarcinoma in situ | ||
| IAC: Invasive lung adenocarcinoma | ||
| MIA: Minimally invasive adenocarcinoma | ||
| Oral Cavity | 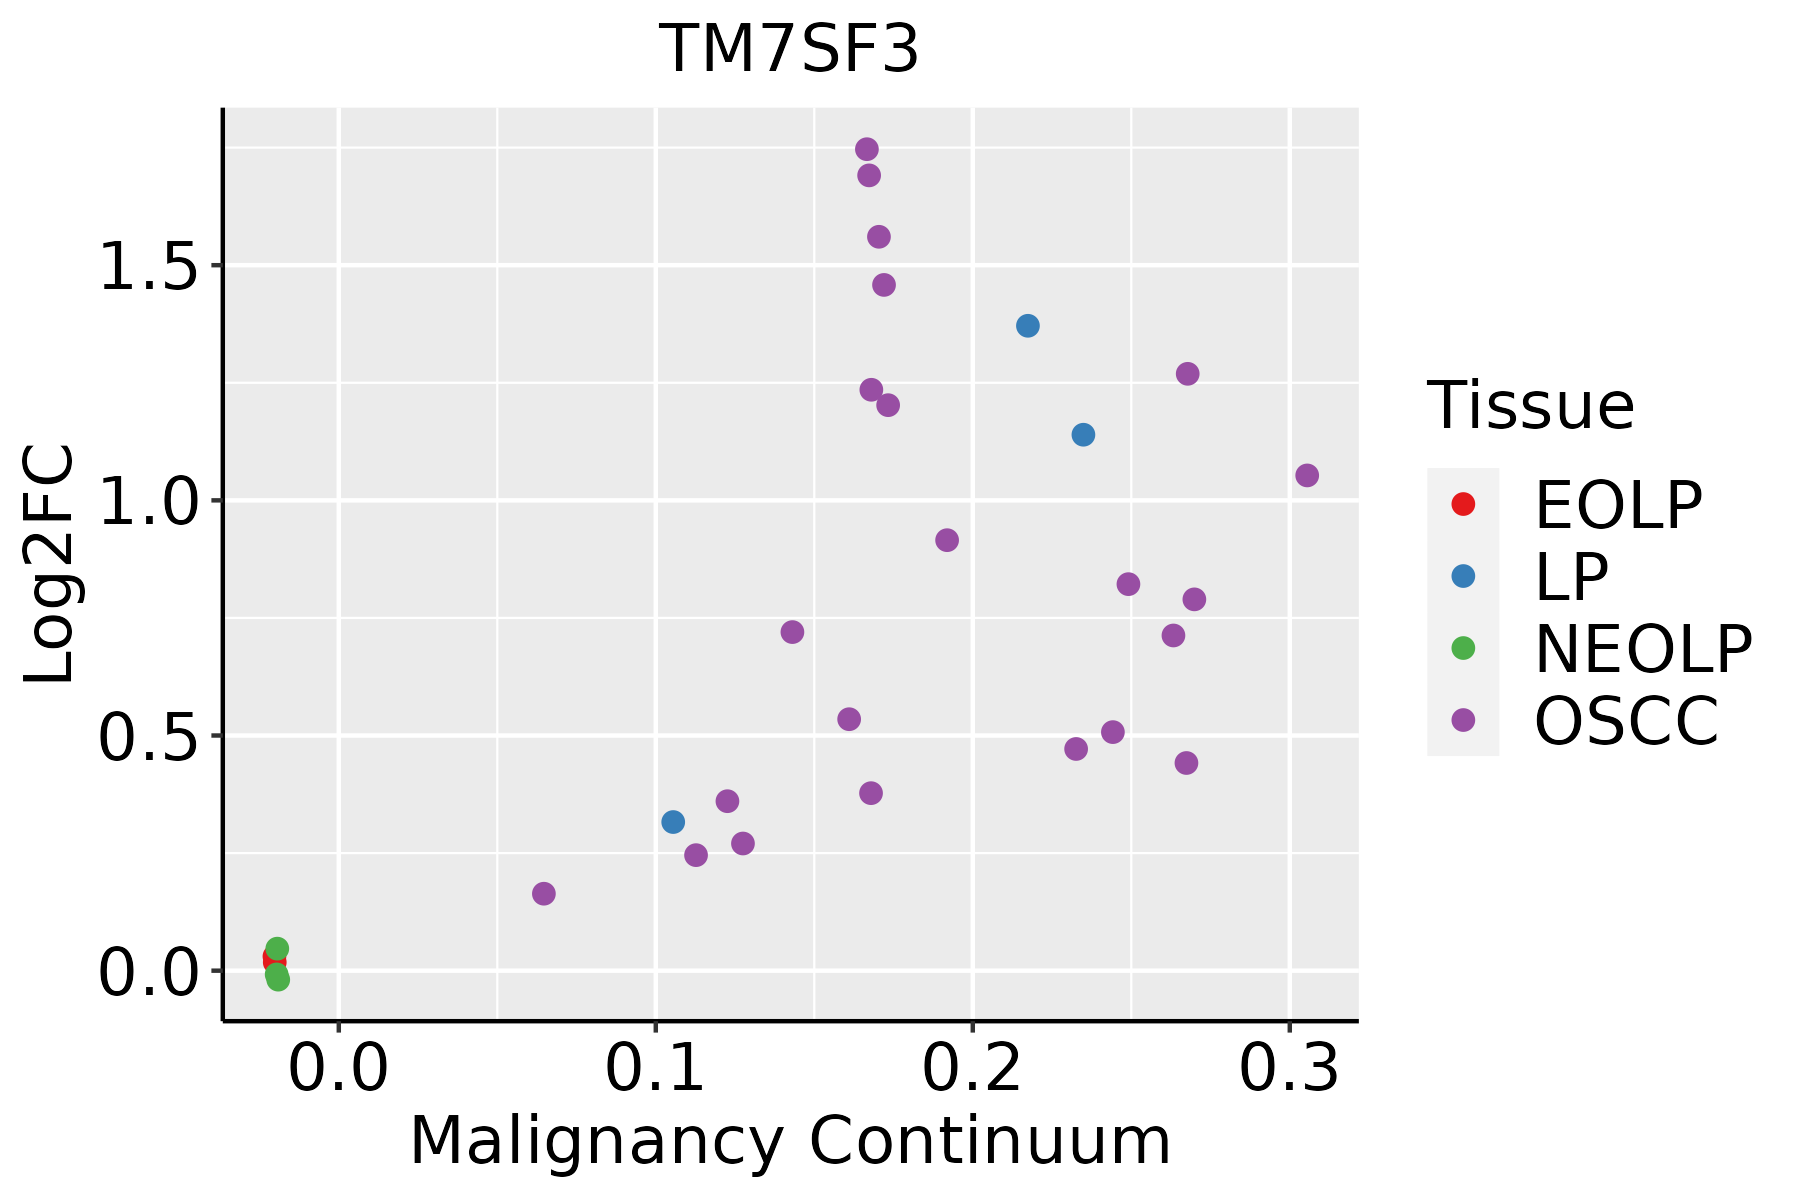 | EOLP: Erosive Oral lichen planus |
| LP: leukoplakia | ||
| NEOLP: Non-erosive oral lichen planus | ||
| OSCC: Oral squamous cell carcinoma | ||
| Prostate | 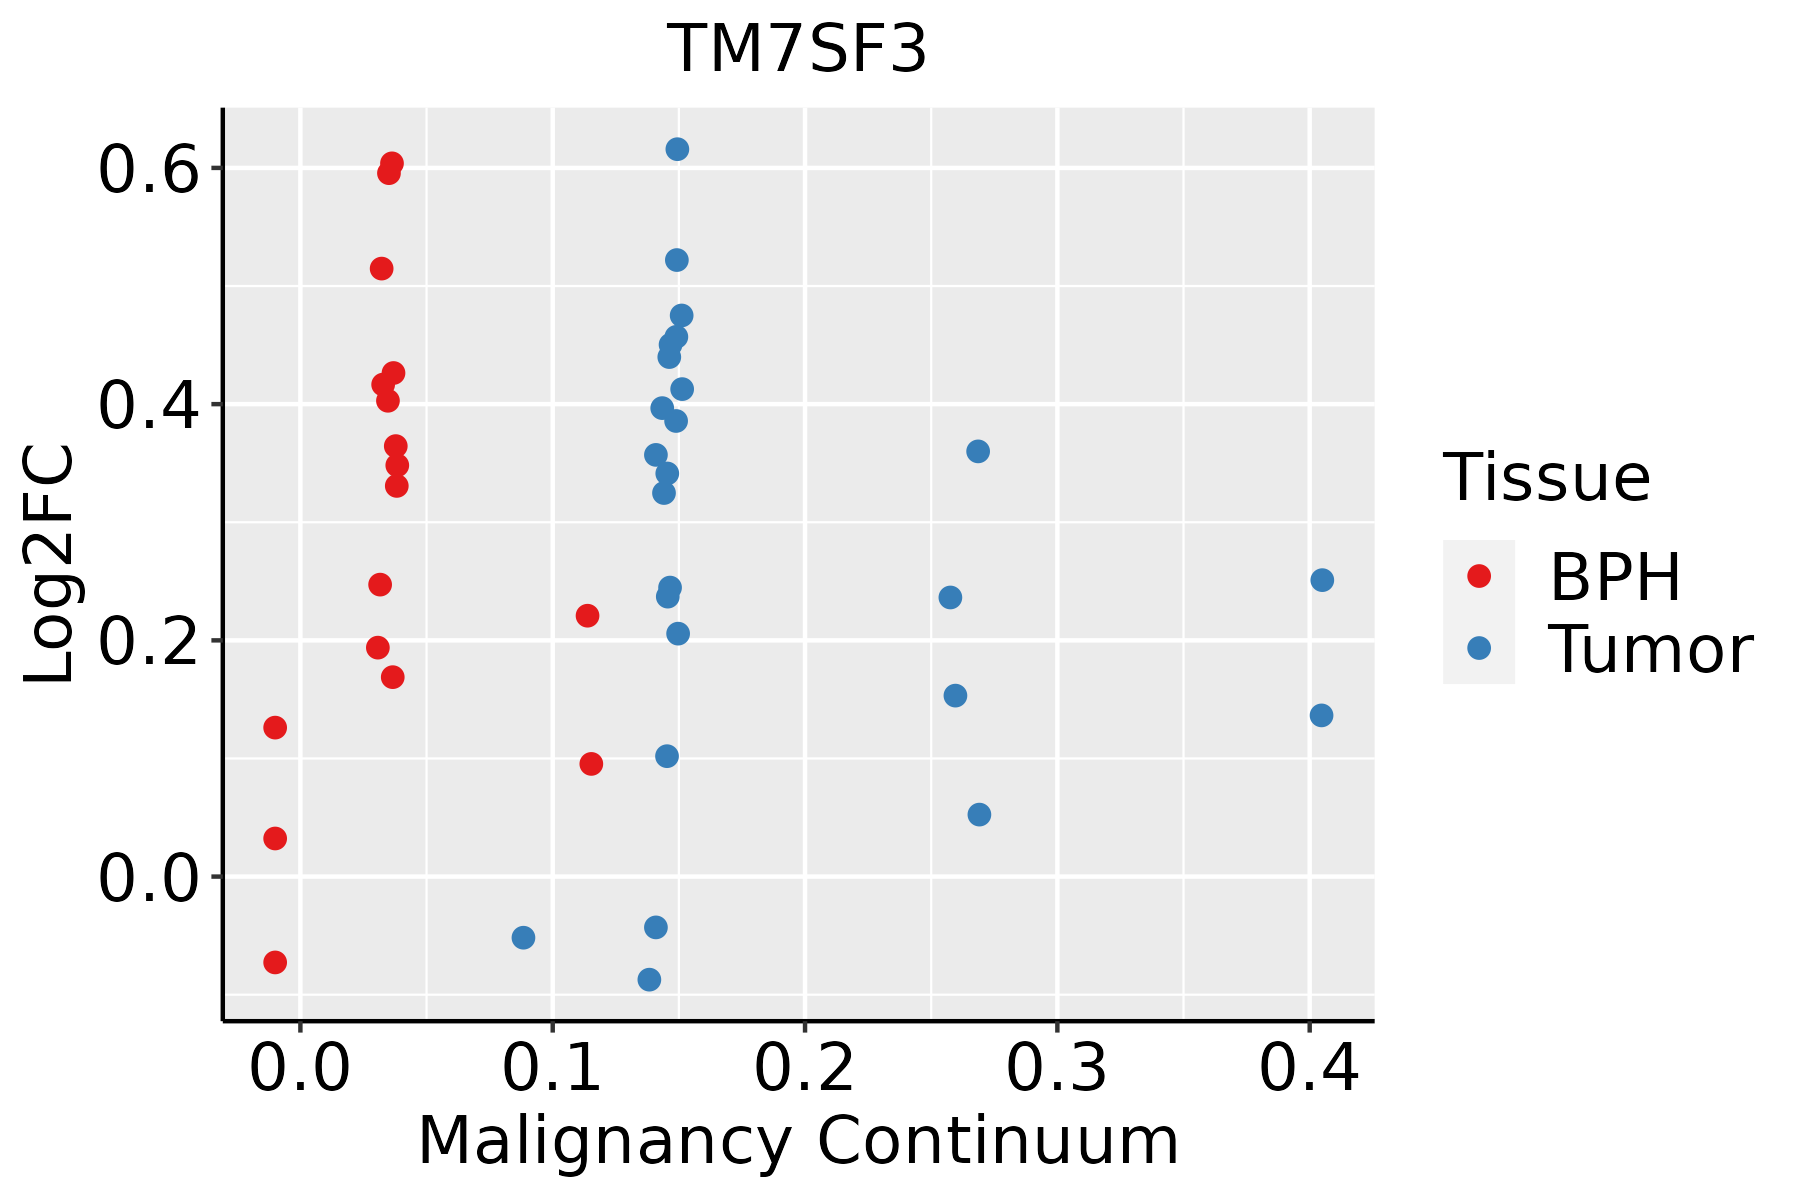 | BPH: Benign Prostatic Hyperplasia |
| Skin | 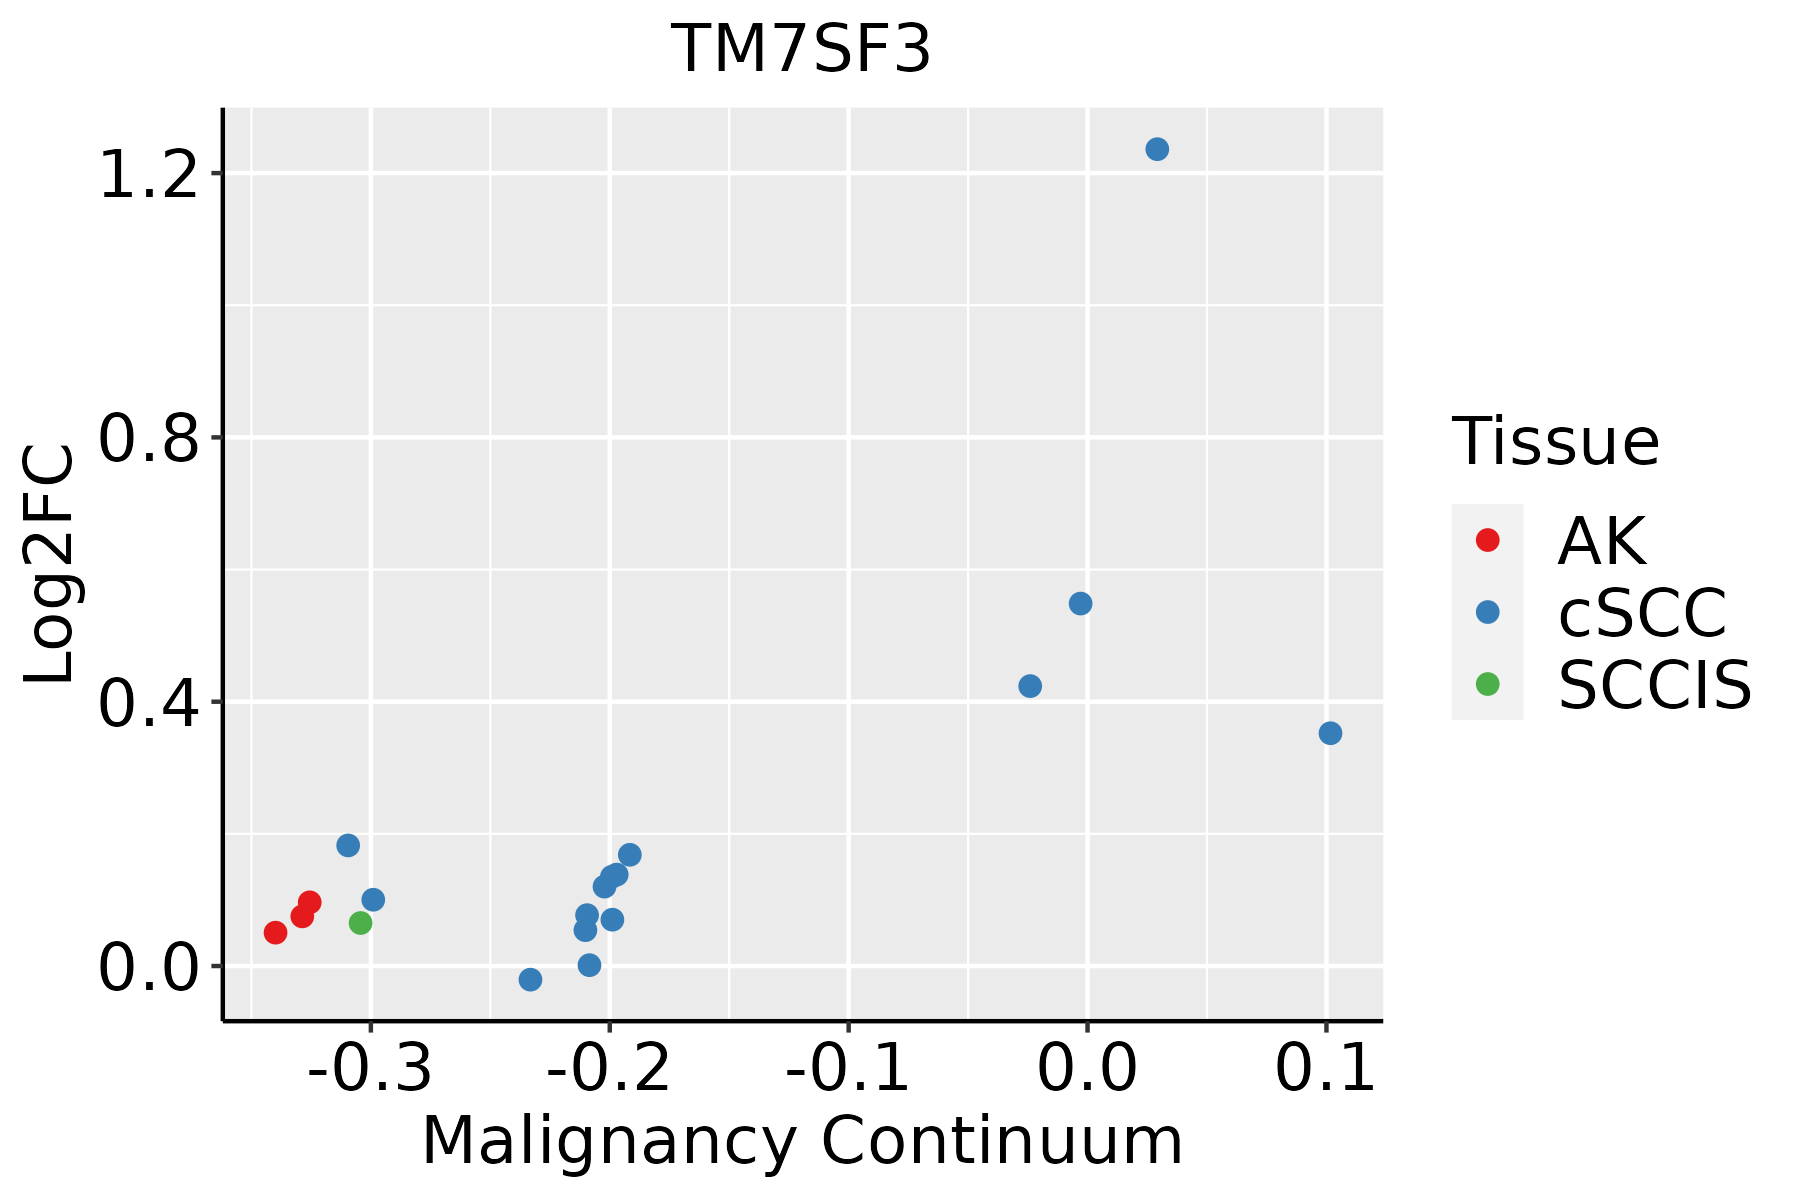 | AK: Actinic keratosis |
| cSCC: Cutaneous squamous cell carcinoma | ||
| SCCIS:squamous cell carcinoma in situ | ||
| Thyroid | 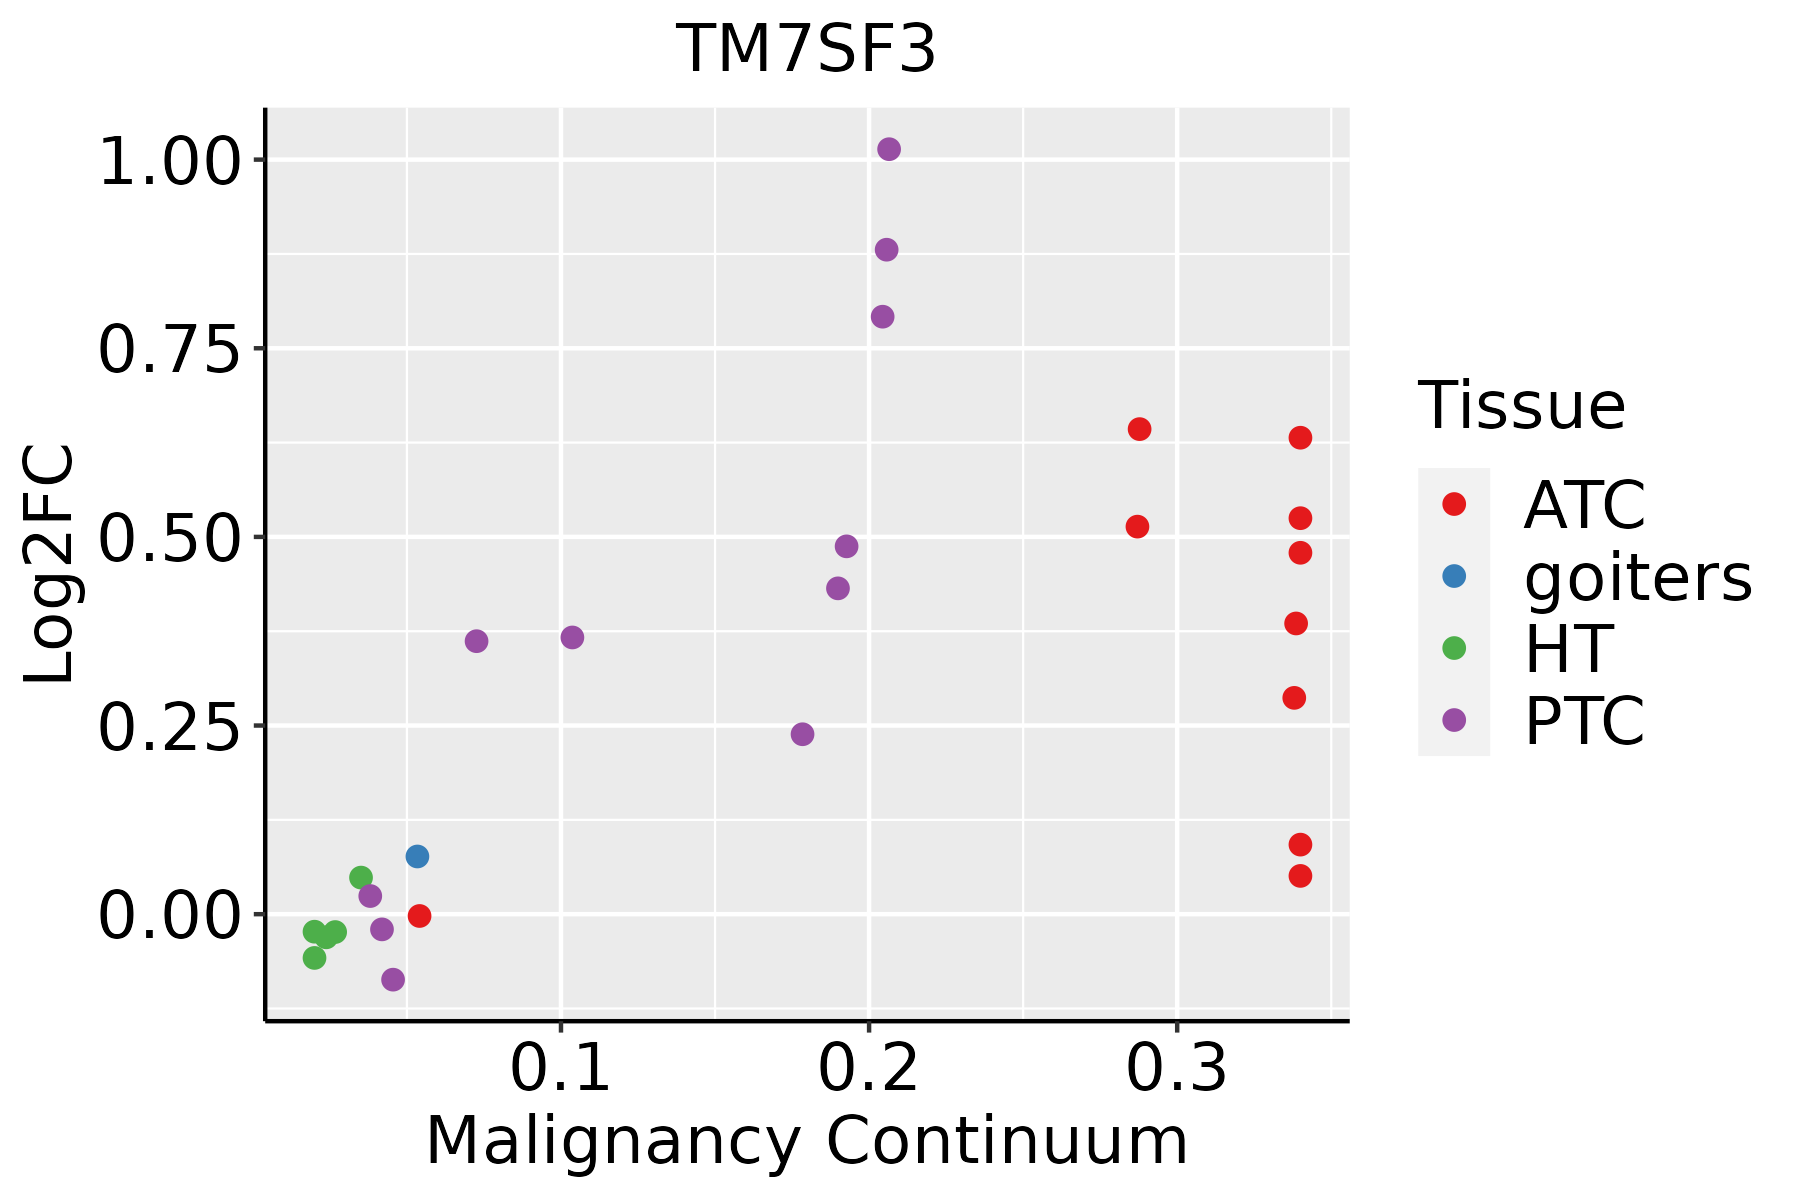 | ATC: Anaplastic thyroid cancer |
| HT: Hashimoto's thyroiditis | ||
| PTC: Papillary thyroid cancer |
| ∗log2FC in expression of this searched gene in stem-like cells from each diseased tissue sample relative to stem-like cells in normal samples in each tissue plotted against the malignancy continuum. Samples are colored based on if they are from different disease stage. |
Top |
Malignant transformation related pathway analysis |
| Find out the enriched GO biological processes and KEGG pathways involved in transition from healthy to precancer to cancer |
| Tissue | Disease Stage | Enriched GO biological Processes |
| Colorectum | AD |  |
| Colorectum | SER |  |
| Colorectum | MSS |  |
| Colorectum | MSI-H |  |
| Colorectum | FAP |  |
| ∗Top 15 enriched GO BP terms are showed in the bar plot of each disease state in each tissue. Each row represents a significant GO biological process which is colored according to the -log10(p.adjust). |
| Page: 1 2 3 4 5 6 7 8 9 |
| GO ID | Tissue | Disease Stage | Description | Gene Ratio | Bg Ratio | pvalue | p.adjust | Count |
| GO:1904951 | Colorectum | AD | positive regulation of establishment of protein localization | 112/3918 | 319/18723 | 2.55e-09 | 1.80e-07 | 112 |
| GO:0051222 | Colorectum | AD | positive regulation of protein transport | 106/3918 | 303/18723 | 8.45e-09 | 5.08e-07 | 106 |
| GO:0050708 | Colorectum | AD | regulation of protein secretion | 83/3918 | 268/18723 | 6.59e-05 | 1.07e-03 | 83 |
| GO:0035966 | Colorectum | AD | response to topologically incorrect protein | 54/3918 | 159/18723 | 8.85e-05 | 1.36e-03 | 54 |
| GO:0035967 | Colorectum | AD | cellular response to topologically incorrect protein | 42/3918 | 116/18723 | 1.04e-04 | 1.56e-03 | 42 |
| GO:0009306 | Colorectum | AD | protein secretion | 105/3918 | 359/18723 | 1.05e-04 | 1.57e-03 | 105 |
| GO:0035592 | Colorectum | AD | establishment of protein localization to extracellular region | 105/3918 | 360/18723 | 1.18e-04 | 1.73e-03 | 105 |
| GO:0071692 | Colorectum | AD | protein localization to extracellular region | 106/3918 | 368/18723 | 1.86e-04 | 2.49e-03 | 106 |
| GO:0050796 | Colorectum | AD | regulation of insulin secretion | 54/3918 | 165/18723 | 2.60e-04 | 3.25e-03 | 54 |
| GO:0051047 | Colorectum | AD | positive regulation of secretion | 90/3918 | 310/18723 | 4.11e-04 | 4.66e-03 | 90 |
| GO:0030073 | Colorectum | AD | insulin secretion | 61/3918 | 195/18723 | 4.28e-04 | 4.81e-03 | 61 |
| GO:1903532 | Colorectum | AD | positive regulation of secretion by cell | 82/3918 | 282/18723 | 6.85e-04 | 7.00e-03 | 82 |
| GO:0006986 | Colorectum | AD | response to unfolded protein | 45/3918 | 137/18723 | 7.43e-04 | 7.48e-03 | 45 |
| GO:0015833 | Colorectum | AD | peptide transport | 77/3918 | 264/18723 | 8.90e-04 | 8.60e-03 | 77 |
| GO:0034620 | Colorectum | AD | cellular response to unfolded protein | 33/3918 | 96/18723 | 1.53e-03 | 1.29e-02 | 33 |
| GO:0090087 | Colorectum | AD | regulation of peptide transport | 60/3918 | 202/18723 | 1.94e-03 | 1.58e-02 | 60 |
| GO:0030072 | Colorectum | AD | peptide hormone secretion | 68/3918 | 236/18723 | 2.39e-03 | 1.85e-02 | 68 |
| GO:0002791 | Colorectum | AD | regulation of peptide secretion | 59/3918 | 200/18723 | 2.50e-03 | 1.92e-02 | 59 |
| GO:0090276 | Colorectum | AD | regulation of peptide hormone secretion | 58/3918 | 196/18723 | 2.51e-03 | 1.92e-02 | 58 |
| GO:0002790 | Colorectum | AD | peptide secretion | 69/3918 | 242/18723 | 2.97e-03 | 2.22e-02 | 69 |
| Page: 1 2 3 4 5 6 7 8 9 10 |
| Pathway ID | Tissue | Disease Stage | Description | Gene Ratio | Bg Ratio | pvalue | p.adjust | qvalue | Count |
| Page: 1 |
Top |
Cell-cell communication analysis |
| Identification of potential cell-cell interactions between two cell types and their ligand-receptor pairs for different disease states |
| Ligand | Receptor | LRpair | Pathway | Tissue | Disease Stage |
| Page: 1 |
Top |
Single-cell gene regulatory network inference analysis |
| Find out the significant the regulons (TFs) and the target genes of each regulon across cell types for different disease states |
| TF | Cell Type | Tissue | Disease Stage | Target Gene | RSS | Regulon Activity |
| ∗The dot plots of a searched regulon are shown for all cell subpopulations in each disease state of each tissue based on the regulon specific score inferred using pySCENIC and by calculating the average expression. |
| Page: 1 |
Top |
Somatic mutation of malignant transformation related genes |
| Annotation of somatic variants for genes involved in malignant transformation |
| Hugo Symbol | Variant Class | Variant Classification | dbSNP RS | HGVSc | HGVSp | HGVSp Short | SWISSPROT | BIOTYPE | SIFT | PolyPhen | Tumor Sample Barcode | Tissue | Histology | Sex | Age | Stage | Therapy Types | Drugs | Outcome |
| TM7SF3 | SNV | Missense_Mutation | c.1068N>G | p.Ser356Arg | p.S356R | Q9NS93 | protein_coding | tolerated(0.09) | possibly_damaging(0.65) | TCGA-A8-A07W-01 | Breast | breast invasive carcinoma | Female | >=65 | III/IV | Hormone Therapy | exemestane | SD | |
| TM7SF3 | SNV | Missense_Mutation | novel | c.1316N>C | p.Gly439Ala | p.G439A | Q9NS93 | protein_coding | deleterious(0.01) | probably_damaging(0.994) | TCGA-C8-A8HP-01 | Breast | breast invasive carcinoma | Female | <65 | III/IV | Chemotherapy | 5-fluorouracil | CR |
| TM7SF3 | SNV | Missense_Mutation | c.1026C>G | p.Ile342Met | p.I342M | Q9NS93 | protein_coding | deleterious(0.02) | benign(0.09) | TCGA-E2-A1BC-01 | Breast | breast invasive carcinoma | Female | <65 | I/II | Hormone Therapy | arimidex | SD | |
| TM7SF3 | SNV | Missense_Mutation | c.1704N>C | p.Leu568Phe | p.L568F | Q9NS93 | protein_coding | deleterious(0) | probably_damaging(0.997) | TCGA-EW-A1OY-01 | Breast | breast invasive carcinoma | Female | <65 | I/II | Chemotherapy | doxorubicin | SD | |
| TM7SF3 | SNV | Missense_Mutation | c.1515A>C | p.Arg505Ser | p.R505S | Q9NS93 | protein_coding | deleterious(0.01) | benign(0.413) | TCGA-FU-A3HZ-01 | Cervix | cervical & endocervical cancer | Female | <65 | I/II | Chemotherapy | cisplatin | CR | |
| TM7SF3 | SNV | Missense_Mutation | novel | c.140G>C | p.Arg47Thr | p.R47T | Q9NS93 | protein_coding | deleterious(0.04) | benign(0.037) | TCGA-JW-A5VL-01 | Cervix | cervical & endocervical cancer | Female | <65 | I/II | Unknown | Unknown | SD |
| TM7SF3 | SNV | Missense_Mutation | novel | c.1694N>A | p.Arg565Lys | p.R565K | Q9NS93 | protein_coding | deleterious(0.02) | possibly_damaging(0.679) | TCGA-AA-3510-01 | Colorectum | colon adenocarcinoma | Male | >=65 | I/II | Unknown | Unknown | SD |
| TM7SF3 | SNV | Missense_Mutation | novel | c.1246G>A | p.Ala416Thr | p.A416T | Q9NS93 | protein_coding | tolerated(0.4) | benign(0.012) | TCGA-AA-3947-01 | Colorectum | colon adenocarcinoma | Female | <65 | I/II | Unknown | Unknown | SD |
| TM7SF3 | SNV | Missense_Mutation | c.101N>C | p.Glu34Ala | p.E34A | Q9NS93 | protein_coding | tolerated(0.09) | probably_damaging(0.984) | TCGA-AA-3977-01 | Colorectum | colon adenocarcinoma | Male | >=65 | I/II | Unknown | Unknown | SD | |
| TM7SF3 | SNV | Missense_Mutation | rs762862395 | c.1069N>A | p.Val357Ile | p.V357I | Q9NS93 | protein_coding | tolerated(0.69) | benign(0.007) | TCGA-AA-A010-01 | Colorectum | colon adenocarcinoma | Female | <65 | I/II | Chemotherapy | folinic | CR |
| Page: 1 2 3 4 5 6 7 |
Top |
Related drugs of malignant transformation related genes |
| Identification of chemicals and drugs interact with genes involved in malignant transfromation |
| (DGIdb 4.0) |
| Entrez ID | Symbol | Category | Interaction Types | Drug Claim Name | Drug Name | PMIDs |
| Page: 1 |

Copyright 2023-Present -The University of Texas Health Science Center at Houston |