
|
|||||
|
 | |
| |
| |
| |
| |
| |
|
Gene: TM7SF2 |
Gene summary for TM7SF2 |
| Gene information | Species | Human | Gene symbol | TM7SF2 | Gene ID | 7108 |
| Gene name | transmembrane 7 superfamily member 2 | |
| Gene Alias | ANG1 | |
| Cytomap | 11q13.1 | |
| Gene Type | protein-coding | GO ID | GO:0006066 | UniProtAcc | O76062 |
Top |
Malignant transformation analysis |
| Identification of the aberrant gene expression in precancerous and cancerous lesions by comparing the gene expression of stem-like cells in diseased tissues with normal stem cells |
| Entrez ID | Symbol | Replicates | Species | Organ | Tissue | Adj P-value | Log2FC | Malignancy |
| 7108 | TM7SF2 | LZE4T | Human | Esophagus | ESCC | 7.34e-04 | 1.75e-01 | 0.0811 |
| 7108 | TM7SF2 | LZE7T | Human | Esophagus | ESCC | 1.68e-06 | 4.92e-01 | 0.0667 |
| 7108 | TM7SF2 | LZE22T | Human | Esophagus | ESCC | 1.15e-03 | 2.78e-01 | 0.068 |
| 7108 | TM7SF2 | LZE24T | Human | Esophagus | ESCC | 8.10e-20 | 6.70e-01 | 0.0596 |
| 7108 | TM7SF2 | P1T-E | Human | Esophagus | ESCC | 1.69e-04 | 4.53e-01 | 0.0875 |
| 7108 | TM7SF2 | P2T-E | Human | Esophagus | ESCC | 1.45e-03 | 6.21e-02 | 0.1177 |
| 7108 | TM7SF2 | P4T-E | Human | Esophagus | ESCC | 3.75e-57 | 1.48e+00 | 0.1323 |
| 7108 | TM7SF2 | P5T-E | Human | Esophagus | ESCC | 6.25e-13 | 1.52e-01 | 0.1327 |
| 7108 | TM7SF2 | P8T-E | Human | Esophagus | ESCC | 2.21e-40 | 7.30e-01 | 0.0889 |
| 7108 | TM7SF2 | P9T-E | Human | Esophagus | ESCC | 2.41e-04 | 7.12e-02 | 0.1131 |
| 7108 | TM7SF2 | P10T-E | Human | Esophagus | ESCC | 3.71e-37 | 8.31e-01 | 0.116 |
| 7108 | TM7SF2 | P11T-E | Human | Esophagus | ESCC | 2.15e-06 | 4.69e-01 | 0.1426 |
| 7108 | TM7SF2 | P12T-E | Human | Esophagus | ESCC | 1.64e-35 | 6.76e-01 | 0.1122 |
| 7108 | TM7SF2 | P15T-E | Human | Esophagus | ESCC | 4.27e-25 | 5.84e-01 | 0.1149 |
| 7108 | TM7SF2 | P16T-E | Human | Esophagus | ESCC | 2.95e-10 | 2.85e-01 | 0.1153 |
| 7108 | TM7SF2 | P20T-E | Human | Esophagus | ESCC | 3.50e-02 | 4.30e-03 | 0.1124 |
| 7108 | TM7SF2 | P21T-E | Human | Esophagus | ESCC | 1.86e-08 | 1.92e-01 | 0.1617 |
| 7108 | TM7SF2 | P23T-E | Human | Esophagus | ESCC | 1.05e-08 | 3.80e-01 | 0.108 |
| 7108 | TM7SF2 | P26T-E | Human | Esophagus | ESCC | 1.95e-23 | 4.32e-01 | 0.1276 |
| 7108 | TM7SF2 | P27T-E | Human | Esophagus | ESCC | 4.65e-10 | 2.43e-01 | 0.1055 |
| Page: 1 2 3 4 5 |
| Tissue | Expression Dynamics | Abbreviation |
| Esophagus | 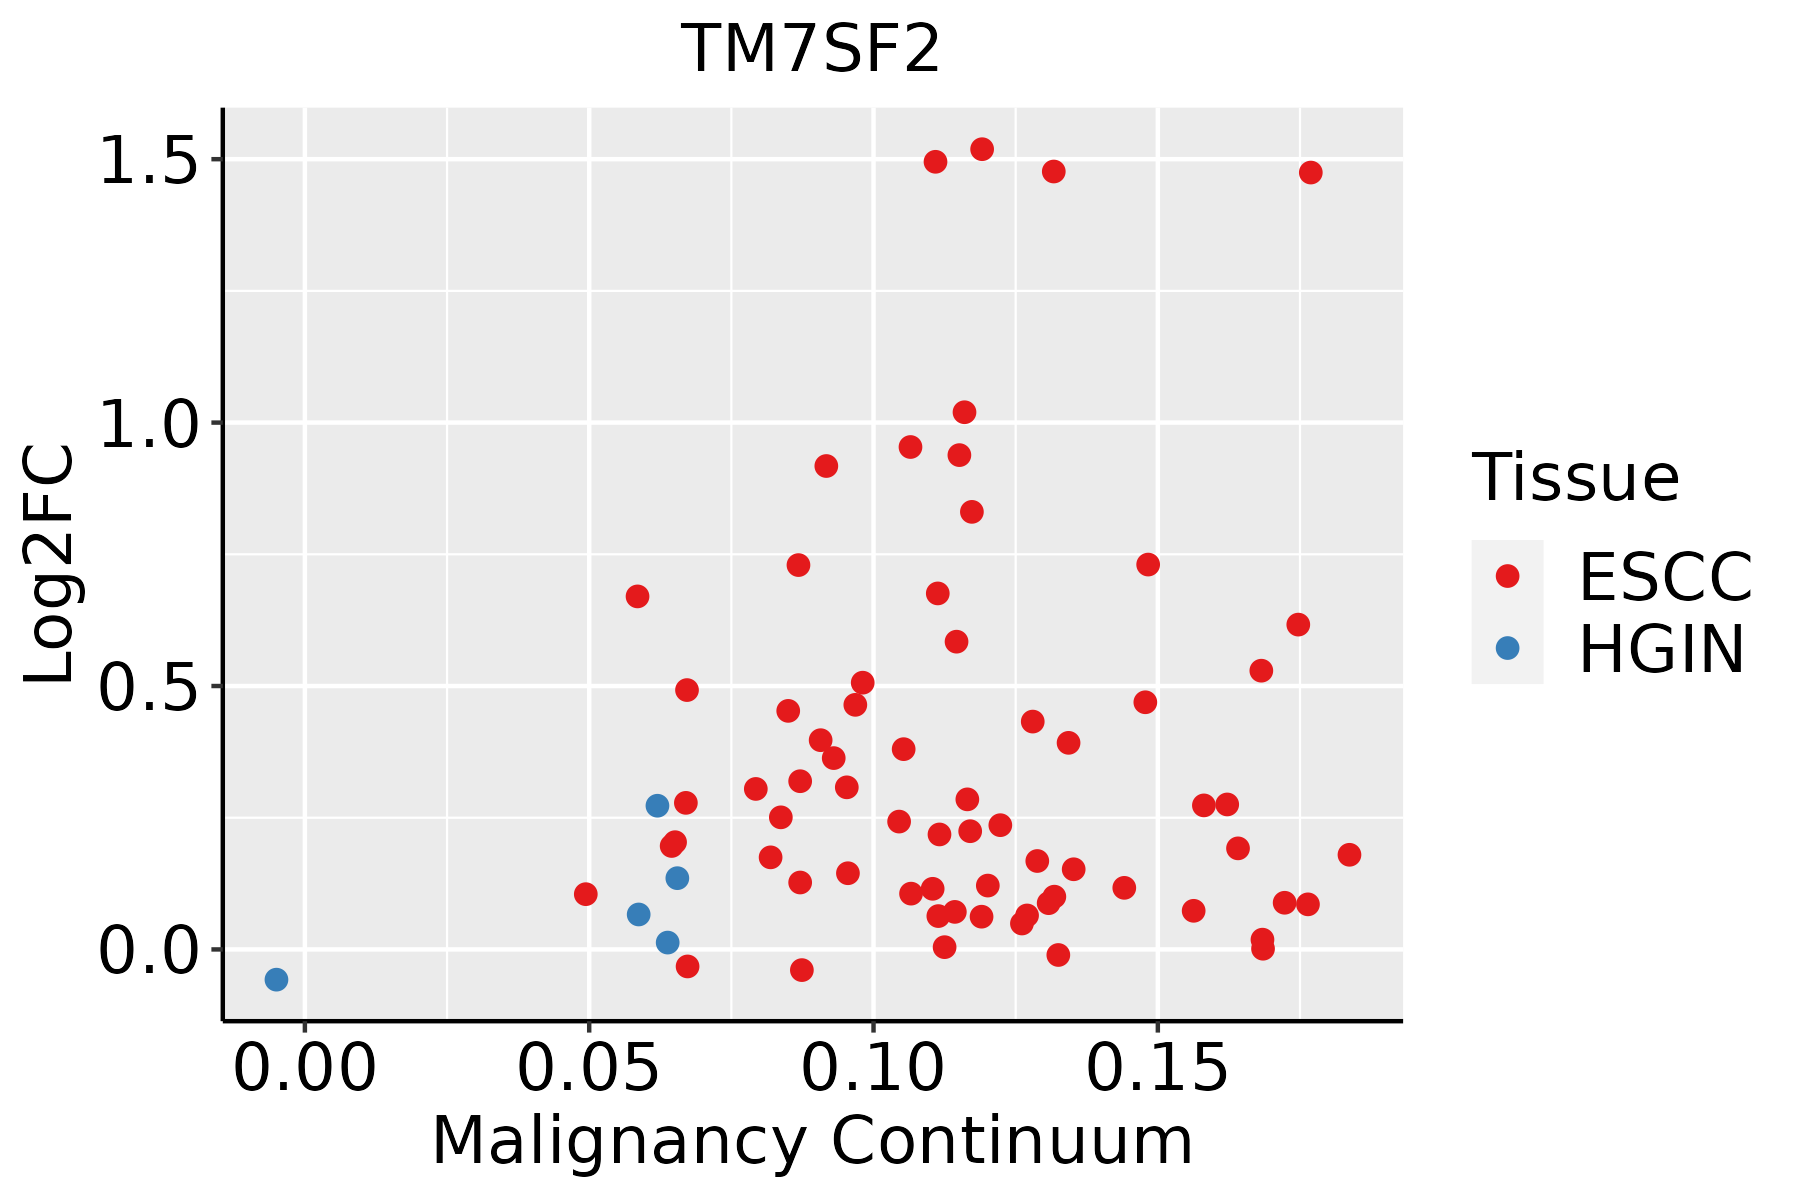 | ESCC: Esophageal squamous cell carcinoma |
| HGIN: High-grade intraepithelial neoplasias | ||
| LGIN: Low-grade intraepithelial neoplasias | ||
| Liver | 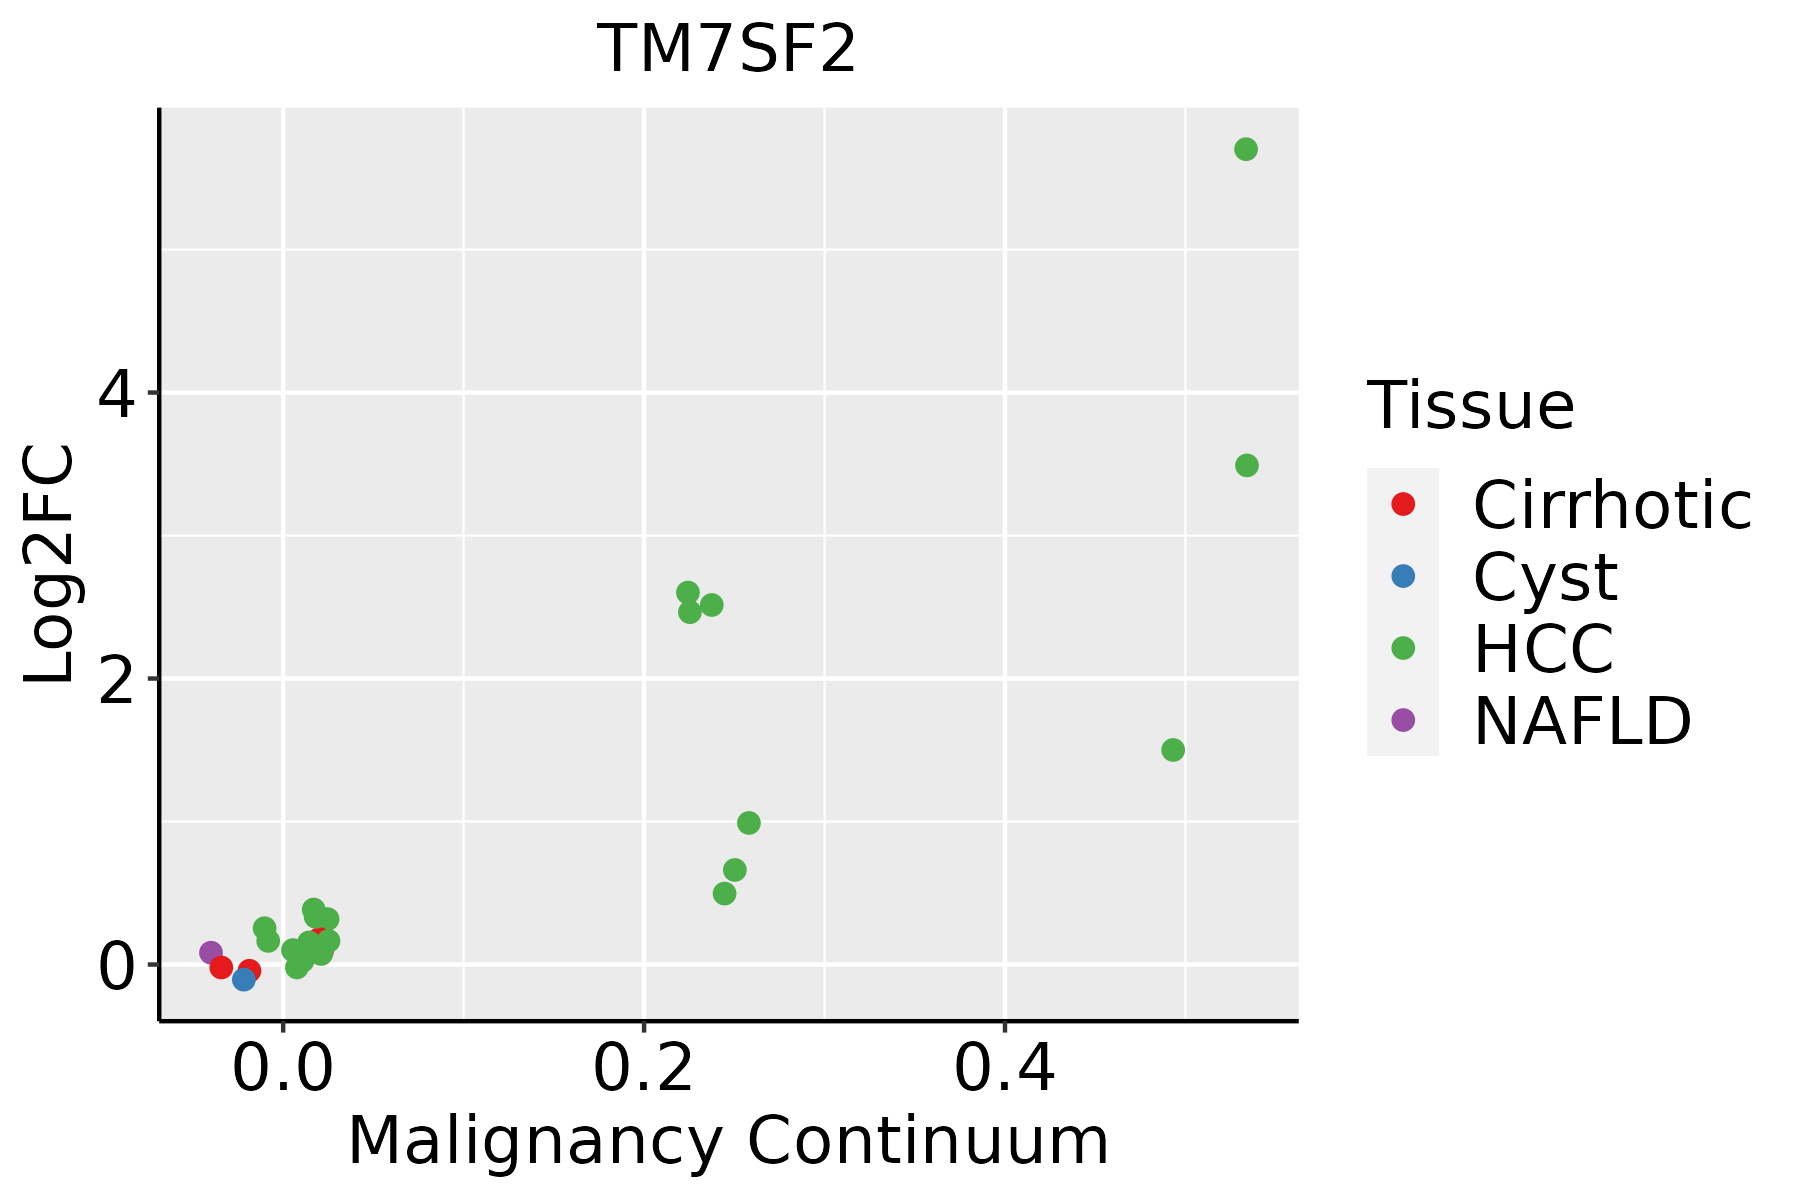 | HCC: Hepatocellular carcinoma |
| NAFLD: Non-alcoholic fatty liver disease | ||
| Oral Cavity |  | EOLP: Erosive Oral lichen planus |
| LP: leukoplakia | ||
| NEOLP: Non-erosive oral lichen planus | ||
| OSCC: Oral squamous cell carcinoma | ||
| Prostate |  | BPH: Benign Prostatic Hyperplasia |
| Thyroid | 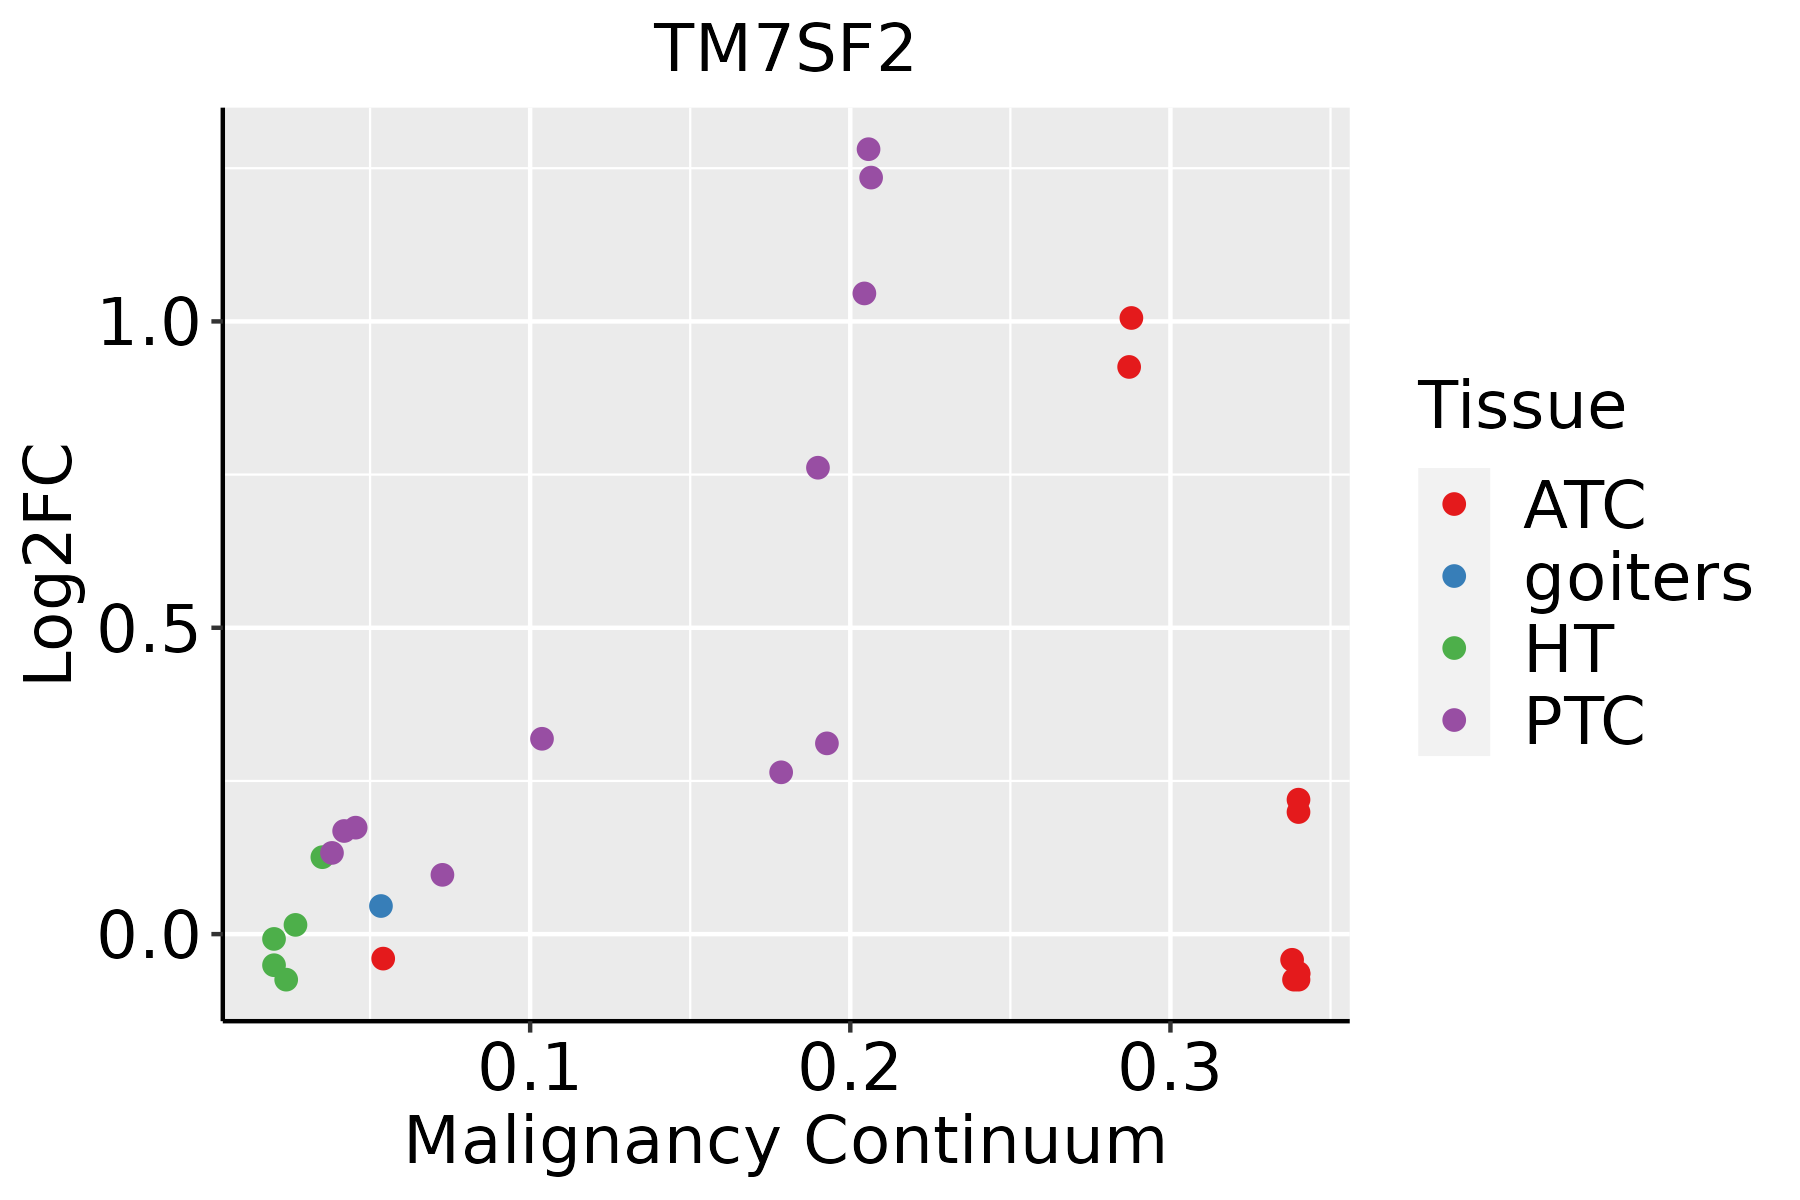 | ATC: Anaplastic thyroid cancer |
| HT: Hashimoto's thyroiditis | ||
| PTC: Papillary thyroid cancer |
| ∗log2FC in expression of this searched gene in stem-like cells from each diseased tissue sample relative to stem-like cells in normal samples in each tissue plotted against the malignancy continuum. Samples are colored based on if they are from different disease stage. |
Top |
Malignant transformation related pathway analysis |
| Find out the enriched GO biological processes and KEGG pathways involved in transition from healthy to precancer to cancer |
| Tissue | Disease Stage | Enriched GO biological Processes |
| Colorectum | AD |  |
| Colorectum | SER |  |
| Colorectum | MSS |  |
| Colorectum | MSI-H |  |
| Colorectum | FAP |  |
| ∗Top 15 enriched GO BP terms are showed in the bar plot of each disease state in each tissue. Each row represents a significant GO biological process which is colored according to the -log10(p.adjust). |
| Page: 1 2 3 4 5 6 7 8 9 |
| GO ID | Tissue | Disease Stage | Description | Gene Ratio | Bg Ratio | pvalue | p.adjust | Count |
| GO:00060668 | Esophagus | ESCC | alcohol metabolic process | 202/8552 | 353/18723 | 7.32e-06 | 7.26e-05 | 202 |
| GO:00161263 | Esophagus | ESCC | sterol biosynthetic process | 46/8552 | 64/18723 | 1.91e-05 | 1.67e-04 | 46 |
| GO:00066953 | Esophagus | ESCC | cholesterol biosynthetic process | 41/8552 | 57/18723 | 5.25e-05 | 4.06e-04 | 41 |
| GO:19026533 | Esophagus | ESCC | secondary alcohol biosynthetic process | 41/8552 | 57/18723 | 5.25e-05 | 4.06e-04 | 41 |
| GO:19026524 | Esophagus | ESCC | secondary alcohol metabolic process | 87/8552 | 147/18723 | 6.58e-04 | 3.50e-03 | 87 |
| GO:00461653 | Esophagus | ESCC | alcohol biosynthetic process | 83/8552 | 140/18723 | 8.04e-04 | 4.16e-03 | 83 |
| GO:00066946 | Esophagus | ESCC | steroid biosynthetic process | 98/8552 | 173/18723 | 2.34e-03 | 1.03e-02 | 98 |
| GO:00082034 | Esophagus | ESCC | cholesterol metabolic process | 79/8552 | 137/18723 | 3.11e-03 | 1.29e-02 | 79 |
| GO:00161254 | Esophagus | ESCC | sterol metabolic process | 86/8552 | 152/18723 | 4.37e-03 | 1.73e-02 | 86 |
| GO:19016174 | Esophagus | ESCC | organic hydroxy compound biosynthetic process | 128/8552 | 237/18723 | 5.86e-03 | 2.16e-02 | 128 |
| GO:000820211 | Liver | Cirrhotic | steroid metabolic process | 143/4634 | 319/18723 | 2.79e-15 | 3.18e-13 | 143 |
| GO:19026521 | Liver | Cirrhotic | secondary alcohol metabolic process | 75/4634 | 147/18723 | 5.62e-12 | 3.91e-10 | 75 |
| GO:00082031 | Liver | Cirrhotic | cholesterol metabolic process | 70/4634 | 137/18723 | 2.59e-11 | 1.55e-09 | 70 |
| GO:00161251 | Liver | Cirrhotic | sterol metabolic process | 75/4634 | 152/18723 | 4.54e-11 | 2.61e-09 | 75 |
| GO:000606612 | Liver | Cirrhotic | alcohol metabolic process | 141/4634 | 353/18723 | 1.57e-10 | 8.03e-09 | 141 |
| GO:00066941 | Liver | Cirrhotic | steroid biosynthetic process | 77/4634 | 173/18723 | 1.02e-08 | 3.91e-07 | 77 |
| GO:0016126 | Liver | Cirrhotic | sterol biosynthetic process | 37/4634 | 64/18723 | 1.74e-08 | 6.32e-07 | 37 |
| GO:0006695 | Liver | Cirrhotic | cholesterol biosynthetic process | 34/4634 | 57/18723 | 2.22e-08 | 7.77e-07 | 34 |
| GO:1902653 | Liver | Cirrhotic | secondary alcohol biosynthetic process | 34/4634 | 57/18723 | 2.22e-08 | 7.77e-07 | 34 |
| GO:0046165 | Liver | Cirrhotic | alcohol biosynthetic process | 55/4634 | 140/18723 | 9.74e-05 | 1.03e-03 | 55 |
| Page: 1 2 3 |
| Pathway ID | Tissue | Disease Stage | Description | Gene Ratio | Bg Ratio | pvalue | p.adjust | qvalue | Count |
| hsa001005 | Esophagus | ESCC | Steroid biosynthesis | 18/4205 | 20/8465 | 1.78e-04 | 6.79e-04 | 3.48e-04 | 18 |
| hsa0010012 | Esophagus | ESCC | Steroid biosynthesis | 18/4205 | 20/8465 | 1.78e-04 | 6.79e-04 | 3.48e-04 | 18 |
| hsa00100 | Liver | Cirrhotic | Steroid biosynthesis | 12/2530 | 20/8465 | 4.92e-03 | 1.76e-02 | 1.09e-02 | 12 |
| hsa001001 | Liver | Cirrhotic | Steroid biosynthesis | 12/2530 | 20/8465 | 4.92e-03 | 1.76e-02 | 1.09e-02 | 12 |
| Page: 1 |
Top |
Cell-cell communication analysis |
| Identification of potential cell-cell interactions between two cell types and their ligand-receptor pairs for different disease states |
| Ligand | Receptor | LRpair | Pathway | Tissue | Disease Stage |
| Page: 1 |
Top |
Single-cell gene regulatory network inference analysis |
| Find out the significant the regulons (TFs) and the target genes of each regulon across cell types for different disease states |
| TF | Cell Type | Tissue | Disease Stage | Target Gene | RSS | Regulon Activity |
| ∗The dot plots of a searched regulon are shown for all cell subpopulations in each disease state of each tissue based on the regulon specific score inferred using pySCENIC and by calculating the average expression. |
| Page: 1 |
Top |
Somatic mutation of malignant transformation related genes |
| Annotation of somatic variants for genes involved in malignant transformation |
| Hugo Symbol | Variant Class | Variant Classification | dbSNP RS | HGVSc | HGVSp | HGVSp Short | SWISSPROT | BIOTYPE | SIFT | PolyPhen | Tumor Sample Barcode | Tissue | Histology | Sex | Age | Stage | Therapy Types | Drugs | Outcome |
| TM7SF2 | SNV | Missense_Mutation | novel | c.542N>A | p.Pro181His | p.P181H | O76062 | protein_coding | deleterious(0) | probably_damaging(1) | TCGA-2W-A8YY-01 | Cervix | cervical & endocervical cancer | Female | <65 | I/II | Chemotherapy | cisplatin | CR |
| TM7SF2 | SNV | Missense_Mutation | c.630G>A | p.Met210Ile | p.M210I | O76062 | protein_coding | tolerated(0.14) | benign(0) | TCGA-DS-A1OB-01 | Cervix | cervical & endocervical cancer | Female | <65 | I/II | Chemotherapy | carboplatin | PD | |
| TM7SF2 | SNV | Missense_Mutation | c.630N>C | p.Met210Ile | p.M210I | O76062 | protein_coding | tolerated(0.14) | benign(0) | TCGA-IR-A3LK-01 | Cervix | cervical & endocervical cancer | Female | >=65 | I/II | Chemotherapy | cisplatin | PD | |
| TM7SF2 | SNV | Missense_Mutation | c.694C>T | p.Leu232Phe | p.L232F | O76062 | protein_coding | tolerated(0.16) | probably_damaging(0.987) | TCGA-DM-A285-01 | Colorectum | colon adenocarcinoma | Female | >=65 | III/IV | Unknown | Unknown | SD | |
| TM7SF2 | SNV | Missense_Mutation | novel | c.1234N>T | p.Arg412Cys | p.R412C | O76062 | protein_coding | deleterious(0) | probably_damaging(0.999) | TCGA-F4-6570-01 | Colorectum | colon adenocarcinoma | Female | >=65 | I/II | Unknown | Unknown | SD |
| TM7SF2 | SNV | Missense_Mutation | c.310N>G | p.Gln104Glu | p.Q104E | O76062 | protein_coding | tolerated(0.16) | benign(0.296) | TCGA-AG-A01J-01 | Colorectum | rectum adenocarcinoma | Female | <65 | I/II | Unknown | Unknown | SD | |
| TM7SF2 | deletion | Frame_Shift_Del | c.487delN | p.Asn165ThrfsTer45 | p.N165Tfs*45 | O76062 | protein_coding | TCGA-AA-3663-01 | Colorectum | colon adenocarcinoma | Male | <65 | I/II | Unknown | Unknown | SD | |||
| TM7SF2 | SNV | Missense_Mutation | novel | c.1030N>A | p.Gly344Ser | p.G344S | O76062 | protein_coding | deleterious(0) | probably_damaging(1) | TCGA-A5-A0G2-01 | Endometrium | uterine corpus endometrioid carcinoma | Female | <65 | III/IV | Unknown | Unknown | SD |
| TM7SF2 | SNV | Missense_Mutation | novel | c.886N>G | p.Ile296Val | p.I296V | O76062 | protein_coding | tolerated(0.16) | benign(0.013) | TCGA-A5-A1OF-01 | Endometrium | uterine corpus endometrioid carcinoma | Female | <65 | I/II | Unknown | Unknown | SD |
| TM7SF2 | SNV | Missense_Mutation | novel | c.934A>C | p.Asn312His | p.N312H | O76062 | protein_coding | deleterious(0) | probably_damaging(0.99) | TCGA-AJ-A5DW-01 | Endometrium | uterine corpus endometrioid carcinoma | Female | <65 | I/II | Unknown | Unknown | SD |
| Page: 1 2 3 4 |
Top |
Related drugs of malignant transformation related genes |
| Identification of chemicals and drugs interact with genes involved in malignant transfromation |
| (DGIdb 4.0) |
| Entrez ID | Symbol | Category | Interaction Types | Drug Claim Name | Drug Name | PMIDs |
| Page: 1 |

Copyright 2023-Present -The University of Texas Health Science Center at Houston |