
|
|||||
|
 | |
| |
| |
| |
| |
| |
|
Gene: TM4SF5 |
Gene summary for TM4SF5 |
| Gene information | Species | Human | Gene symbol | TM4SF5 | Gene ID | 9032 |
| Gene name | transmembrane 4 L six family member 5 | |
| Gene Alias | TM4SF5 | |
| Cytomap | 17p13.2 | |
| Gene Type | protein-coding | GO ID | GO:0000082 | UniProtAcc | O14894 |
Top |
Malignant transformation analysis |
| Identification of the aberrant gene expression in precancerous and cancerous lesions by comparing the gene expression of stem-like cells in diseased tissues with normal stem cells |
| Entrez ID | Symbol | Replicates | Species | Organ | Tissue | Adj P-value | Log2FC | Malignancy |
| 9032 | TM4SF5 | HTA11_3410_2000001011 | Human | Colorectum | AD | 1.23e-04 | 1.31e-01 | 0.0155 |
| 9032 | TM4SF5 | HTA11_2487_2000001011 | Human | Colorectum | SER | 3.73e-17 | 6.35e-01 | -0.1808 |
| 9032 | TM4SF5 | HTA11_1938_2000001011 | Human | Colorectum | AD | 8.45e-11 | 3.07e-01 | -0.0811 |
| 9032 | TM4SF5 | HTA11_347_2000001011 | Human | Colorectum | AD | 2.37e-14 | 2.66e-01 | -0.1954 |
| 9032 | TM4SF5 | HTA11_411_2000001011 | Human | Colorectum | SER | 2.54e-19 | 1.41e+00 | -0.2602 |
| 9032 | TM4SF5 | HTA11_2112_2000001011 | Human | Colorectum | SER | 1.88e-13 | 9.30e-01 | -0.2196 |
| 9032 | TM4SF5 | HTA11_3361_2000001011 | Human | Colorectum | AD | 7.91e-05 | 1.79e-01 | -0.1207 |
| 9032 | TM4SF5 | HTA11_83_2000001011 | Human | Colorectum | SER | 1.47e-06 | 2.72e-01 | -0.1526 |
| 9032 | TM4SF5 | HTA11_696_2000001011 | Human | Colorectum | AD | 7.30e-09 | 3.04e-01 | -0.1464 |
| 9032 | TM4SF5 | HTA11_866_2000001011 | Human | Colorectum | AD | 1.15e-03 | 1.56e-01 | -0.1001 |
| 9032 | TM4SF5 | HTA11_1391_2000001011 | Human | Colorectum | AD | 1.62e-11 | 2.62e-01 | -0.059 |
| 9032 | TM4SF5 | HTA11_2992_2000001011 | Human | Colorectum | SER | 1.51e-04 | 2.51e-01 | -0.1706 |
| 9032 | TM4SF5 | HTA11_5212_2000001011 | Human | Colorectum | AD | 3.03e-03 | 2.03e-01 | -0.2061 |
| 9032 | TM4SF5 | HTA11_546_2000001011 | Human | Colorectum | AD | 2.65e-04 | 1.72e-01 | -0.0842 |
| 9032 | TM4SF5 | HTA11_7862_2000001011 | Human | Colorectum | AD | 1.96e-03 | 1.67e-01 | -0.0179 |
| 9032 | TM4SF5 | HTA11_866_3004761011 | Human | Colorectum | AD | 5.92e-06 | 1.65e-01 | 0.096 |
| 9032 | TM4SF5 | HTA11_8622_2000001021 | Human | Colorectum | SER | 2.50e-08 | 3.72e-01 | 0.0528 |
| 9032 | TM4SF5 | HTA11_10623_2000001011 | Human | Colorectum | AD | 3.04e-05 | 2.51e-01 | -0.0177 |
| 9032 | TM4SF5 | HTA11_6801_2000001011 | Human | Colorectum | SER | 2.21e-02 | 1.94e-01 | 0.0171 |
| 9032 | TM4SF5 | HTA11_10711_2000001011 | Human | Colorectum | AD | 9.64e-06 | 2.36e-01 | 0.0338 |
| Page: 1 2 3 4 |
| Tissue | Expression Dynamics | Abbreviation |
| Colorectum (GSE201348) |  | FAP: Familial adenomatous polyposis |
| CRC: Colorectal cancer | ||
| Colorectum (HTA11) |  | AD: Adenomas |
| SER: Sessile serrated lesions | ||
| MSI-H: Microsatellite-high colorectal cancer | ||
| MSS: Microsatellite stable colorectal cancer | ||
| GC | 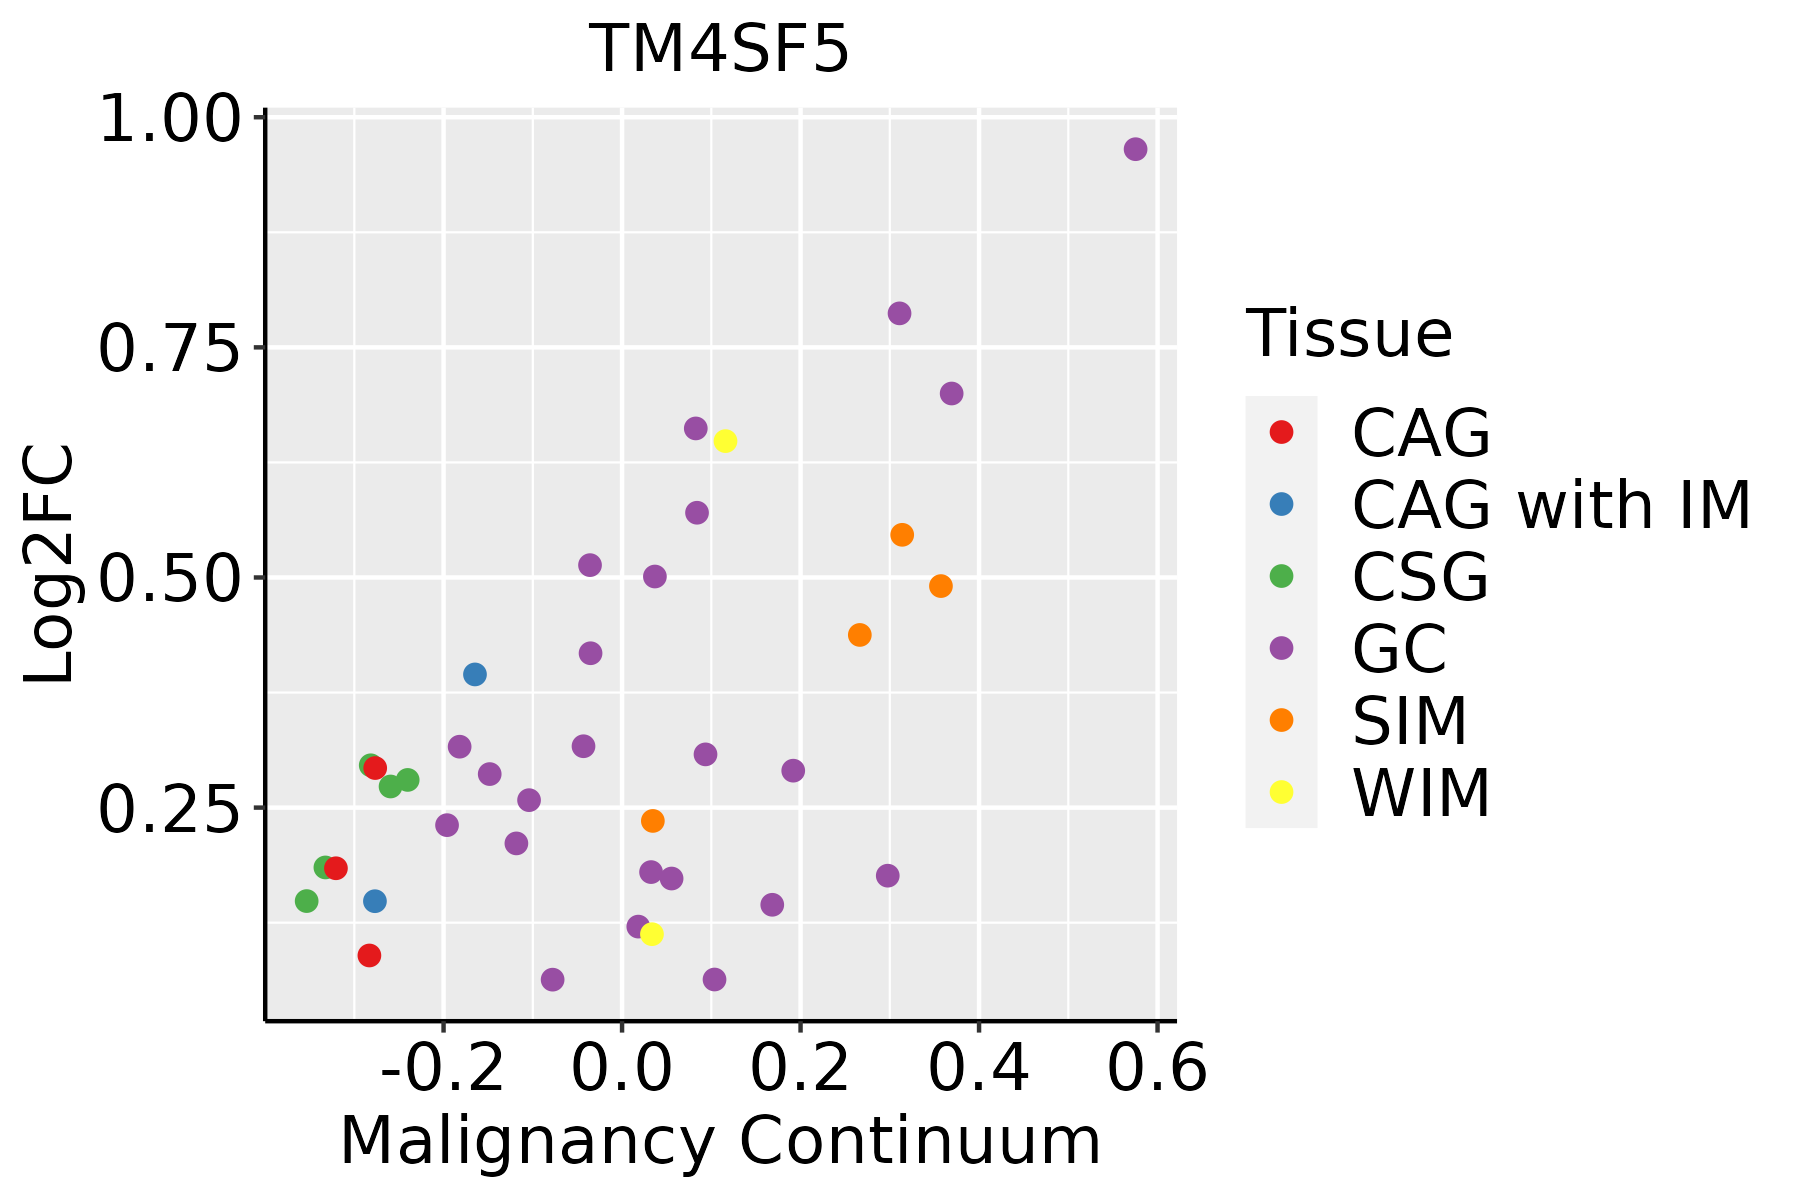 | CAG: Chronic atrophic gastritis |
| CAG with IM: Chronic atrophic gastritis with intestinal metaplasia | ||
| CSG: Chronic superficial gastritis | ||
| GC: Gastric cancer | ||
| SIM: Severe intestinal metaplasia | ||
| WIM: Wild intestinal metaplasia | ||
| Liver |  | HCC: Hepatocellular carcinoma |
| NAFLD: Non-alcoholic fatty liver disease |
| ∗log2FC in expression of this searched gene in stem-like cells from each diseased tissue sample relative to stem-like cells in normal samples in each tissue plotted against the malignancy continuum. Samples are colored based on if they are from different disease stage. |
Top |
Malignant transformation related pathway analysis |
| Find out the enriched GO biological processes and KEGG pathways involved in transition from healthy to precancer to cancer |
| Tissue | Disease Stage | Enriched GO biological Processes |
| Colorectum | AD |  |
| Colorectum | SER |  |
| Colorectum | MSS |  |
| Colorectum | MSI-H |  |
| Colorectum | FAP |  |
| ∗Top 15 enriched GO BP terms are showed in the bar plot of each disease state in each tissue. Each row represents a significant GO biological process which is colored according to the -log10(p.adjust). |
| Page: 1 2 3 4 5 6 7 8 9 |
| GO ID | Tissue | Disease Stage | Description | Gene Ratio | Bg Ratio | pvalue | p.adjust | Count |
| GO:0007346 | Colorectum | AD | regulation of mitotic cell cycle | 119/3918 | 457/18723 | 4.60e-03 | 3.14e-02 | 119 |
| GO:00073461 | Colorectum | MSS | regulation of mitotic cell cycle | 108/3467 | 457/18723 | 3.30e-03 | 2.50e-02 | 108 |
| GO:00447722 | Liver | HCC | mitotic cell cycle phase transition | 240/7958 | 424/18723 | 2.47e-09 | 6.84e-08 | 240 |
| GO:000734611 | Liver | HCC | regulation of mitotic cell cycle | 255/7958 | 457/18723 | 4.96e-09 | 1.30e-07 | 255 |
| GO:19019901 | Liver | HCC | regulation of mitotic cell cycle phase transition | 167/7958 | 299/18723 | 1.96e-06 | 2.71e-05 | 167 |
| GO:19019871 | Liver | HCC | regulation of cell cycle phase transition | 211/7958 | 390/18723 | 2.11e-06 | 2.89e-05 | 211 |
| GO:00448432 | Liver | HCC | cell cycle G1/S phase transition | 134/7958 | 241/18723 | 2.60e-05 | 2.70e-04 | 134 |
| GO:00000822 | Liver | HCC | G1/S transition of mitotic cell cycle | 119/7958 | 214/18723 | 7.11e-05 | 6.39e-04 | 119 |
| GO:1902806 | Liver | HCC | regulation of cell cycle G1/S phase transition | 91/7958 | 168/18723 | 1.47e-03 | 7.79e-03 | 91 |
| GO:20000451 | Liver | HCC | regulation of G1/S transition of mitotic cell cycle | 77/7958 | 142/18723 | 3.13e-03 | 1.45e-02 | 77 |
| Page: 1 |
| Pathway ID | Tissue | Disease Stage | Description | Gene Ratio | Bg Ratio | pvalue | p.adjust | qvalue | Count |
| Page: 1 |
Top |
Cell-cell communication analysis |
| Identification of potential cell-cell interactions between two cell types and their ligand-receptor pairs for different disease states |
| Ligand | Receptor | LRpair | Pathway | Tissue | Disease Stage |
| Page: 1 |
Top |
Single-cell gene regulatory network inference analysis |
| Find out the significant the regulons (TFs) and the target genes of each regulon across cell types for different disease states |
| TF | Cell Type | Tissue | Disease Stage | Target Gene | RSS | Regulon Activity |
| ∗The dot plots of a searched regulon are shown for all cell subpopulations in each disease state of each tissue based on the regulon specific score inferred using pySCENIC and by calculating the average expression. |
| Page: 1 |
Top |
Somatic mutation of malignant transformation related genes |
| Annotation of somatic variants for genes involved in malignant transformation |
| Hugo Symbol | Variant Class | Variant Classification | dbSNP RS | HGVSc | HGVSp | HGVSp Short | SWISSPROT | BIOTYPE | SIFT | PolyPhen | Tumor Sample Barcode | Tissue | Histology | Sex | Age | Stage | Therapy Types | Drugs | Outcome |
| TM4SF5 | SNV | Missense_Mutation | c.436N>C | p.Glu146Gln | p.E146Q | O14894 | protein_coding | tolerated(0.65) | benign(0.003) | TCGA-EA-A3HT-01 | Cervix | cervical & endocervical cancer | Female | >=65 | I/II | Unknown | Unknown | SD | |
| TM4SF5 | SNV | Missense_Mutation | novel | c.317C>T | p.Ser106Leu | p.S106L | O14894 | protein_coding | tolerated(0.18) | benign(0.146) | TCGA-IR-A3LF-01 | Cervix | cervical & endocervical cancer | Female | <65 | I/II | Unknown | Unknown | SD |
| TM4SF5 | SNV | Missense_Mutation | c.521N>T | p.Gly174Val | p.G174V | O14894 | protein_coding | tolerated(0.19) | probably_damaging(0.95) | TCGA-AA-3492-01 | Colorectum | colon adenocarcinoma | Female | >=65 | I/II | Unknown | Unknown | SD | |
| TM4SF5 | SNV | Missense_Mutation | c.436N>A | p.Glu146Lys | p.E146K | O14894 | protein_coding | tolerated(0.8) | benign(0.001) | TCGA-AD-5900-01 | Colorectum | colon adenocarcinoma | Male | >=65 | I/II | Unknown | Unknown | SD | |
| TM4SF5 | SNV | Missense_Mutation | rs199806115 | c.530N>C | p.Leu177Pro | p.L177P | O14894 | protein_coding | deleterious(0) | probably_damaging(0.979) | TCGA-F4-6460-01 | Colorectum | colon adenocarcinoma | Female | <65 | III/IV | Chemotherapy | capecitabine | PD |
| TM4SF5 | SNV | Missense_Mutation | c.338N>A | p.Arg113Gln | p.R113Q | O14894 | protein_coding | tolerated(0.57) | benign(0.009) | TCGA-EI-6917-01 | Colorectum | rectum adenocarcinoma | Male | <65 | III/IV | Chemotherapy | 5fluorouracil+oxaciplatina+l-folinian | SD | |
| TM4SF5 | insertion | Frame_Shift_Ins | rs780191120 | c.570_571insA | p.Gln193ThrfsTer10 | p.Q193Tfs*10 | O14894 | protein_coding | TCGA-CM-4743-01 | Colorectum | colon adenocarcinoma | Male | >=65 | I/II | Chemotherapy | capecitabine | SD | ||
| TM4SF5 | SNV | Missense_Mutation | novel | c.360G>A | p.Met120Ile | p.M120I | O14894 | protein_coding | tolerated(0.43) | benign(0) | TCGA-AJ-A8CW-01 | Endometrium | uterine corpus endometrioid carcinoma | Female | <65 | I/II | Unknown | Unknown | SD |
| TM4SF5 | SNV | Missense_Mutation | c.338N>A | p.Arg113Gln | p.R113Q | O14894 | protein_coding | tolerated(0.57) | benign(0.009) | TCGA-AP-A056-01 | Endometrium | uterine corpus endometrioid carcinoma | Female | <65 | I/II | Unknown | Unknown | SD | |
| TM4SF5 | SNV | Missense_Mutation | c.46A>G | p.Thr16Ala | p.T16A | O14894 | protein_coding | tolerated(1) | benign(0.007) | TCGA-AP-A0LM-01 | Endometrium | uterine corpus endometrioid carcinoma | Female | <65 | III/IV | Chemotherapy | cisplatin | SD |
| Page: 1 2 3 |
Top |
Related drugs of malignant transformation related genes |
| Identification of chemicals and drugs interact with genes involved in malignant transfromation |
| (DGIdb 4.0) |
| Entrez ID | Symbol | Category | Interaction Types | Drug Claim Name | Drug Name | PMIDs |
| Page: 1 |

Copyright 2023-Present -The University of Texas Health Science Center at Houston |