
|
|||||
|
 | |
| |
| |
| |
| |
| |
|
Gene: TM4SF4 |
Gene summary for TM4SF4 |
| Gene information | Species | Human | Gene symbol | TM4SF4 | Gene ID | 7104 |
| Gene name | transmembrane 4 L six family member 4 | |
| Gene Alias | ILTMP | |
| Cytomap | 3q25.1 | |
| Gene Type | protein-coding | GO ID | GO:0008150 | UniProtAcc | P48230 |
Top |
Malignant transformation analysis |
| Identification of the aberrant gene expression in precancerous and cancerous lesions by comparing the gene expression of stem-like cells in diseased tissues with normal stem cells |
| Entrez ID | Symbol | Replicates | Species | Organ | Tissue | Adj P-value | Log2FC | Malignancy |
| 7104 | TM4SF4 | HTA11_2487_2000001011 | Human | Colorectum | SER | 3.73e-17 | 1.16e+00 | -0.1808 |
| 7104 | TM4SF4 | HTA11_411_2000001011 | Human | Colorectum | SER | 5.61e-03 | 7.17e-01 | -0.2602 |
| 7104 | TM4SF4 | NAFLD1 | Human | Liver | NAFLD | 2.43e-09 | -1.01e+00 | -0.04 |
| 7104 | TM4SF4 | S41 | Human | Liver | Cirrhotic | 4.90e-21 | -1.57e+00 | -0.0343 |
| 7104 | TM4SF4 | S42 | Human | Liver | HCC | 4.42e-14 | -1.58e+00 | -0.0103 |
| 7104 | TM4SF4 | S43 | Human | Liver | Cirrhotic | 8.12e-35 | -7.61e-01 | -0.0187 |
| 7104 | TM4SF4 | S44 | Human | Liver | HCC | 1.86e-11 | -1.56e+00 | -0.0083 |
| 7104 | TM4SF4 | HCC1_Meng | Human | Liver | HCC | 1.53e-113 | -9.07e-01 | 0.0246 |
| 7104 | TM4SF4 | HCC2_Meng | Human | Liver | HCC | 3.14e-92 | -1.61e+00 | 0.0107 |
| 7104 | TM4SF4 | cirrhotic2 | Human | Liver | Cirrhotic | 1.49e-04 | 1.75e-01 | 0.0201 |
| 7104 | TM4SF4 | cirrhotic3 | Human | Liver | Cirrhotic | 2.42e-05 | -3.72e-01 | 0.0215 |
| 7104 | TM4SF4 | p6 | Human | Liver | Cyst | 1.20e-28 | -1.82e+00 | -0.0218 |
| 7104 | TM4SF4 | HCC1 | Human | Liver | HCC | 1.09e-13 | 1.46e+00 | 0.5336 |
| 7104 | TM4SF4 | HCC2 | Human | Liver | HCC | 1.52e-19 | 3.89e+00 | 0.5341 |
| 7104 | TM4SF4 | HCC5 | Human | Liver | HCC | 7.74e-55 | -1.34e+00 | 0.4932 |
| 7104 | TM4SF4 | Pt13.a | Human | Liver | HCC | 5.10e-30 | -5.06e-01 | 0.021 |
| 7104 | TM4SF4 | Pt13.b | Human | Liver | HCC | 1.87e-29 | -4.58e-01 | 0.0251 |
| 7104 | TM4SF4 | Pt13.c | Human | Liver | HCC | 1.59e-33 | -1.23e+00 | 0.0076 |
| 7104 | TM4SF4 | Pt14.a | Human | Liver | HCC | 9.15e-08 | -6.46e-01 | 0.0169 |
| 7104 | TM4SF4 | Pt14.b | Human | Liver | HCC | 3.17e-07 | -5.58e-01 | 0.018 |
| Page: 1 2 |
| Tissue | Expression Dynamics | Abbreviation |
| Colorectum (GSE201348) | 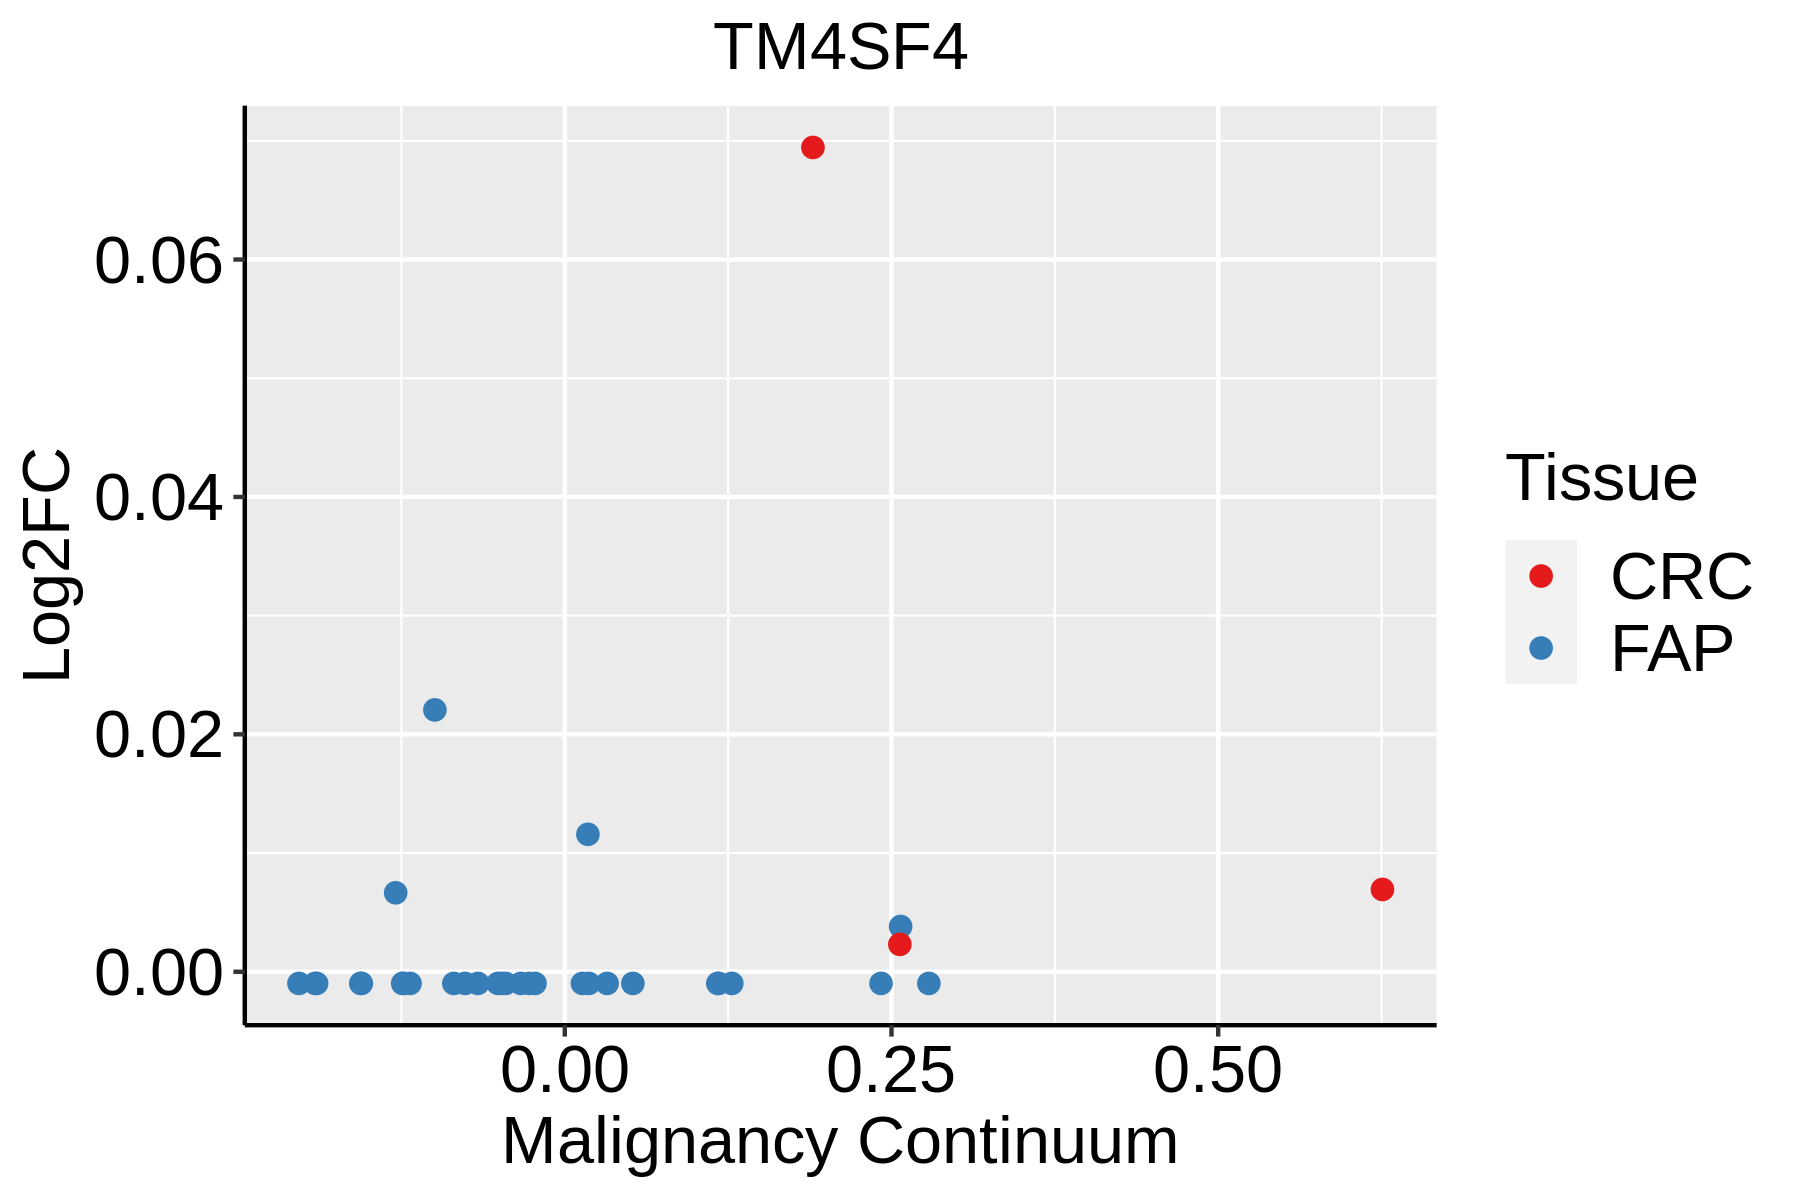 | FAP: Familial adenomatous polyposis |
| CRC: Colorectal cancer | ||
| Colorectum (HTA11) |  | AD: Adenomas |
| SER: Sessile serrated lesions | ||
| MSI-H: Microsatellite-high colorectal cancer | ||
| MSS: Microsatellite stable colorectal cancer | ||
| GC |  | CAG: Chronic atrophic gastritis |
| CAG with IM: Chronic atrophic gastritis with intestinal metaplasia | ||
| CSG: Chronic superficial gastritis | ||
| GC: Gastric cancer | ||
| SIM: Severe intestinal metaplasia | ||
| WIM: Wild intestinal metaplasia | ||
| Liver | 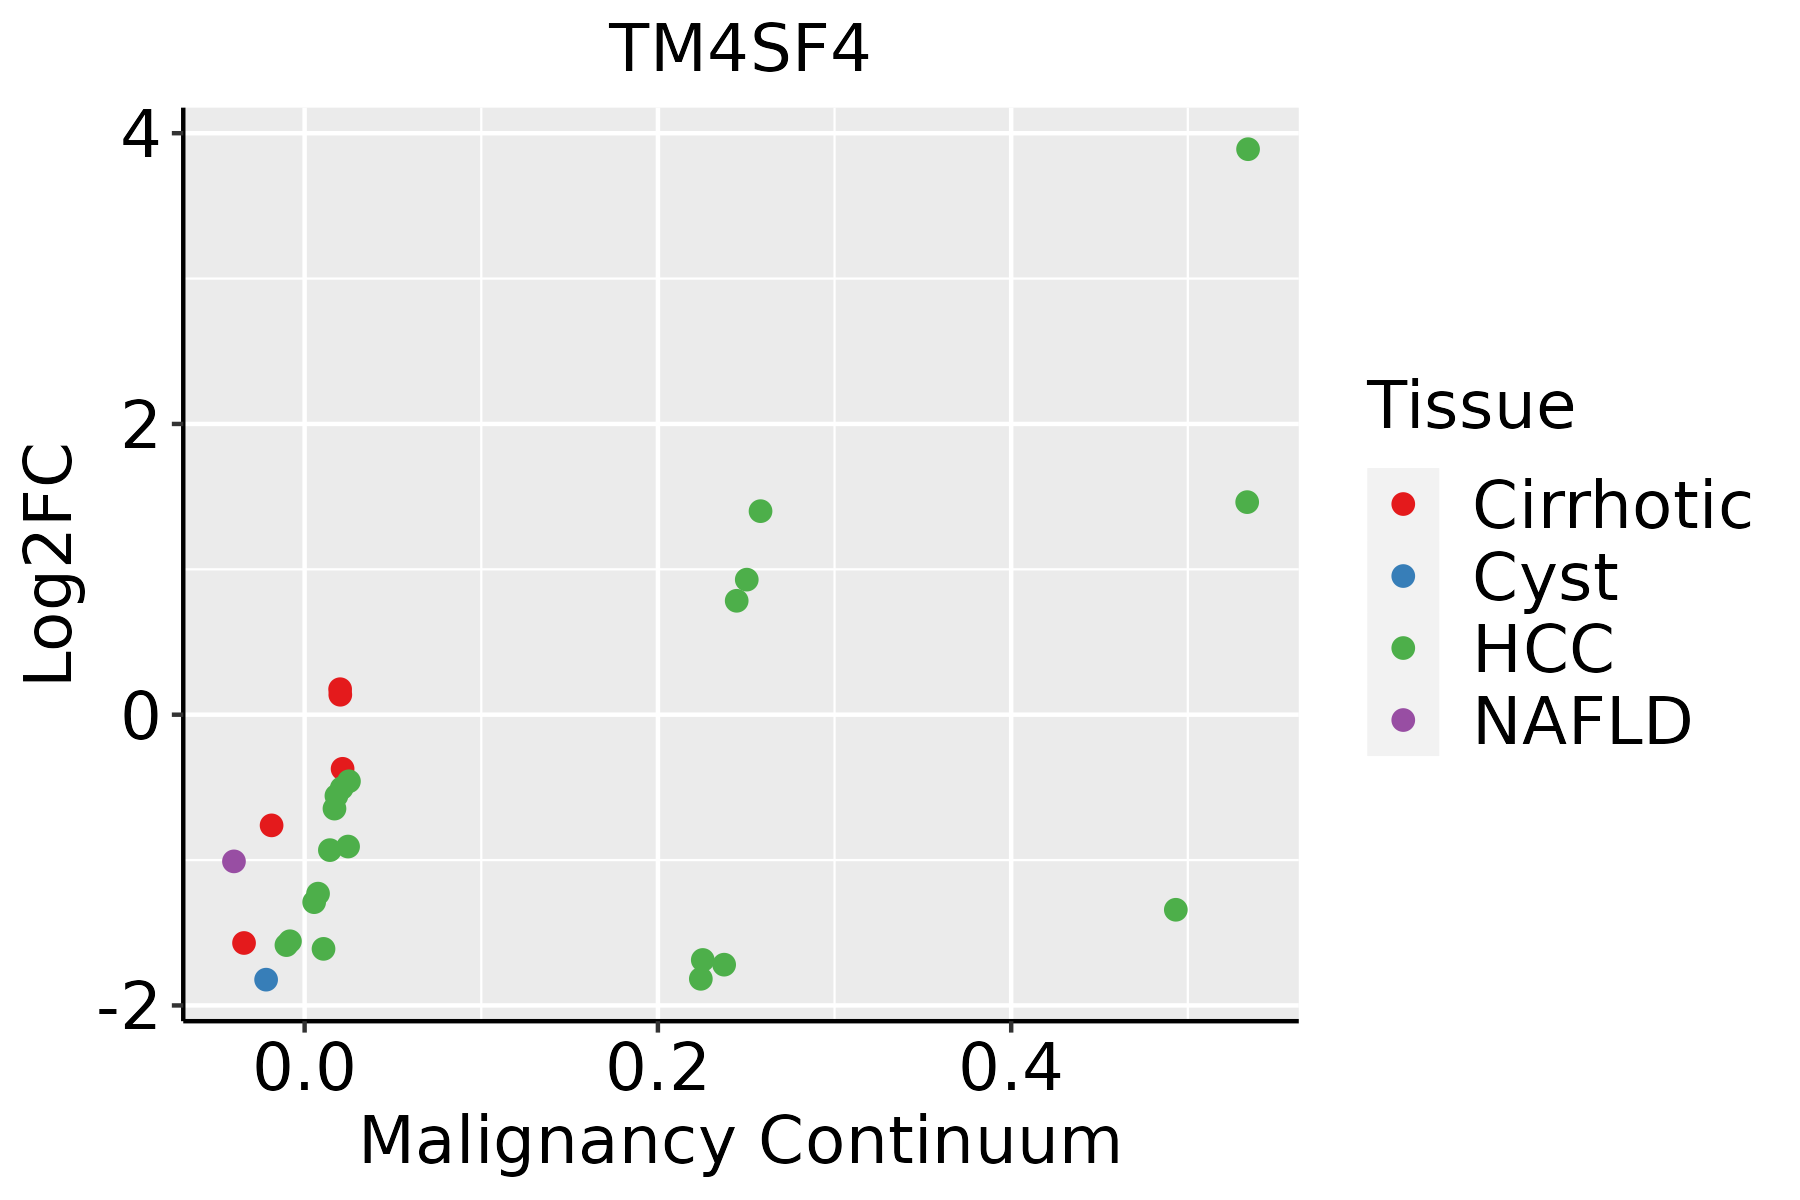 | HCC: Hepatocellular carcinoma |
| NAFLD: Non-alcoholic fatty liver disease |
| ∗log2FC in expression of this searched gene in stem-like cells from each diseased tissue sample relative to stem-like cells in normal samples in each tissue plotted against the malignancy continuum. Samples are colored based on if they are from different disease stage. |
Top |
Malignant transformation related pathway analysis |
| Find out the enriched GO biological processes and KEGG pathways involved in transition from healthy to precancer to cancer |
| Tissue | Disease Stage | Enriched GO biological Processes |
| Colorectum | AD |  |
| Colorectum | SER |  |
| Colorectum | MSS |  |
| Colorectum | MSI-H |  |
| Colorectum | FAP |  |
| ∗Top 15 enriched GO BP terms are showed in the bar plot of each disease state in each tissue. Each row represents a significant GO biological process which is colored according to the -log10(p.adjust). |
| Page: 1 2 3 4 5 6 7 8 9 |
| GO ID | Tissue | Disease Stage | Description | Gene Ratio | Bg Ratio | pvalue | p.adjust | Count |
| GO:00310993 | Liver | NAFLD | regeneration | 35/1882 | 198/18723 | 6.67e-04 | 8.61e-03 | 35 |
| GO:003109911 | Liver | Cirrhotic | regeneration | 71/4634 | 198/18723 | 3.02e-04 | 2.65e-03 | 71 |
| GO:00310992 | Liver | HCC | regeneration | 107/7958 | 198/18723 | 6.67e-04 | 4.12e-03 | 107 |
| Page: 1 |
| Pathway ID | Tissue | Disease Stage | Description | Gene Ratio | Bg Ratio | pvalue | p.adjust | qvalue | Count |
| Page: 1 |
Top |
Cell-cell communication analysis |
| Identification of potential cell-cell interactions between two cell types and their ligand-receptor pairs for different disease states |
| Ligand | Receptor | LRpair | Pathway | Tissue | Disease Stage |
| Page: 1 |
Top |
Single-cell gene regulatory network inference analysis |
| Find out the significant the regulons (TFs) and the target genes of each regulon across cell types for different disease states |
| TF | Cell Type | Tissue | Disease Stage | Target Gene | RSS | Regulon Activity |
| ∗The dot plots of a searched regulon are shown for all cell subpopulations in each disease state of each tissue based on the regulon specific score inferred using pySCENIC and by calculating the average expression. |
| Page: 1 |
Top |
Somatic mutation of malignant transformation related genes |
| Annotation of somatic variants for genes involved in malignant transformation |
| Hugo Symbol | Variant Class | Variant Classification | dbSNP RS | HGVSc | HGVSp | HGVSp Short | SWISSPROT | BIOTYPE | SIFT | PolyPhen | Tumor Sample Barcode | Tissue | Histology | Sex | Age | Stage | Therapy Types | Drugs | Outcome |
| TM4SF4 | SNV | Missense_Mutation | rs188249785 | c.188N>T | p.Ala63Val | p.A63V | P48230 | protein_coding | deleterious(0.03) | benign(0.103) | TCGA-AA-3852-01 | Colorectum | colon adenocarcinoma | Male | >=65 | I/II | Unknown | Unknown | PD |
| TM4SF4 | SNV | Missense_Mutation | c.497N>C | p.Val166Ala | p.V166A | P48230 | protein_coding | tolerated(0.32) | benign(0.266) | TCGA-AD-5900-01 | Colorectum | colon adenocarcinoma | Male | >=65 | I/II | Unknown | Unknown | SD | |
| TM4SF4 | SNV | Missense_Mutation | c.512N>A | p.Met171Lys | p.M171K | P48230 | protein_coding | deleterious(0.02) | benign(0.285) | TCGA-AD-6964-01 | Colorectum | colon adenocarcinoma | Male | <65 | III/IV | Chemotherapy | folfox | PD | |
| TM4SF4 | SNV | Missense_Mutation | novel | c.300N>A | p.Phe100Leu | p.F100L | P48230 | protein_coding | tolerated(0.51) | benign(0.007) | TCGA-AX-A05Z-01 | Endometrium | uterine corpus endometrioid carcinoma | Female | <65 | III/IV | Chemotherapy | adriamycin | SD |
| TM4SF4 | SNV | Missense_Mutation | novel | c.542G>A | p.Gly181Asp | p.G181D | P48230 | protein_coding | deleterious(0) | probably_damaging(0.992) | TCGA-AX-A06F-01 | Endometrium | uterine corpus endometrioid carcinoma | Female | <65 | III/IV | Chemotherapy | carboplatin | SD |
| TM4SF4 | SNV | Missense_Mutation | rs556358999 | c.148N>A | p.Gly50Arg | p.G50R | P48230 | protein_coding | deleterious(0.01) | probably_damaging(0.995) | TCGA-AX-A1CE-01 | Endometrium | uterine corpus endometrioid carcinoma | Female | <65 | I/II | Unspecific | Paclitaxel | SD |
| TM4SF4 | SNV | Missense_Mutation | c.386A>G | p.Tyr129Cys | p.Y129C | P48230 | protein_coding | deleterious(0) | probably_damaging(0.986) | TCGA-B5-A11G-01 | Endometrium | uterine corpus endometrioid carcinoma | Female | >=65 | I/II | Unknown | Unknown | SD | |
| TM4SF4 | SNV | Missense_Mutation | c.257N>A | p.Arg86Gln | p.R86Q | P48230 | protein_coding | deleterious(0.02) | probably_damaging(0.971) | TCGA-BS-A0UF-01 | Endometrium | uterine corpus endometrioid carcinoma | Female | >=65 | I/II | Unknown | Unknown | SD | |
| TM4SF4 | SNV | Missense_Mutation | novel | c.110A>G | p.Asp37Gly | p.D37G | P48230 | protein_coding | tolerated(0.29) | possibly_damaging(0.457) | TCGA-EC-A1NJ-01 | Endometrium | uterine corpus endometrioid carcinoma | Female | >=65 | I/II | Unknown | Unknown | SD |
| TM4SF4 | insertion | Frame_Shift_Ins | novel | c.84_85insT | p.Pro31SerfsTer8 | p.P31Sfs*8 | P48230 | protein_coding | TCGA-AP-A059-01 | Endometrium | uterine corpus endometrioid carcinoma | Female | >=65 | I/II | Unknown | Unknown | SD |
| Page: 1 2 3 |
Top |
Related drugs of malignant transformation related genes |
| Identification of chemicals and drugs interact with genes involved in malignant transfromation |
| (DGIdb 4.0) |
| Entrez ID | Symbol | Category | Interaction Types | Drug Claim Name | Drug Name | PMIDs |
| Page: 1 |

Copyright 2023-Present -The University of Texas Health Science Center at Houston |