
|
|||||
|
 | |
| |
| |
| |
| |
| |
|
Gene: TM4SF19 |
Gene summary for TM4SF19 |
| Gene information | Species | Human | Gene symbol | TM4SF19 | Gene ID | 116211 |
| Gene name | transmembrane 4 L six family member 19 | |
| Gene Alias | OCTM4 | |
| Cytomap | 3q29 | |
| Gene Type | protein-coding | GO ID | GO:0005575 | UniProtAcc | B7ZW46 |
Top |
Malignant transformation analysis |
| Identification of the aberrant gene expression in precancerous and cancerous lesions by comparing the gene expression of stem-like cells in diseased tissues with normal stem cells |
| Entrez ID | Symbol | Replicates | Species | Organ | Tissue | Adj P-value | Log2FC | Malignancy |
| 116211 | TM4SF19 | LZE4T | Human | Esophagus | ESCC | 6.29e-20 | 5.38e-01 | 0.0811 |
| 116211 | TM4SF19 | LZE7T | Human | Esophagus | ESCC | 6.13e-07 | 4.46e-01 | 0.0667 |
| 116211 | TM4SF19 | LZE22T | Human | Esophagus | ESCC | 1.57e-03 | 3.08e-01 | 0.068 |
| 116211 | TM4SF19 | LZE21T | Human | Esophagus | ESCC | 9.73e-05 | 3.22e-01 | 0.0655 |
| 116211 | TM4SF19 | P1T-E | Human | Esophagus | ESCC | 3.58e-07 | 4.47e-01 | 0.0875 |
| 116211 | TM4SF19 | P4T-E | Human | Esophagus | ESCC | 1.49e-09 | 3.04e-01 | 0.1323 |
| 116211 | TM4SF19 | P5T-E | Human | Esophagus | ESCC | 2.20e-48 | 8.83e-01 | 0.1327 |
| 116211 | TM4SF19 | P9T-E | Human | Esophagus | ESCC | 5.22e-18 | 5.06e-01 | 0.1131 |
| 116211 | TM4SF19 | P11T-E | Human | Esophagus | ESCC | 6.08e-06 | 4.02e-01 | 0.1426 |
| 116211 | TM4SF19 | P19T-E | Human | Esophagus | ESCC | 7.48e-03 | 4.05e-01 | 0.1662 |
| 116211 | TM4SF19 | P20T-E | Human | Esophagus | ESCC | 1.16e-15 | 3.80e-01 | 0.1124 |
| 116211 | TM4SF19 | P22T-E | Human | Esophagus | ESCC | 1.13e-16 | 3.65e-01 | 0.1236 |
| 116211 | TM4SF19 | P23T-E | Human | Esophagus | ESCC | 7.50e-13 | 3.43e-01 | 0.108 |
| 116211 | TM4SF19 | P24T-E | Human | Esophagus | ESCC | 1.59e-30 | 9.07e-01 | 0.1287 |
| 116211 | TM4SF19 | P26T-E | Human | Esophagus | ESCC | 8.84e-05 | 1.21e-01 | 0.1276 |
| 116211 | TM4SF19 | P27T-E | Human | Esophagus | ESCC | 7.90e-03 | 9.88e-02 | 0.1055 |
| 116211 | TM4SF19 | P28T-E | Human | Esophagus | ESCC | 6.36e-33 | 6.50e-01 | 0.1149 |
| 116211 | TM4SF19 | P31T-E | Human | Esophagus | ESCC | 2.02e-06 | 1.73e-01 | 0.1251 |
| 116211 | TM4SF19 | P36T-E | Human | Esophagus | ESCC | 5.48e-08 | 5.66e-01 | 0.1187 |
| 116211 | TM4SF19 | P37T-E | Human | Esophagus | ESCC | 8.12e-10 | 2.38e-01 | 0.1371 |
| Page: 1 2 |
| Tissue | Expression Dynamics | Abbreviation |
| Esophagus | 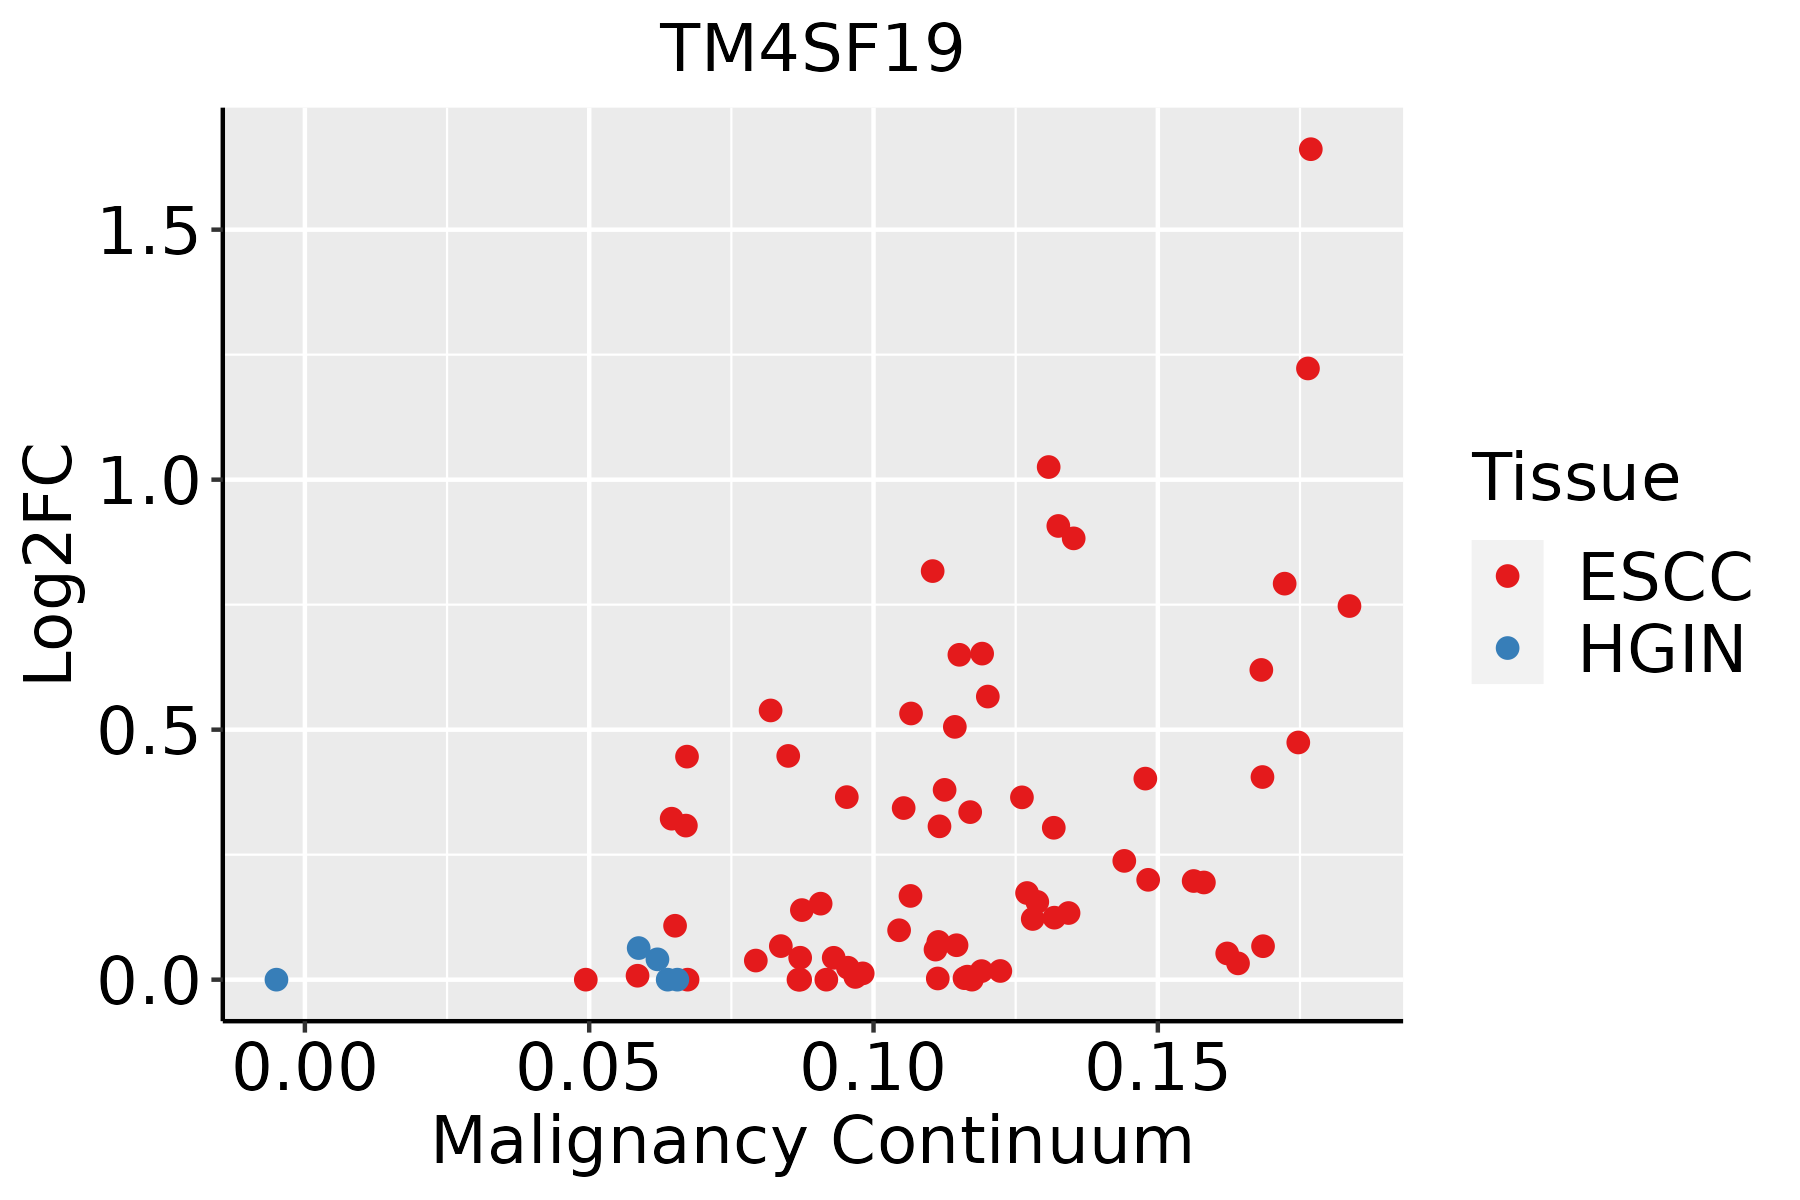 | ESCC: Esophageal squamous cell carcinoma |
| HGIN: High-grade intraepithelial neoplasias | ||
| LGIN: Low-grade intraepithelial neoplasias |
| ∗log2FC in expression of this searched gene in stem-like cells from each diseased tissue sample relative to stem-like cells in normal samples in each tissue plotted against the malignancy continuum. Samples are colored based on if they are from different disease stage. |
Top |
Malignant transformation related pathway analysis |
| Find out the enriched GO biological processes and KEGG pathways involved in transition from healthy to precancer to cancer |
| Tissue | Disease Stage | Enriched GO biological Processes |
| Colorectum | AD |  |
| Colorectum | SER |  |
| Colorectum | MSS |  |
| Colorectum | MSI-H |  |
| Colorectum | FAP |  |
| ∗Top 15 enriched GO BP terms are showed in the bar plot of each disease state in each tissue. Each row represents a significant GO biological process which is colored according to the -log10(p.adjust). |
| Page: 1 2 3 4 5 6 7 8 9 |
| GO ID | Tissue | Disease Stage | Description | Gene Ratio | Bg Ratio | pvalue | p.adjust | Count |
| Page: 1 |
| Pathway ID | Tissue | Disease Stage | Description | Gene Ratio | Bg Ratio | pvalue | p.adjust | qvalue | Count |
| Page: 1 |
Top |
Cell-cell communication analysis |
| Identification of potential cell-cell interactions between two cell types and their ligand-receptor pairs for different disease states |
| Ligand | Receptor | LRpair | Pathway | Tissue | Disease Stage |
| Page: 1 |
Top |
Single-cell gene regulatory network inference analysis |
| Find out the significant the regulons (TFs) and the target genes of each regulon across cell types for different disease states |
| TF | Cell Type | Tissue | Disease Stage | Target Gene | RSS | Regulon Activity |
| ∗The dot plots of a searched regulon are shown for all cell subpopulations in each disease state of each tissue based on the regulon specific score inferred using pySCENIC and by calculating the average expression. |
| Page: 1 |
Top |
Somatic mutation of malignant transformation related genes |
| Annotation of somatic variants for genes involved in malignant transformation |
| Hugo Symbol | Variant Class | Variant Classification | dbSNP RS | HGVSc | HGVSp | HGVSp Short | SWISSPROT | BIOTYPE | SIFT | PolyPhen | Tumor Sample Barcode | Tissue | Histology | Sex | Age | Stage | Therapy Types | Drugs | Outcome |
| TM4SF19 | SNV | Missense_Mutation | c.76N>T | p.Ala26Ser | p.A26S | Q96DZ7 | protein_coding | tolerated(0.12) | benign(0.106) | TCGA-AR-A24U-01 | Breast | breast invasive carcinoma | Female | <65 | I/II | Chemotherapy | doxorubicin | SD | |
| TM4SF19 | insertion | Frame_Shift_Ins | novel | c.431_432insGGGAGGCCACGGTGGGTGGA | p.Phe144LeufsTer108 | p.F144Lfs*108 | Q96DZ7 | protein_coding | TCGA-A8-A07G-01 | Breast | breast invasive carcinoma | Female | >=65 | I/II | Chemotherapy | 5-fluorouracil | CR | ||
| TM4SF19 | SNV | Missense_Mutation | rs750021035 | c.467G>A | p.Arg156His | p.R156H | Q96DZ7 | protein_coding | tolerated(0.68) | benign(0.005) | TCGA-C5-A7CK-01 | Cervix | cervical & endocervical cancer | Female | <65 | I/II | Chemotherapy | cisplatin | SD |
| TM4SF19 | SNV | Missense_Mutation | c.247G>C | p.Gly83Arg | p.G83R | Q96DZ7 | protein_coding | tolerated(0.09) | probably_damaging(0.964) | TCGA-AA-3971-01 | Colorectum | colon adenocarcinoma | Male | <65 | III/IV | Chemotherapy | folinic | CR | |
| TM4SF19 | SNV | Missense_Mutation | c.601N>A | p.Gly201Ser | p.G201S | Q96DZ7 | protein_coding | tolerated(0.09) | benign(0.411) | TCGA-AD-6895-01 | Colorectum | colon adenocarcinoma | Male | >=65 | III/IV | Unknown | Unknown | SD | |
| TM4SF19 | SNV | Missense_Mutation | c.544N>C | p.Cys182Arg | p.C182R | Q96DZ7 | protein_coding | tolerated(0.07) | possibly_damaging(0.796) | TCGA-CA-6718-01 | Colorectum | colon adenocarcinoma | Male | <65 | I/II | Unknown | Unknown | PD | |
| TM4SF19 | SNV | Missense_Mutation | c.593G>T | p.Ser198Ile | p.S198I | Q96DZ7 | protein_coding | deleterious(0) | possibly_damaging(0.713) | TCGA-F4-6570-01 | Colorectum | colon adenocarcinoma | Female | >=65 | I/II | Unknown | Unknown | SD | |
| TM4SF19 | SNV | Missense_Mutation | novel | c.236N>T | p.Gly79Val | p.G79V | Q96DZ7 | protein_coding | deleterious(0) | probably_damaging(1) | TCGA-AG-A002-01 | Colorectum | rectum adenocarcinoma | Male | <65 | I/II | Unknown | Unknown | SD |
| TM4SF19 | SNV | Missense_Mutation | c.305N>A | p.Gly102Asp | p.G102D | Q96DZ7 | protein_coding | tolerated(0.09) | possibly_damaging(0.691) | TCGA-AP-A051-01 | Endometrium | uterine corpus endometrioid carcinoma | Female | >=65 | I/II | Unknown | Unknown | SD | |
| TM4SF19 | SNV | Missense_Mutation | rs564896096 | c.275N>A | p.Arg92Gln | p.R92Q | Q96DZ7 | protein_coding | tolerated(0.71) | benign(0.003) | TCGA-AX-A062-01 | Endometrium | uterine corpus endometrioid carcinoma | Female | <65 | I/II | Unknown | Unknown | SD |
| Page: 1 2 3 |
Top |
Related drugs of malignant transformation related genes |
| Identification of chemicals and drugs interact with genes involved in malignant transfromation |
| (DGIdb 4.0) |
| Entrez ID | Symbol | Category | Interaction Types | Drug Claim Name | Drug Name | PMIDs |
| Page: 1 |

Copyright 2023-Present -The University of Texas Health Science Center at Houston |