
|
|||||
|
 | |
| |
| |
| |
| |
| |
|
Gene: TM2D3 |
Gene summary for TM2D3 |
| Gene information | Species | Human | Gene symbol | TM2D3 | Gene ID | 80213 |
| Gene name | TM2 domain containing 3 | |
| Gene Alias | BLP2 | |
| Cytomap | 15q26.3 | |
| Gene Type | protein-coding | GO ID | GO:0007154 | UniProtAcc | B4DLL2 |
Top |
Malignant transformation analysis |
| Identification of the aberrant gene expression in precancerous and cancerous lesions by comparing the gene expression of stem-like cells in diseased tissues with normal stem cells |
| Entrez ID | Symbol | Replicates | Species | Organ | Tissue | Adj P-value | Log2FC | Malignancy |
| 80213 | TM2D3 | LZE2D | Human | Esophagus | HGIN | 5.40e-03 | 2.21e-01 | 0.0642 |
| 80213 | TM2D3 | LZE3D | Human | Esophagus | HGIN | 3.98e-05 | 5.20e-01 | 0.0668 |
| 80213 | TM2D3 | LZE4T | Human | Esophagus | ESCC | 9.80e-22 | 4.57e-01 | 0.0811 |
| 80213 | TM2D3 | LZE7T | Human | Esophagus | ESCC | 6.45e-07 | 4.34e-01 | 0.0667 |
| 80213 | TM2D3 | LZE8T | Human | Esophagus | ESCC | 4.23e-15 | 1.89e-01 | 0.067 |
| 80213 | TM2D3 | LZE20T | Human | Esophagus | ESCC | 5.20e-04 | 7.16e-02 | 0.0662 |
| 80213 | TM2D3 | LZE24T | Human | Esophagus | ESCC | 2.88e-15 | 2.92e-01 | 0.0596 |
| 80213 | TM2D3 | LZE22D3 | Human | Esophagus | HGIN | 2.06e-02 | 2.83e-01 | 0.0653 |
| 80213 | TM2D3 | LZE21T | Human | Esophagus | ESCC | 5.59e-03 | 9.58e-02 | 0.0655 |
| 80213 | TM2D3 | LZE6T | Human | Esophagus | ESCC | 2.36e-09 | 2.11e-01 | 0.0845 |
| 80213 | TM2D3 | P1T-E | Human | Esophagus | ESCC | 2.08e-08 | 3.68e-01 | 0.0875 |
| 80213 | TM2D3 | P2T-E | Human | Esophagus | ESCC | 1.94e-28 | 5.51e-01 | 0.1177 |
| 80213 | TM2D3 | P4T-E | Human | Esophagus | ESCC | 2.68e-39 | 8.23e-01 | 0.1323 |
| 80213 | TM2D3 | P5T-E | Human | Esophagus | ESCC | 7.74e-30 | 6.95e-01 | 0.1327 |
| 80213 | TM2D3 | P8T-E | Human | Esophagus | ESCC | 4.81e-33 | 7.38e-01 | 0.0889 |
| 80213 | TM2D3 | P9T-E | Human | Esophagus | ESCC | 2.10e-33 | 7.65e-01 | 0.1131 |
| 80213 | TM2D3 | P10T-E | Human | Esophagus | ESCC | 1.43e-39 | 8.53e-01 | 0.116 |
| 80213 | TM2D3 | P11T-E | Human | Esophagus | ESCC | 1.40e-18 | 7.44e-01 | 0.1426 |
| 80213 | TM2D3 | P12T-E | Human | Esophagus | ESCC | 1.67e-36 | 7.72e-01 | 0.1122 |
| 80213 | TM2D3 | P15T-E | Human | Esophagus | ESCC | 9.66e-46 | 9.17e-01 | 0.1149 |
| Page: 1 2 3 4 5 6 |
| Tissue | Expression Dynamics | Abbreviation |
| Esophagus | 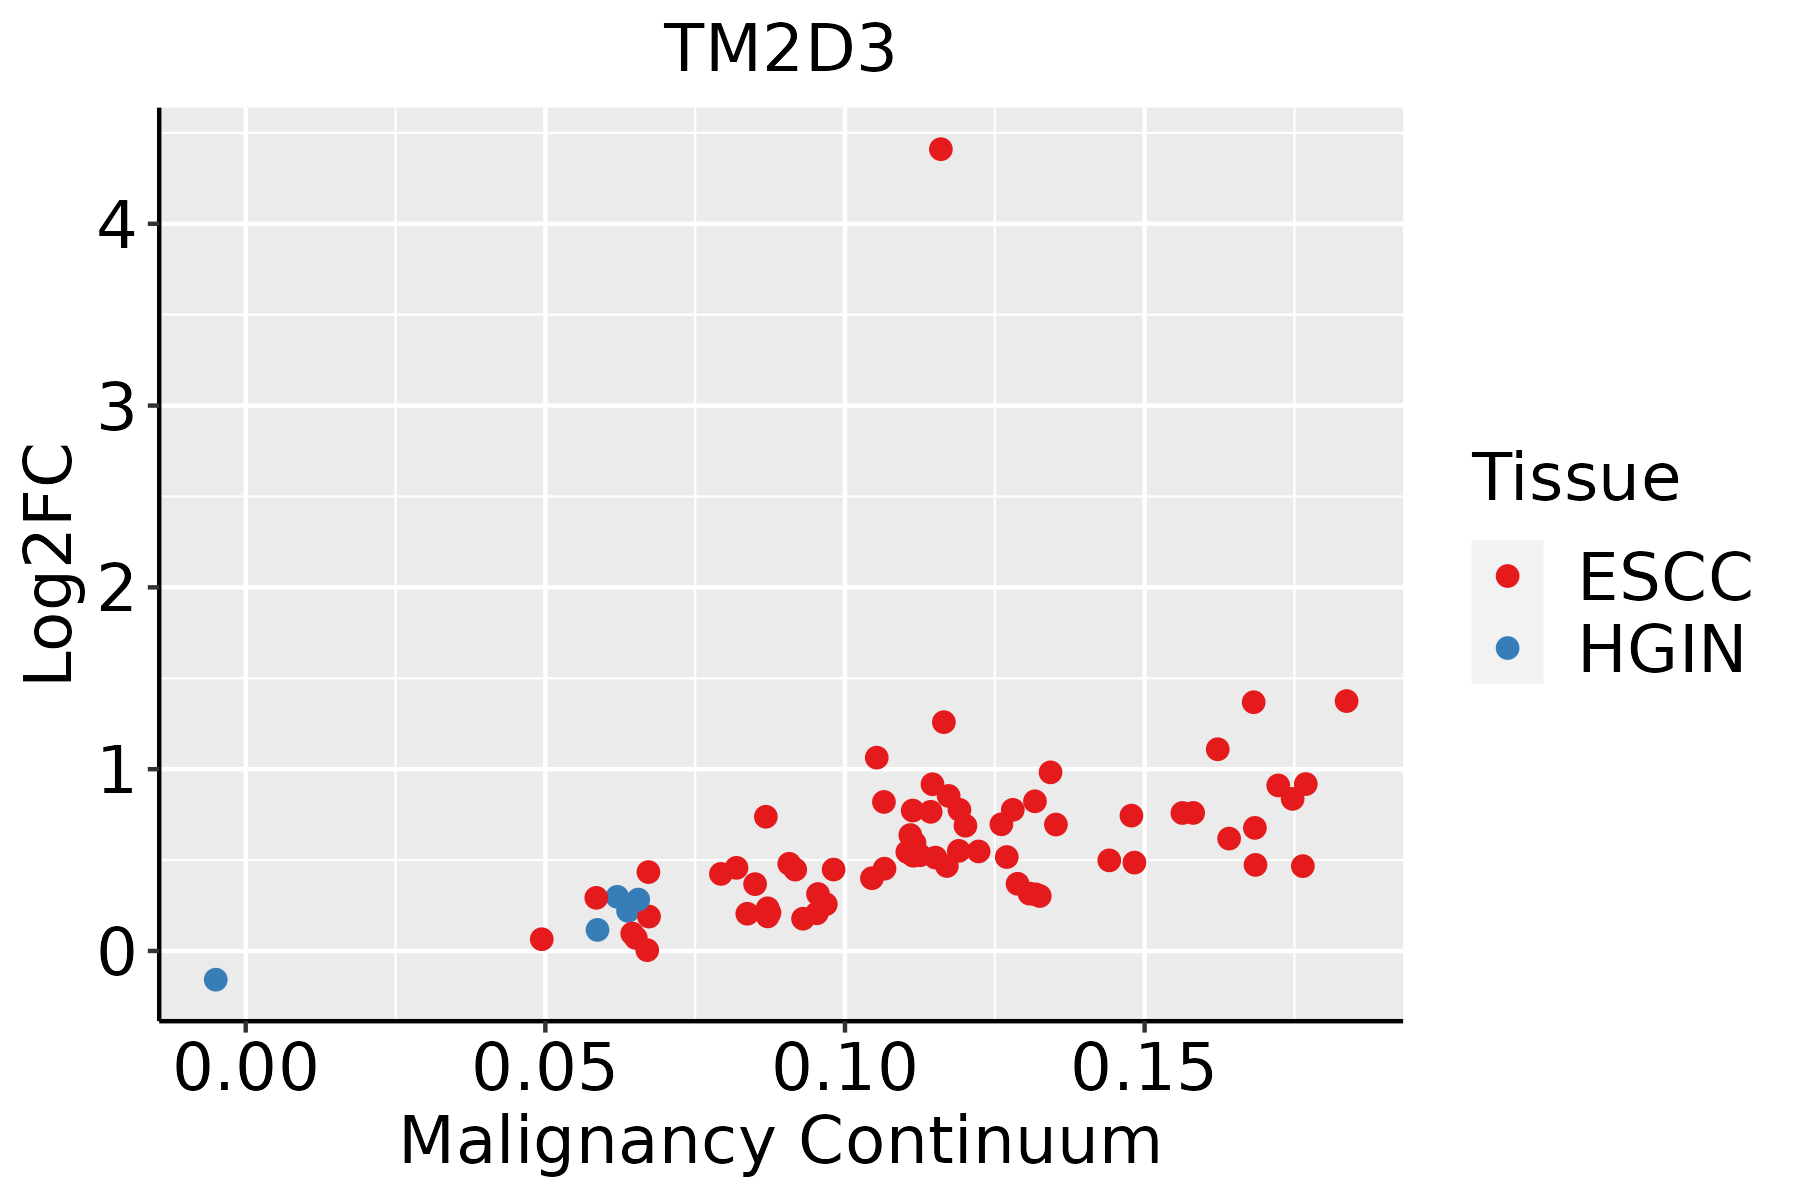 | ESCC: Esophageal squamous cell carcinoma |
| HGIN: High-grade intraepithelial neoplasias | ||
| LGIN: Low-grade intraepithelial neoplasias | ||
| Liver | 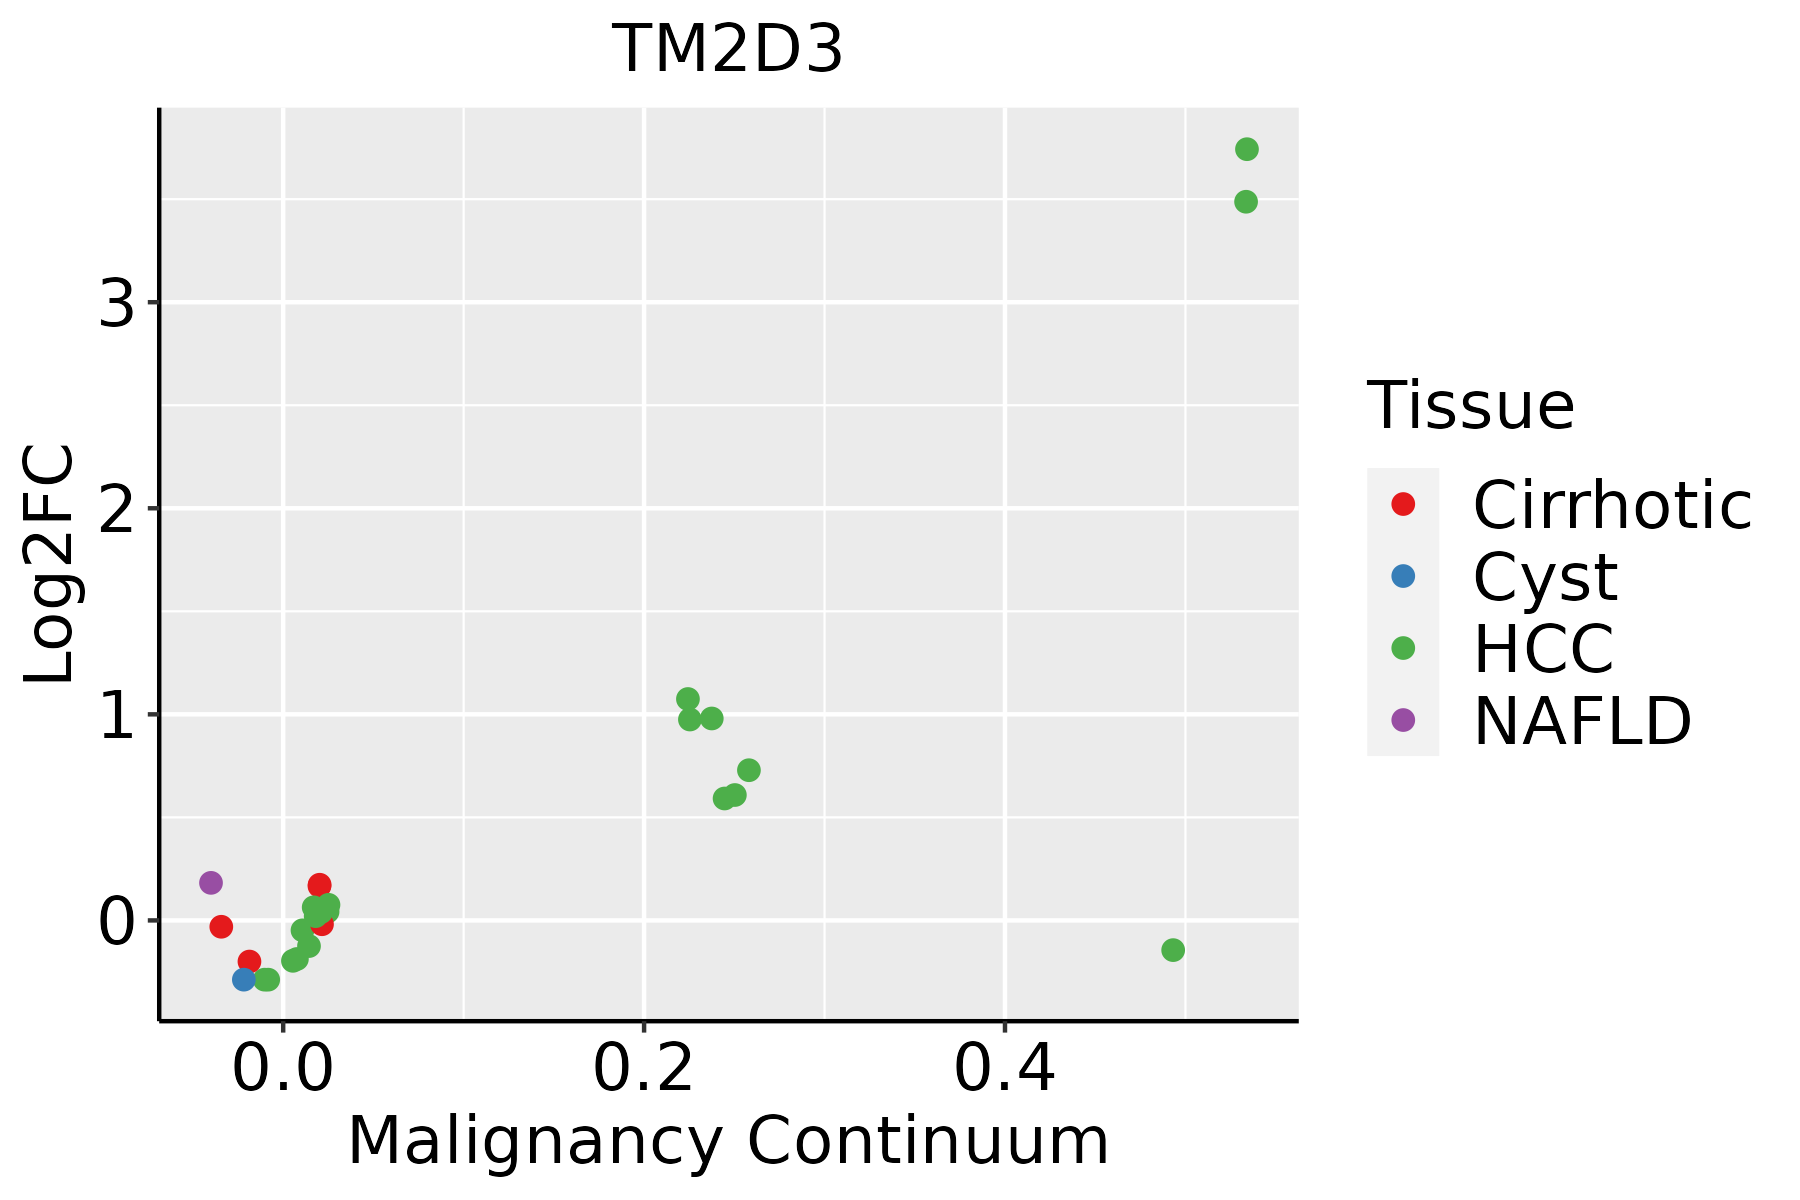 | HCC: Hepatocellular carcinoma |
| NAFLD: Non-alcoholic fatty liver disease | ||
| Oral Cavity | 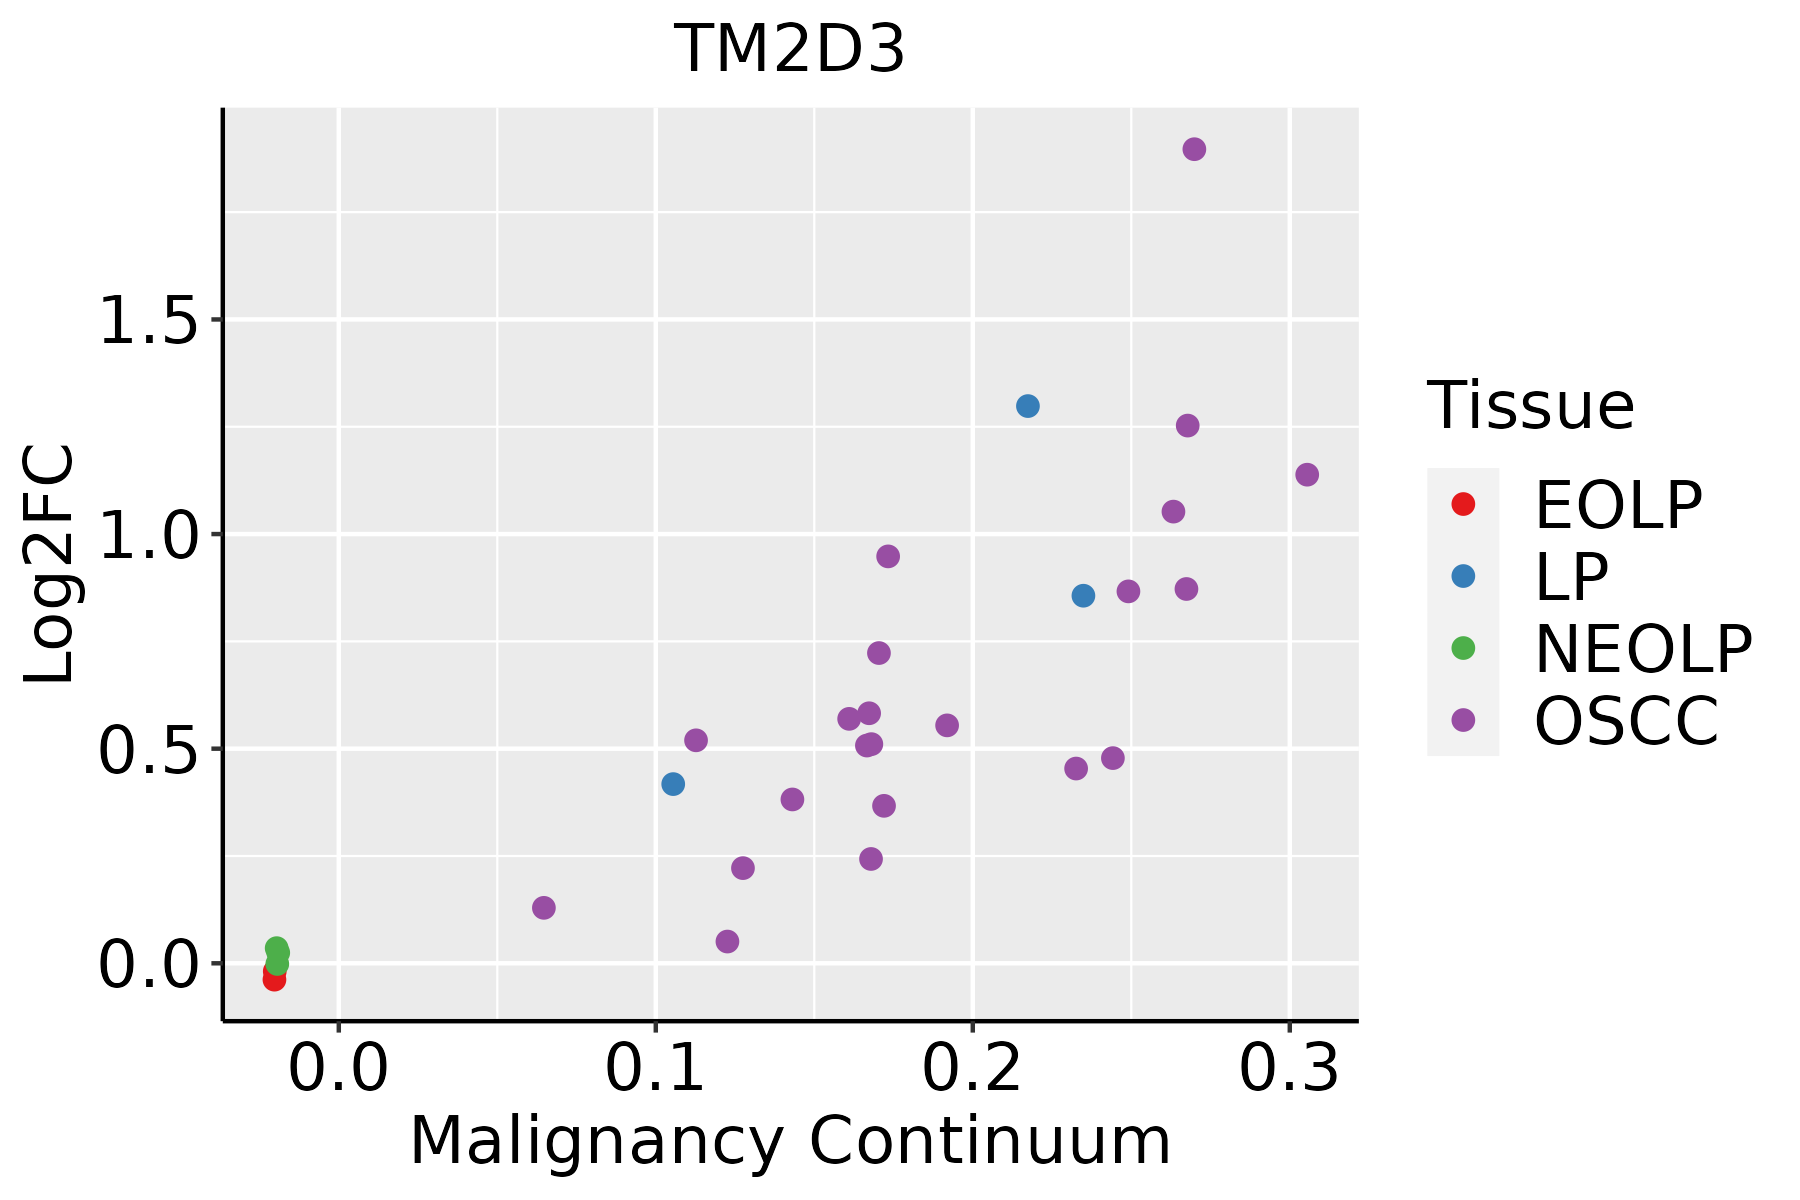 | EOLP: Erosive Oral lichen planus |
| LP: leukoplakia | ||
| NEOLP: Non-erosive oral lichen planus | ||
| OSCC: Oral squamous cell carcinoma | ||
| Skin | 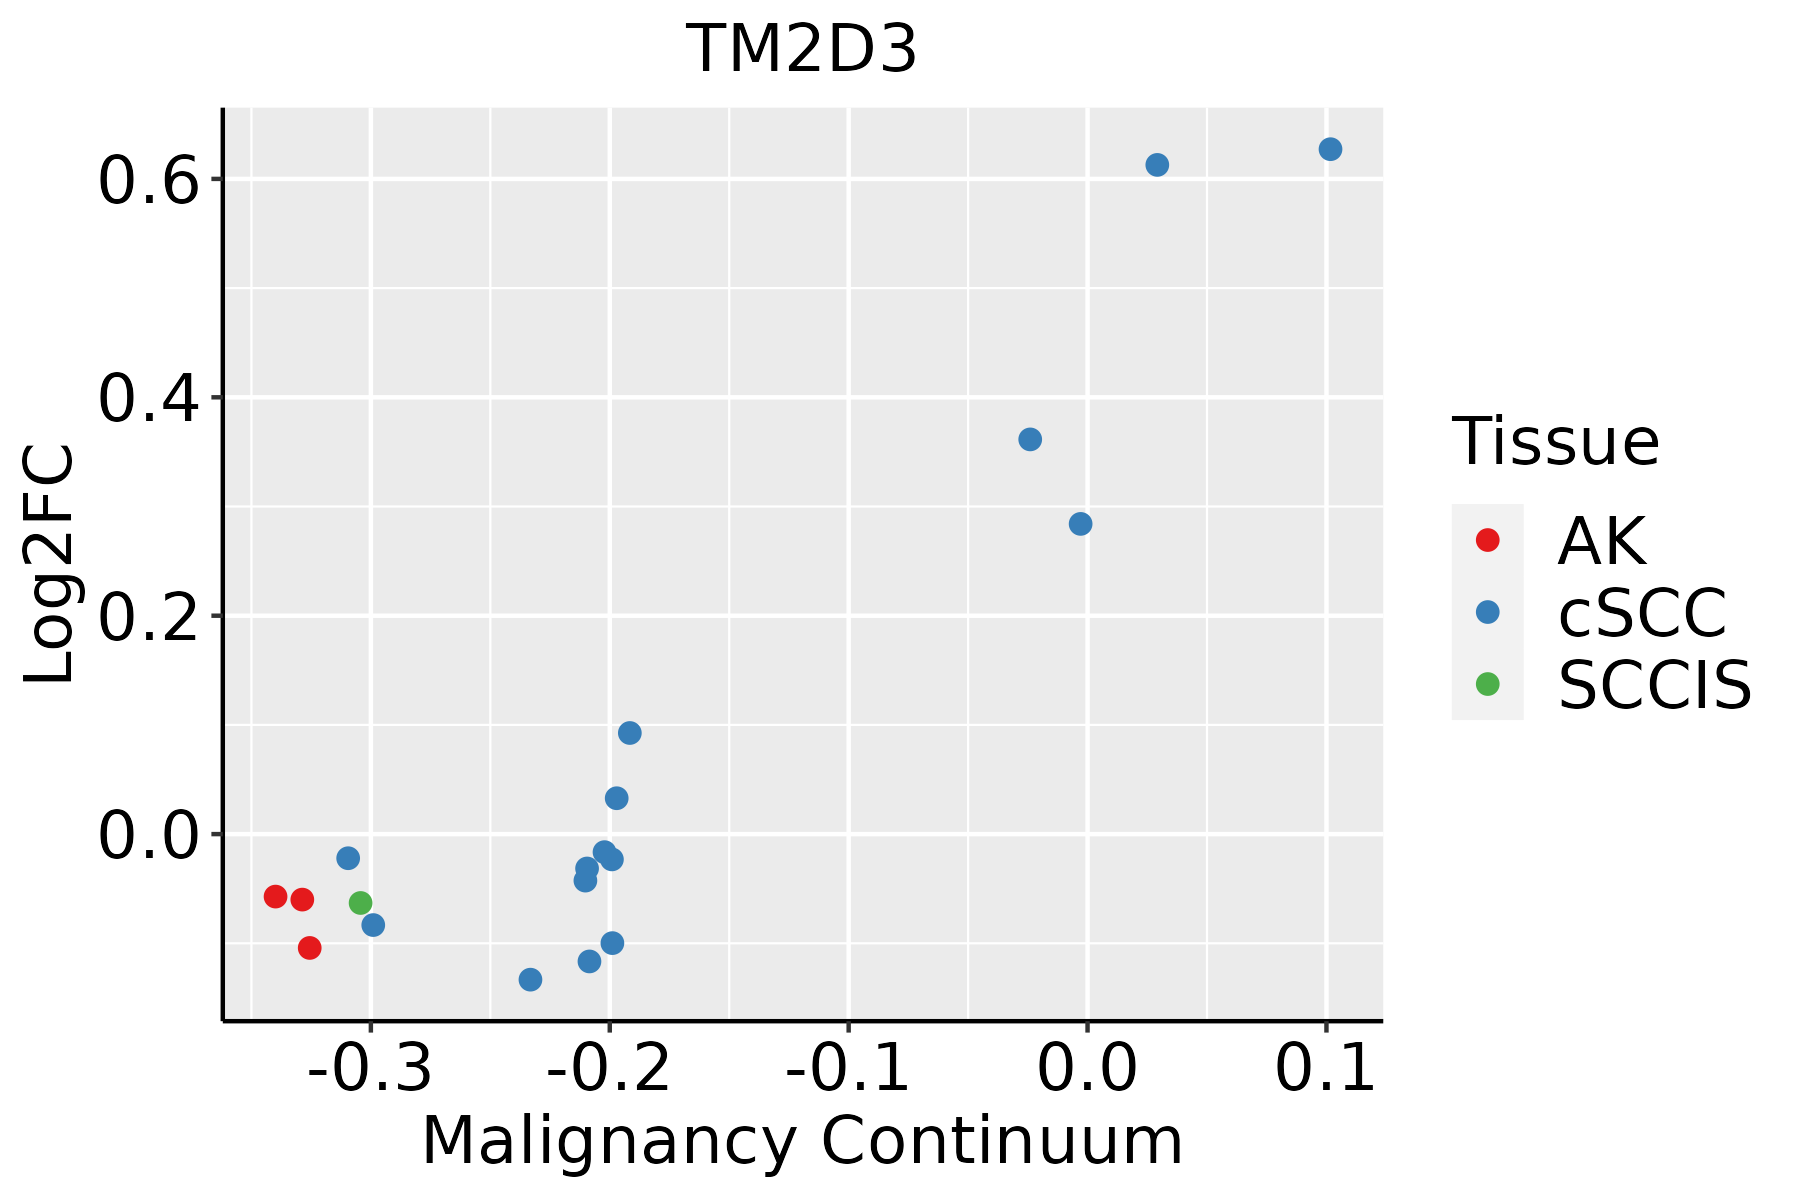 | AK: Actinic keratosis |
| cSCC: Cutaneous squamous cell carcinoma | ||
| SCCIS:squamous cell carcinoma in situ | ||
| Thyroid |  | ATC: Anaplastic thyroid cancer |
| HT: Hashimoto's thyroiditis | ||
| PTC: Papillary thyroid cancer |
| ∗log2FC in expression of this searched gene in stem-like cells from each diseased tissue sample relative to stem-like cells in normal samples in each tissue plotted against the malignancy continuum. Samples are colored based on if they are from different disease stage. |
Top |
Malignant transformation related pathway analysis |
| Find out the enriched GO biological processes and KEGG pathways involved in transition from healthy to precancer to cancer |
| Tissue | Disease Stage | Enriched GO biological Processes |
| Colorectum | AD |  |
| Colorectum | SER |  |
| Colorectum | MSS |  |
| Colorectum | MSI-H |  |
| Colorectum | FAP |  |
| ∗Top 15 enriched GO BP terms are showed in the bar plot of each disease state in each tissue. Each row represents a significant GO biological process which is colored according to the -log10(p.adjust). |
| Page: 1 2 3 4 5 6 7 8 9 |
| GO ID | Tissue | Disease Stage | Description | Gene Ratio | Bg Ratio | pvalue | p.adjust | Count |
| GO:00072197 | Esophagus | ESCC | Notch signaling pathway | 106/8552 | 172/18723 | 1.74e-05 | 1.55e-04 | 106 |
| GO:00085935 | Esophagus | ESCC | regulation of Notch signaling pathway | 59/8552 | 95/18723 | 9.12e-04 | 4.65e-03 | 59 |
| GO:00072196 | Oral cavity | OSCC | Notch signaling pathway | 92/7305 | 172/18723 | 7.84e-05 | 6.08e-04 | 92 |
| GO:00085934 | Oral cavity | OSCC | regulation of Notch signaling pathway | 53/7305 | 95/18723 | 6.64e-04 | 3.72e-03 | 53 |
| GO:000859311 | Oral cavity | LP | regulation of Notch signaling pathway | 35/4623 | 95/18723 | 5.53e-03 | 3.34e-02 | 35 |
| GO:000721913 | Oral cavity | LP | Notch signaling pathway | 57/4623 | 172/18723 | 7.60e-03 | 4.18e-02 | 57 |
| GO:000721922 | Skin | cSCC | Notch signaling pathway | 60/4864 | 172/18723 | 5.82e-03 | 2.87e-02 | 60 |
| GO:00072199 | Thyroid | PTC | Notch signaling pathway | 70/5968 | 172/18723 | 8.82e-03 | 3.67e-02 | 70 |
| GO:000721915 | Thyroid | ATC | Notch signaling pathway | 79/6293 | 172/18723 | 5.08e-04 | 2.96e-03 | 79 |
| GO:00085937 | Thyroid | ATC | regulation of Notch signaling pathway | 43/6293 | 95/18723 | 1.19e-02 | 4.22e-02 | 43 |
| Page: 1 |
| Pathway ID | Tissue | Disease Stage | Description | Gene Ratio | Bg Ratio | pvalue | p.adjust | qvalue | Count |
| Page: 1 |
Top |
Cell-cell communication analysis |
| Identification of potential cell-cell interactions between two cell types and their ligand-receptor pairs for different disease states |
| Ligand | Receptor | LRpair | Pathway | Tissue | Disease Stage |
| Page: 1 |
Top |
Single-cell gene regulatory network inference analysis |
| Find out the significant the regulons (TFs) and the target genes of each regulon across cell types for different disease states |
| TF | Cell Type | Tissue | Disease Stage | Target Gene | RSS | Regulon Activity |
| ∗The dot plots of a searched regulon are shown for all cell subpopulations in each disease state of each tissue based on the regulon specific score inferred using pySCENIC and by calculating the average expression. |
| Page: 1 |
Top |
Somatic mutation of malignant transformation related genes |
| Annotation of somatic variants for genes involved in malignant transformation |
| Hugo Symbol | Variant Class | Variant Classification | dbSNP RS | HGVSc | HGVSp | HGVSp Short | SWISSPROT | BIOTYPE | SIFT | PolyPhen | Tumor Sample Barcode | Tissue | Histology | Sex | Age | Stage | Therapy Types | Drugs | Outcome |
| TM2D3 | SNV | Missense_Mutation | rs777678911 | c.727G>T | p.Gly243Cys | p.G243C | Q9BRN9 | protein_coding | deleterious(0) | probably_damaging(1) | TCGA-BH-A0HA-01 | Breast | breast invasive carcinoma | Female | <65 | I/II | Unknown | Unknown | SD |
| TM2D3 | SNV | Missense_Mutation | c.238N>C | p.Asp80His | p.D80H | Q9BRN9 | protein_coding | deleterious(0) | possibly_damaging(0.838) | TCGA-C8-A26V-01 | Breast | breast invasive carcinoma | Female | <65 | III/IV | Hormone Therapy | tamoxiphen | CR | |
| TM2D3 | SNV | Missense_Mutation | c.334G>C | p.Asp112His | p.D112H | Q9BRN9 | protein_coding | deleterious(0.04) | benign(0.372) | TCGA-C5-A1BL-01 | Cervix | cervical & endocervical cancer | Female | <65 | I/II | Unknown | Unknown | SD | |
| TM2D3 | SNV | Missense_Mutation | c.112C>G | p.Gln38Glu | p.Q38E | Q9BRN9 | protein_coding | tolerated(0.81) | benign(0.073) | TCGA-F5-6813-01 | Colorectum | rectum adenocarcinoma | Male | >=65 | III/IV | Unknown | Unknown | PD | |
| TM2D3 | SNV | Missense_Mutation | rs754640606 | c.677C>T | p.Thr226Met | p.T226M | Q9BRN9 | protein_coding | deleterious(0) | probably_damaging(1) | TCGA-AP-A0LM-01 | Endometrium | uterine corpus endometrioid carcinoma | Female | <65 | III/IV | Chemotherapy | cisplatin | SD |
| TM2D3 | SNV | Missense_Mutation | rs144526936 | c.476C>T | p.Thr159Met | p.T159M | Q9BRN9 | protein_coding | deleterious(0) | possibly_damaging(0.871) | TCGA-AP-A0LM-01 | Endometrium | uterine corpus endometrioid carcinoma | Female | <65 | III/IV | Chemotherapy | cisplatin | SD |
| TM2D3 | SNV | Missense_Mutation | rs764913906 | c.481N>T | p.Arg161Trp | p.R161W | Q9BRN9 | protein_coding | deleterious(0.01) | possibly_damaging(0.794) | TCGA-AP-A1DV-01 | Endometrium | uterine corpus endometrioid carcinoma | Female | <65 | I/II | Unknown | Unknown | SD |
| TM2D3 | SNV | Missense_Mutation | novel | c.523N>G | p.Met175Val | p.M175V | Q9BRN9 | protein_coding | tolerated(0.12) | benign(0.034) | TCGA-AX-A0IZ-01 | Endometrium | uterine corpus endometrioid carcinoma | Female | <65 | I/II | Unknown | Unknown | SD |
| TM2D3 | SNV | Missense_Mutation | rs749825529 | c.482G>A | p.Arg161Gln | p.R161Q | Q9BRN9 | protein_coding | tolerated(0.24) | benign(0.361) | TCGA-BG-A0MQ-01 | Endometrium | uterine corpus endometrioid carcinoma | Female | >=65 | I/II | Unknown | Unknown | SD |
| TM2D3 | SNV | Missense_Mutation | novel | c.293T>C | p.Phe98Ser | p.F98S | Q9BRN9 | protein_coding | deleterious(0.04) | probably_damaging(0.913) | TCGA-DF-A2KU-01 | Endometrium | uterine corpus endometrioid carcinoma | Female | Unknown | I/II | Unknown | Unknown | SD |
| Page: 1 2 |
Top |
Related drugs of malignant transformation related genes |
| Identification of chemicals and drugs interact with genes involved in malignant transfromation |
| (DGIdb 4.0) |
| Entrez ID | Symbol | Category | Interaction Types | Drug Claim Name | Drug Name | PMIDs |
| Page: 1 |

Copyright 2023-Present -The University of Texas Health Science Center at Houston |