
|
|||||
|
 | |
| |
| |
| |
| |
| |
|
Gene: TLR7 |
Gene summary for TLR7 |
| Gene information | Species | Human | Gene symbol | TLR7 | Gene ID | 51284 |
| Gene name | toll like receptor 7 | |
| Gene Alias | IMD74 | |
| Cytomap | Xp22.2 | |
| Gene Type | protein-coding | GO ID | GO:0000165 | UniProtAcc | B2R9N9 |
Top |
Malignant transformation analysis |
| Identification of the aberrant gene expression in precancerous and cancerous lesions by comparing the gene expression of stem-like cells in diseased tissues with normal stem cells |
| Entrez ID | Symbol | Replicates | Species | Organ | Tissue | Adj P-value | Log2FC | Malignancy |
| 51284 | TLR7 | HCC1 | Human | Liver | HCC | 1.39e-09 | 1.42e+00 | 0.5336 |
| 51284 | TLR7 | HCC2 | Human | Liver | HCC | 7.72e-17 | 1.40e+00 | 0.5341 |
| 51284 | TLR7 | HCC5 | Human | Liver | HCC | 1.31e-08 | 1.01e+00 | 0.4932 |
| Page: 1 |
| Tissue | Expression Dynamics | Abbreviation |
| Liver | 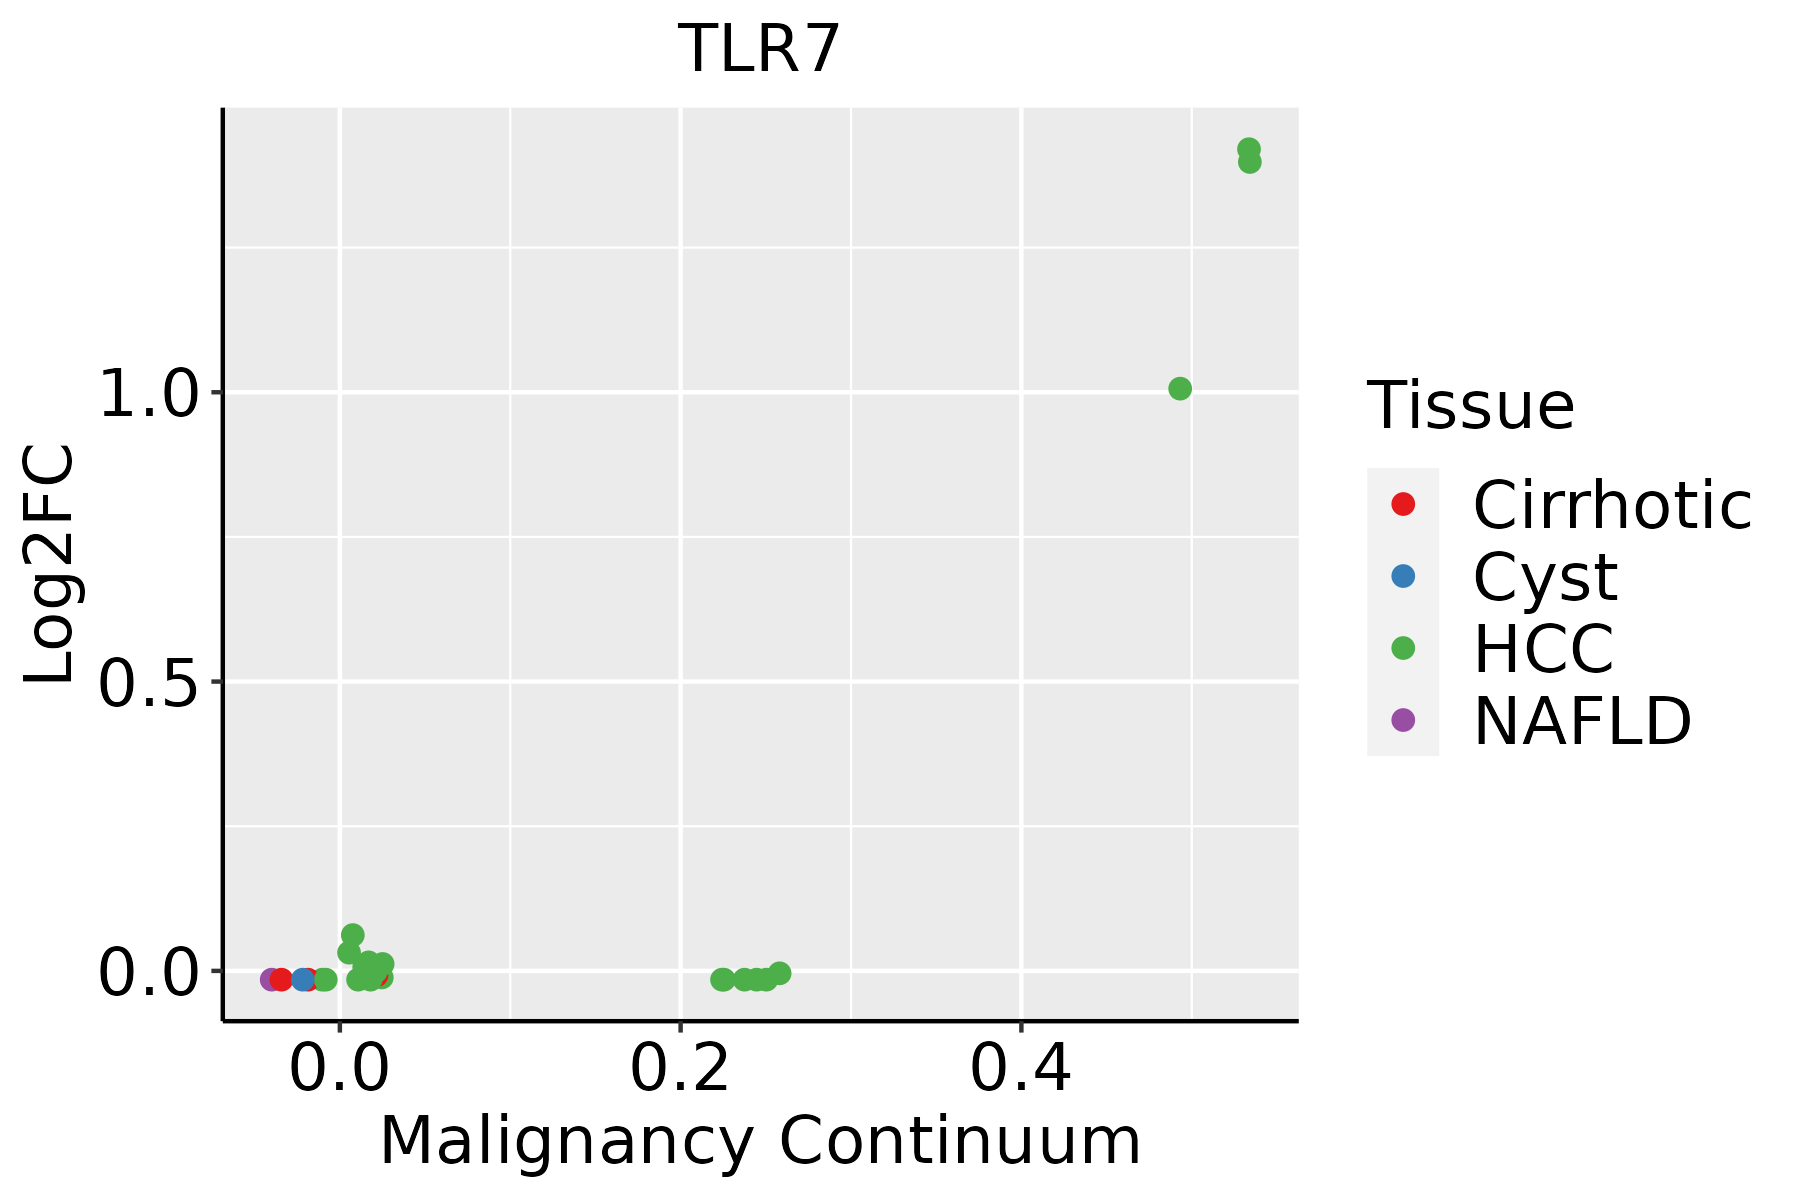 | HCC: Hepatocellular carcinoma |
| NAFLD: Non-alcoholic fatty liver disease |
| ∗log2FC in expression of this searched gene in stem-like cells from each diseased tissue sample relative to stem-like cells in normal samples in each tissue plotted against the malignancy continuum. Samples are colored based on if they are from different disease stage. |
Top |
Malignant transformation related pathway analysis |
| Find out the enriched GO biological processes and KEGG pathways involved in transition from healthy to precancer to cancer |
| Tissue | Disease Stage | Enriched GO biological Processes |
| Colorectum | AD |  |
| Colorectum | SER |  |
| Colorectum | MSS |  |
| Colorectum | MSI-H |  |
| Colorectum | FAP |  |
| ∗Top 15 enriched GO BP terms are showed in the bar plot of each disease state in each tissue. Each row represents a significant GO biological process which is colored according to the -log10(p.adjust). |
| Page: 1 2 3 4 5 6 7 8 9 |
| GO ID | Tissue | Disease Stage | Description | Gene Ratio | Bg Ratio | pvalue | p.adjust | Count |
| GO:007149622 | Liver | HCC | cellular response to external stimulus | 191/7958 | 320/18723 | 3.40e-10 | 1.13e-08 | 191 |
| GO:000961511 | Liver | HCC | response to virus | 210/7958 | 367/18723 | 7.32e-09 | 1.86e-07 | 210 |
| GO:00022211 | Liver | HCC | pattern recognition receptor signaling pathway | 107/7958 | 172/18723 | 1.37e-07 | 2.58e-06 | 107 |
| GO:00516071 | Liver | HCC | defense response to virus | 151/7958 | 265/18723 | 1.27e-06 | 1.85e-05 | 151 |
| GO:01405461 | Liver | HCC | defense response to symbiont | 151/7958 | 265/18723 | 1.27e-06 | 1.85e-05 | 151 |
| GO:007121421 | Liver | HCC | cellular response to abiotic stimulus | 183/7958 | 331/18723 | 1.59e-06 | 2.26e-05 | 183 |
| GO:010400421 | Liver | HCC | cellular response to environmental stimulus | 183/7958 | 331/18723 | 1.59e-06 | 2.26e-05 | 183 |
| GO:00985861 | Liver | HCC | cellular response to virus | 57/7958 | 84/18723 | 2.30e-06 | 3.11e-05 | 57 |
| GO:000724912 | Liver | HCC | I-kappaB kinase/NF-kappaB signaling | 156/7958 | 281/18723 | 6.66e-06 | 8.00e-05 | 156 |
| GO:00324814 | Liver | HCC | positive regulation of type I interferon production | 41/7958 | 58/18723 | 1.29e-05 | 1.44e-04 | 41 |
| GO:003109822 | Liver | HCC | stress-activated protein kinase signaling cascade | 138/7958 | 247/18723 | 1.43e-05 | 1.57e-04 | 138 |
| GO:005140322 | Liver | HCC | stress-activated MAPK cascade | 134/7958 | 239/18723 | 1.50e-05 | 1.64e-04 | 134 |
| GO:0032479 | Liver | HCC | regulation of type I interferon production | 60/7958 | 95/18723 | 3.84e-05 | 3.80e-04 | 60 |
| GO:0032606 | Liver | HCC | type I interferon production | 60/7958 | 95/18723 | 3.84e-05 | 3.80e-04 | 60 |
| GO:00712601 | Liver | HCC | cellular response to mechanical stimulus | 48/7958 | 81/18723 | 1.72e-03 | 8.96e-03 | 48 |
| GO:0032728 | Liver | HCC | positive regulation of interferon-beta production | 26/7958 | 39/18723 | 1.99e-03 | 1.01e-02 | 26 |
| GO:00096124 | Liver | HCC | response to mechanical stimulus | 113/7958 | 216/18723 | 2.20e-03 | 1.10e-02 | 113 |
| GO:0002224 | Liver | HCC | toll-like receptor signaling pathway | 67/7958 | 121/18723 | 2.87e-03 | 1.34e-02 | 67 |
| GO:000725412 | Liver | HCC | JNK cascade | 89/7958 | 167/18723 | 3.09e-03 | 1.44e-02 | 89 |
| GO:19012242 | Liver | HCC | positive regulation of NIK/NF-kappaB signaling | 41/7958 | 69/18723 | 3.38e-03 | 1.54e-02 | 41 |
| Page: 1 2 |
| Pathway ID | Tissue | Disease Stage | Description | Gene Ratio | Bg Ratio | pvalue | p.adjust | qvalue | Count |
| hsa0517142 | Liver | HCC | Coronavirus disease - COVID-19 | 167/4020 | 232/8465 | 1.50e-14 | 4.19e-13 | 2.33e-13 | 167 |
| hsa0516421 | Liver | HCC | Influenza A | 101/4020 | 171/8465 | 1.41e-03 | 5.07e-03 | 2.82e-03 | 101 |
| hsa0517152 | Liver | HCC | Coronavirus disease - COVID-19 | 167/4020 | 232/8465 | 1.50e-14 | 4.19e-13 | 2.33e-13 | 167 |
| hsa0516431 | Liver | HCC | Influenza A | 101/4020 | 171/8465 | 1.41e-03 | 5.07e-03 | 2.82e-03 | 101 |
| Page: 1 |
Top |
Cell-cell communication analysis |
| Identification of potential cell-cell interactions between two cell types and their ligand-receptor pairs for different disease states |
| Ligand | Receptor | LRpair | Pathway | Tissue | Disease Stage |
| Page: 1 |
Top |
Single-cell gene regulatory network inference analysis |
| Find out the significant the regulons (TFs) and the target genes of each regulon across cell types for different disease states |
| TF | Cell Type | Tissue | Disease Stage | Target Gene | RSS | Regulon Activity |
| ∗The dot plots of a searched regulon are shown for all cell subpopulations in each disease state of each tissue based on the regulon specific score inferred using pySCENIC and by calculating the average expression. |
| Page: 1 |
Top |
Somatic mutation of malignant transformation related genes |
| Annotation of somatic variants for genes involved in malignant transformation |
| Hugo Symbol | Variant Class | Variant Classification | dbSNP RS | HGVSc | HGVSp | HGVSp Short | SWISSPROT | BIOTYPE | SIFT | PolyPhen | Tumor Sample Barcode | Tissue | Histology | Sex | Age | Stage | Therapy Types | Drugs | Outcome |
| TLR7 | SNV | Missense_Mutation | c.644N>G | p.Asn215Ser | p.N215S | Q9NYK1 | protein_coding | tolerated(0.06) | possibly_damaging(0.54) | TCGA-A2-A0ES-01 | Breast | breast invasive carcinoma | Female | <65 | I/II | Chemotherapy | docetaxel | SD | |
| TLR7 | SNV | Missense_Mutation | c.708N>A | p.Met236Ile | p.M236I | Q9NYK1 | protein_coding | tolerated(0.3) | benign(0) | TCGA-A8-A09Q-01 | Breast | breast invasive carcinoma | Female | >=65 | III/IV | Hormone Therapy | anastrozole | SD | |
| TLR7 | SNV | Missense_Mutation | c.457N>T | p.Leu153Phe | p.L153F | Q9NYK1 | protein_coding | deleterious(0.01) | possibly_damaging(0.803) | TCGA-AC-A23H-01 | Breast | breast invasive carcinoma | Female | >=65 | I/II | Unknown | Unknown | PD | |
| TLR7 | SNV | Missense_Mutation | novel | c.2464N>A | p.Gly822Ser | p.G822S | Q9NYK1 | protein_coding | deleterious(0.01) | possibly_damaging(0.882) | TCGA-AC-A7VB-01 | Breast | breast invasive carcinoma | Female | <65 | I/II | Unknown | Unknown | SD |
| TLR7 | SNV | Missense_Mutation | c.1210C>T | p.Leu404Phe | p.L404F | Q9NYK1 | protein_coding | tolerated(0.08) | benign(0.157) | TCGA-AN-A046-01 | Breast | breast invasive carcinoma | Female | >=65 | I/II | Unknown | Unknown | SD | |
| TLR7 | SNV | Missense_Mutation | c.208C>T | p.Leu70Phe | p.L70F | Q9NYK1 | protein_coding | deleterious(0) | benign(0.172) | TCGA-BH-A0E1-01 | Breast | breast invasive carcinoma | Female | <65 | I/II | Chemotherapy | cytoxan | SD | |
| TLR7 | SNV | Missense_Mutation | c.1801N>G | p.Leu601Val | p.L601V | Q9NYK1 | protein_coding | deleterious(0) | probably_damaging(0.999) | TCGA-BH-A0EE-01 | Breast | breast invasive carcinoma | Female | >=65 | I/II | Chemotherapy | docetaxel | SD | |
| TLR7 | SNV | Missense_Mutation | rs750881108 | c.2015N>A | p.Gly672Asp | p.G672D | Q9NYK1 | protein_coding | tolerated(0.25) | benign(0.371) | TCGA-BH-A0HX-01 | Breast | breast invasive carcinoma | Female | <65 | I/II | Chemotherapy | adrimycin | SD |
| TLR7 | SNV | Missense_Mutation | rs757257297 | c.664G>C | p.Val222Leu | p.V222L | Q9NYK1 | protein_coding | tolerated(0.29) | benign(0) | TCGA-BH-A6R8-01 | Breast | breast invasive carcinoma | Female | <65 | I/II | Unknown | Unknown | SD |
| TLR7 | SNV | Missense_Mutation | c.2402C>T | p.Thr801Met | p.T801M | Q9NYK1 | protein_coding | deleterious(0) | possibly_damaging(0.781) | TCGA-D8-A1Y1-01 | Breast | breast invasive carcinoma | Female | >=65 | III/IV | Hormone Therapy | tamoxiphen | PD |
| Page: 1 2 3 4 5 6 7 8 9 10 11 12 13 14 15 |
Top |
Related drugs of malignant transformation related genes |
| Identification of chemicals and drugs interact with genes involved in malignant transfromation |
| (DGIdb 4.0) |
| Entrez ID | Symbol | Category | Interaction Types | Drug Claim Name | Drug Name | PMIDs |
| 51284 | TLR7 | DRUGGABLE GENOME | agonist | CHEMBL1282 | IMIQUIMOD | |
| 51284 | TLR7 | DRUGGABLE GENOME | MEDI9197 | TELRATOLIMOD | ||
| 51284 | TLR7 | DRUGGABLE GENOME | ANA773 | |||
| 51284 | TLR7 | DRUGGABLE GENOME | Isatoribine | ISATORIBINE | ||
| 51284 | TLR7 | DRUGGABLE GENOME | antagonist | 178103773 | HYDROXYCHLOROQUINE | |
| 51284 | TLR7 | DRUGGABLE GENOME | agonist | 178101715 | LOXORIBINE | |
| 51284 | TLR7 | DRUGGABLE GENOME | DSP-0509 | |||
| 51284 | TLR7 | DRUGGABLE GENOME | IMIQUIMOD | IMIQUIMOD | ||
| 51284 | TLR7 | DRUGGABLE GENOME | DV1179 | |||
| 51284 | TLR7 | DRUGGABLE GENOME | 852 |
| Page: 1 2 3 4 |

Copyright 2023-Present -The University of Texas Health Science Center at Houston |