
|
|||||
|
 | |
| |
| |
| |
| |
| |
|
Gene: TLR10 |
Gene summary for TLR10 |
| Gene information | Species | Human | Gene symbol | TLR10 | Gene ID | 81793 |
| Gene name | toll like receptor 10 | |
| Gene Alias | CD290 | |
| Cytomap | 4p14 | |
| Gene Type | protein-coding | GO ID | GO:0001816 | UniProtAcc | A0A024R9W4 |
Top |
Malignant transformation analysis |
| Identification of the aberrant gene expression in precancerous and cancerous lesions by comparing the gene expression of stem-like cells in diseased tissues with normal stem cells |
| Entrez ID | Symbol | Replicates | Species | Organ | Tissue | Adj P-value | Log2FC | Malignancy |
| 81793 | TLR10 | HCC1 | Human | Liver | HCC | 2.54e-07 | 7.48e-01 | 0.5336 |
| 81793 | TLR10 | HCC2 | Human | Liver | HCC | 2.17e-19 | 1.37e+00 | 0.5341 |
| 81793 | TLR10 | HCC5 | Human | Liver | HCC | 6.74e-23 | 1.22e+00 | 0.4932 |
| Page: 1 |
| Tissue | Expression Dynamics | Abbreviation |
| Liver | 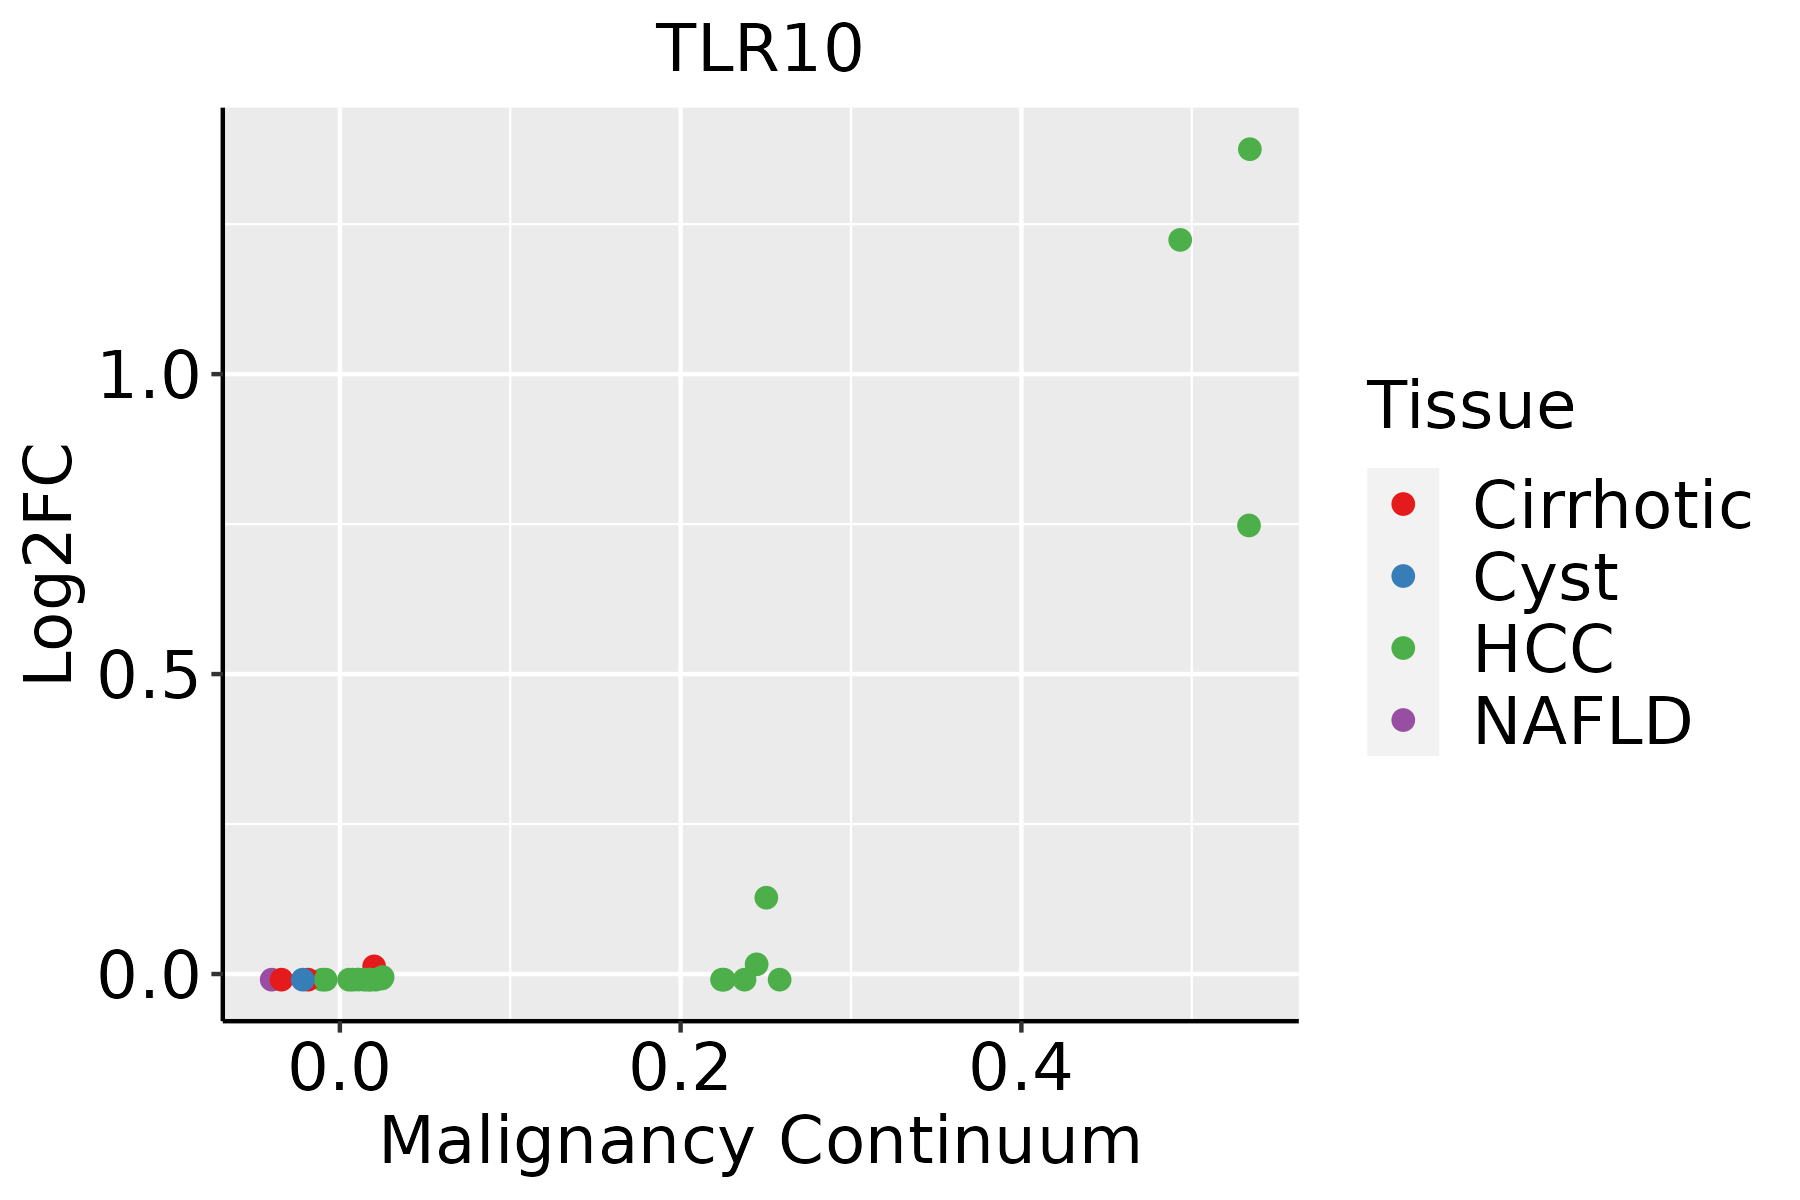 | HCC: Hepatocellular carcinoma |
| NAFLD: Non-alcoholic fatty liver disease |
| ∗log2FC in expression of this searched gene in stem-like cells from each diseased tissue sample relative to stem-like cells in normal samples in each tissue plotted against the malignancy continuum. Samples are colored based on if they are from different disease stage. |
Top |
Malignant transformation related pathway analysis |
| Find out the enriched GO biological processes and KEGG pathways involved in transition from healthy to precancer to cancer |
| Tissue | Disease Stage | Enriched GO biological Processes |
| Colorectum | AD |  |
| Colorectum | SER |  |
| Colorectum | MSS |  |
| Colorectum | MSI-H |  |
| Colorectum | FAP |  |
| ∗Top 15 enriched GO BP terms are showed in the bar plot of each disease state in each tissue. Each row represents a significant GO biological process which is colored according to the -log10(p.adjust). |
| Page: 1 2 3 4 5 6 7 8 9 |
| GO ID | Tissue | Disease Stage | Description | Gene Ratio | Bg Ratio | pvalue | p.adjust | Count |
| GO:00022211 | Liver | HCC | pattern recognition receptor signaling pathway | 107/7958 | 172/18723 | 1.37e-07 | 2.58e-06 | 107 |
| GO:0002224 | Liver | HCC | toll-like receptor signaling pathway | 67/7958 | 121/18723 | 2.87e-03 | 1.34e-02 | 67 |
| Page: 1 |
| Pathway ID | Tissue | Disease Stage | Description | Gene Ratio | Bg Ratio | pvalue | p.adjust | qvalue | Count |
| Page: 1 |
Top |
Cell-cell communication analysis |
| Identification of potential cell-cell interactions between two cell types and their ligand-receptor pairs for different disease states |
| Ligand | Receptor | LRpair | Pathway | Tissue | Disease Stage |
| Page: 1 |
Top |
Single-cell gene regulatory network inference analysis |
| Find out the significant the regulons (TFs) and the target genes of each regulon across cell types for different disease states |
| TF | Cell Type | Tissue | Disease Stage | Target Gene | RSS | Regulon Activity |
| ∗The dot plots of a searched regulon are shown for all cell subpopulations in each disease state of each tissue based on the regulon specific score inferred using pySCENIC and by calculating the average expression. |
| Page: 1 |
Top |
Somatic mutation of malignant transformation related genes |
| Annotation of somatic variants for genes involved in malignant transformation |
| Hugo Symbol | Variant Class | Variant Classification | dbSNP RS | HGVSc | HGVSp | HGVSp Short | SWISSPROT | BIOTYPE | SIFT | PolyPhen | Tumor Sample Barcode | Tissue | Histology | Sex | Age | Stage | Therapy Types | Drugs | Outcome |
| TLR10 | SNV | Missense_Mutation | novel | c.79N>A | p.Glu27Lys | p.E27K | Q9BXR5 | protein_coding | tolerated(0.06) | benign(0.141) | TCGA-5L-AAT1-01 | Breast | breast invasive carcinoma | Female | <65 | III/IV | Hormone Therapy | letrozol | SD |
| TLR10 | SNV | Missense_Mutation | rs748903569 | c.541N>A | p.Glu181Lys | p.E181K | Q9BXR5 | protein_coding | tolerated(0.1) | possibly_damaging(0.465) | TCGA-AC-A23H-01 | Breast | breast invasive carcinoma | Female | >=65 | I/II | Unknown | Unknown | PD |
| TLR10 | SNV | Missense_Mutation | novel | c.1633G>A | p.Val545Ile | p.V545I | Q9BXR5 | protein_coding | tolerated(0.39) | benign(0.001) | TCGA-AR-A0U0-01 | Breast | breast invasive carcinoma | Female | >=65 | I/II | Unknown | Unknown | SD |
| TLR10 | SNV | Missense_Mutation | novel | c.350N>T | p.Ala117Val | p.A117V | Q9BXR5 | protein_coding | tolerated(1) | benign(0.006) | TCGA-BH-A0B8-01 | Breast | breast invasive carcinoma | Female | <65 | I/II | Hormone Therapy | arimidex | SD |
| TLR10 | SNV | Missense_Mutation | novel | c.2047N>A | p.Val683Ile | p.V683I | Q9BXR5 | protein_coding | tolerated(1) | benign(0) | TCGA-E9-A5UP-01 | Breast | breast invasive carcinoma | Female | <65 | I/II | Hormone Therapy | tamoxiphen | SD |
| TLR10 | insertion | Nonsense_Mutation | novel | c.1631_1632insCTTCCTTCTCTA | p.Met544delinsIlePheLeuLeuTer | p.M544delinsIFLL* | Q9BXR5 | protein_coding | TCGA-AR-A0U0-01 | Breast | breast invasive carcinoma | Female | >=65 | I/II | Unknown | Unknown | SD | ||
| TLR10 | SNV | Missense_Mutation | c.1222N>A | p.Leu408Ile | p.L408I | Q9BXR5 | protein_coding | tolerated(0.24) | possibly_damaging(0.603) | TCGA-FU-A3HZ-01 | Cervix | cervical & endocervical cancer | Female | <65 | I/II | Chemotherapy | cisplatin | CR | |
| TLR10 | SNV | Missense_Mutation | c.1629N>C | p.Met543Ile | p.M543I | Q9BXR5 | protein_coding | tolerated(0.24) | benign(0.028) | TCGA-JW-A5VL-01 | Cervix | cervical & endocervical cancer | Female | <65 | I/II | Unknown | Unknown | SD | |
| TLR10 | SNV | Missense_Mutation | novel | c.979N>A | p.Asp327Asn | p.D327N | Q9BXR5 | protein_coding | tolerated(1) | benign(0.001) | TCGA-JW-A5VL-01 | Cervix | cervical & endocervical cancer | Female | <65 | I/II | Unknown | Unknown | SD |
| TLR10 | SNV | Missense_Mutation | novel | c.1240N>A | p.Asp414Asn | p.D414N | Q9BXR5 | protein_coding | tolerated(0.16) | benign(0.001) | TCGA-ZJ-AAXU-01 | Cervix | cervical & endocervical cancer | Female | <65 | I/II | Unknown | Unknown | SD |
| Page: 1 2 3 4 5 6 7 8 9 10 11 |
Top |
Related drugs of malignant transformation related genes |
| Identification of chemicals and drugs interact with genes involved in malignant transfromation |
| (DGIdb 4.0) |
| Entrez ID | Symbol | Category | Interaction Types | Drug Claim Name | Drug Name | PMIDs |
| Page: 1 |

Copyright 2023-Present -The University of Texas Health Science Center at Houston |