
|
|||||
|
 | |
| |
| |
| |
| |
| |
|
Gene: TLN2 |
Gene summary for TLN2 |
| Gene information | Species | Human | Gene symbol | TLN2 | Gene ID | 83660 |
| Gene name | talin 2 | |
| Gene Alias | ILWEQ | |
| Cytomap | 15q22.2 | |
| Gene Type | protein-coding | GO ID | GO:0006996 | UniProtAcc | Q9Y4G6 |
Top |
Malignant transformation analysis |
| Identification of the aberrant gene expression in precancerous and cancerous lesions by comparing the gene expression of stem-like cells in diseased tissues with normal stem cells |
| Entrez ID | Symbol | Replicates | Species | Organ | Tissue | Adj P-value | Log2FC | Malignancy |
| 83660 | TLN2 | HTA11_3410_2000001011 | Human | Colorectum | AD | 1.60e-22 | -6.43e-01 | 0.0155 |
| 83660 | TLN2 | HTA11_347_2000001011 | Human | Colorectum | AD | 2.13e-09 | 6.41e-01 | -0.1954 |
| 83660 | TLN2 | HTA11_696_2000001011 | Human | Colorectum | AD | 5.19e-03 | -3.13e-01 | -0.1464 |
| 83660 | TLN2 | HTA11_866_3004761011 | Human | Colorectum | AD | 1.34e-16 | -7.11e-01 | 0.096 |
| 83660 | TLN2 | HTA11_9408_2000001011 | Human | Colorectum | AD | 3.06e-04 | -8.71e-01 | 0.0451 |
| 83660 | TLN2 | HTA11_8622_2000001021 | Human | Colorectum | SER | 2.82e-07 | -6.66e-01 | 0.0528 |
| 83660 | TLN2 | HTA11_7696_3000711011 | Human | Colorectum | AD | 1.27e-09 | -4.52e-01 | 0.0674 |
| 83660 | TLN2 | HTA11_6818_2000001011 | Human | Colorectum | AD | 7.06e-04 | -4.27e-01 | 0.0112 |
| 83660 | TLN2 | HTA11_6818_2000001021 | Human | Colorectum | AD | 5.63e-12 | -6.49e-01 | 0.0588 |
| 83660 | TLN2 | HTA11_99999970781_79442 | Human | Colorectum | MSS | 8.01e-39 | -8.26e-01 | 0.294 |
| 83660 | TLN2 | HTA11_99999971662_82457 | Human | Colorectum | MSS | 5.50e-55 | -1.06e+00 | 0.3859 |
| 83660 | TLN2 | HTA11_99999973899_84307 | Human | Colorectum | MSS | 1.07e-17 | -1.02e+00 | 0.2585 |
| 83660 | TLN2 | HTA11_99999974143_84620 | Human | Colorectum | MSS | 1.28e-51 | -9.32e-01 | 0.3005 |
| 83660 | TLN2 | F007 | Human | Colorectum | FAP | 8.09e-05 | -3.94e-01 | 0.1176 |
| 83660 | TLN2 | A002-C-010 | Human | Colorectum | FAP | 3.77e-04 | -3.49e-01 | 0.242 |
| 83660 | TLN2 | A001-C-207 | Human | Colorectum | FAP | 1.18e-06 | -3.72e-01 | 0.1278 |
| 83660 | TLN2 | A015-C-203 | Human | Colorectum | FAP | 3.71e-38 | -6.70e-01 | -0.1294 |
| 83660 | TLN2 | A015-C-204 | Human | Colorectum | FAP | 7.06e-13 | -5.73e-01 | -0.0228 |
| 83660 | TLN2 | A014-C-040 | Human | Colorectum | FAP | 2.23e-11 | -7.55e-01 | -0.1184 |
| 83660 | TLN2 | A002-C-201 | Human | Colorectum | FAP | 1.54e-23 | -6.07e-01 | 0.0324 |
| Page: 1 2 3 4 |
| Tissue | Expression Dynamics | Abbreviation |
| Colorectum (GSE201348) | 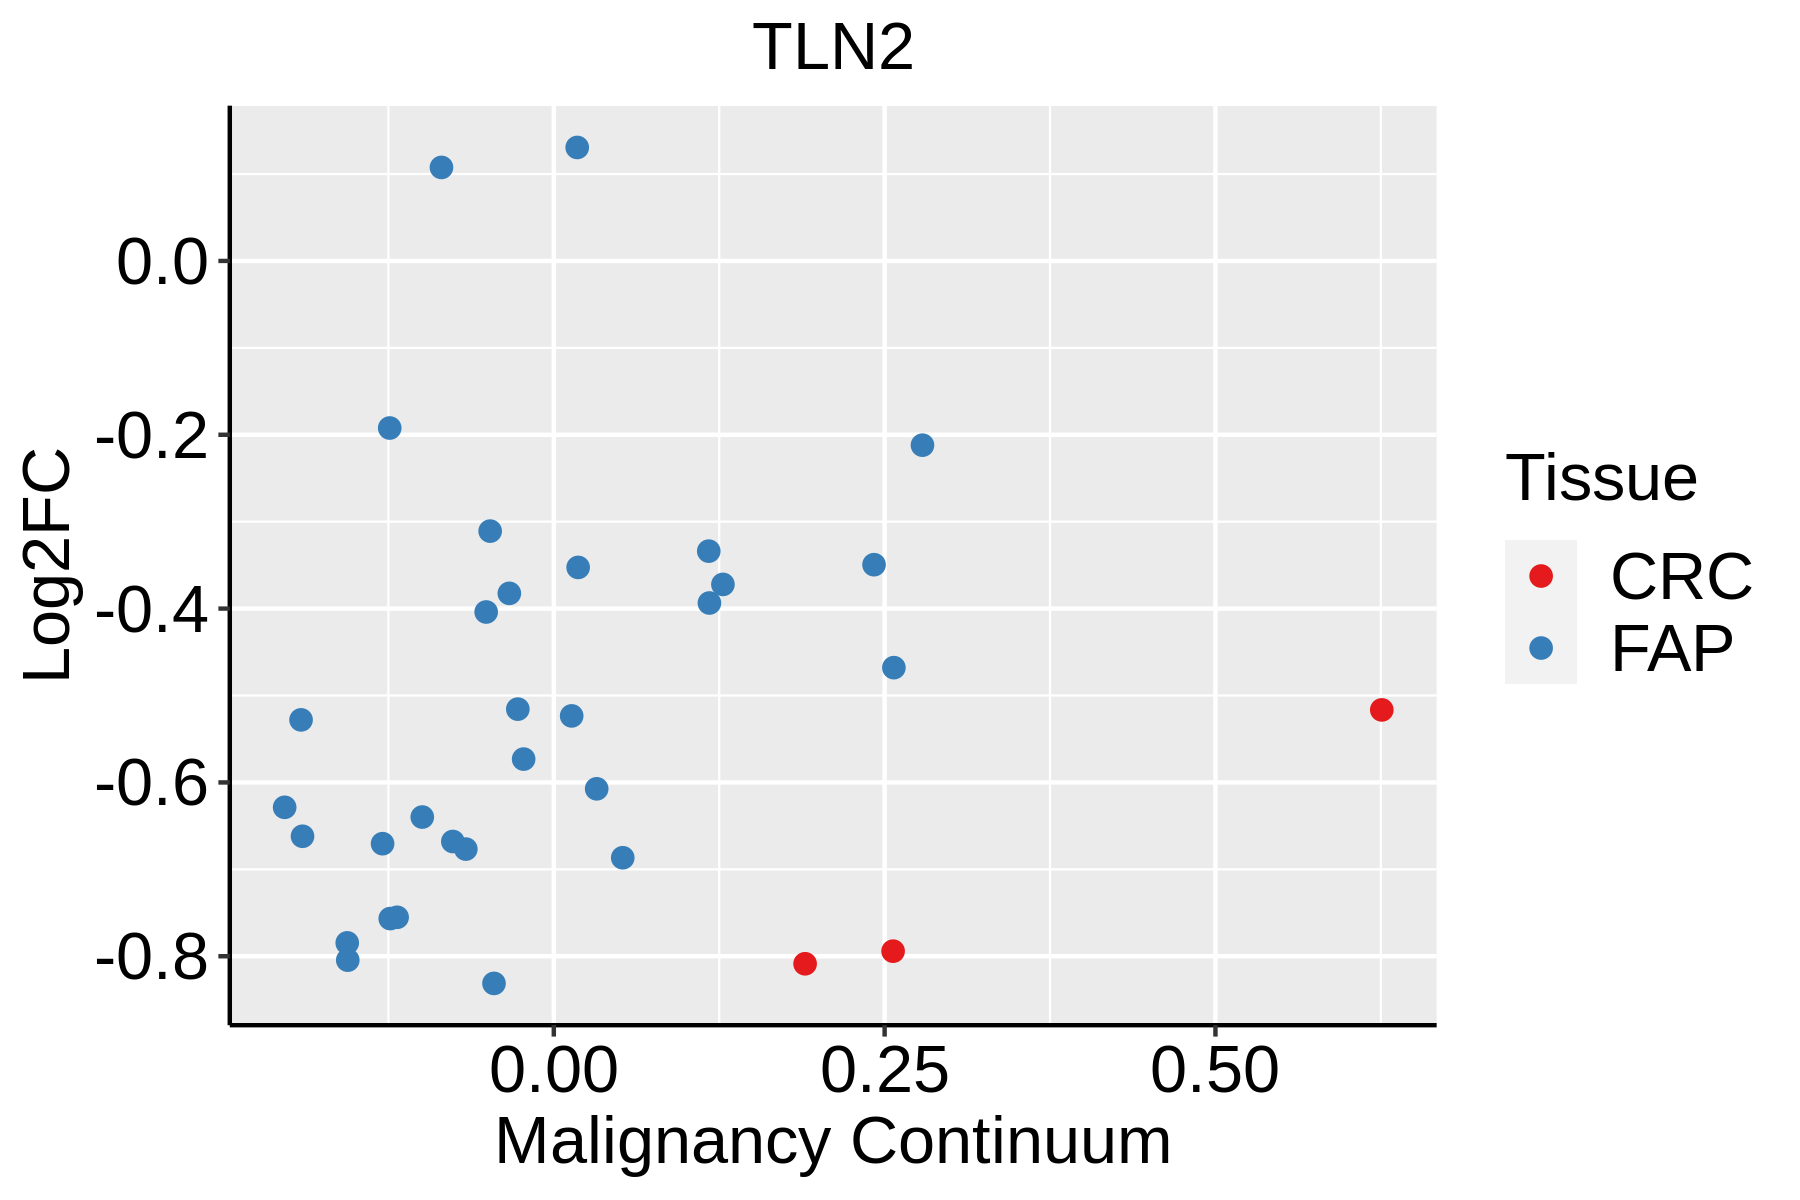 | FAP: Familial adenomatous polyposis |
| CRC: Colorectal cancer | ||
| Colorectum (HTA11) |  | AD: Adenomas |
| SER: Sessile serrated lesions | ||
| MSI-H: Microsatellite-high colorectal cancer | ||
| MSS: Microsatellite stable colorectal cancer | ||
| Endometrium | 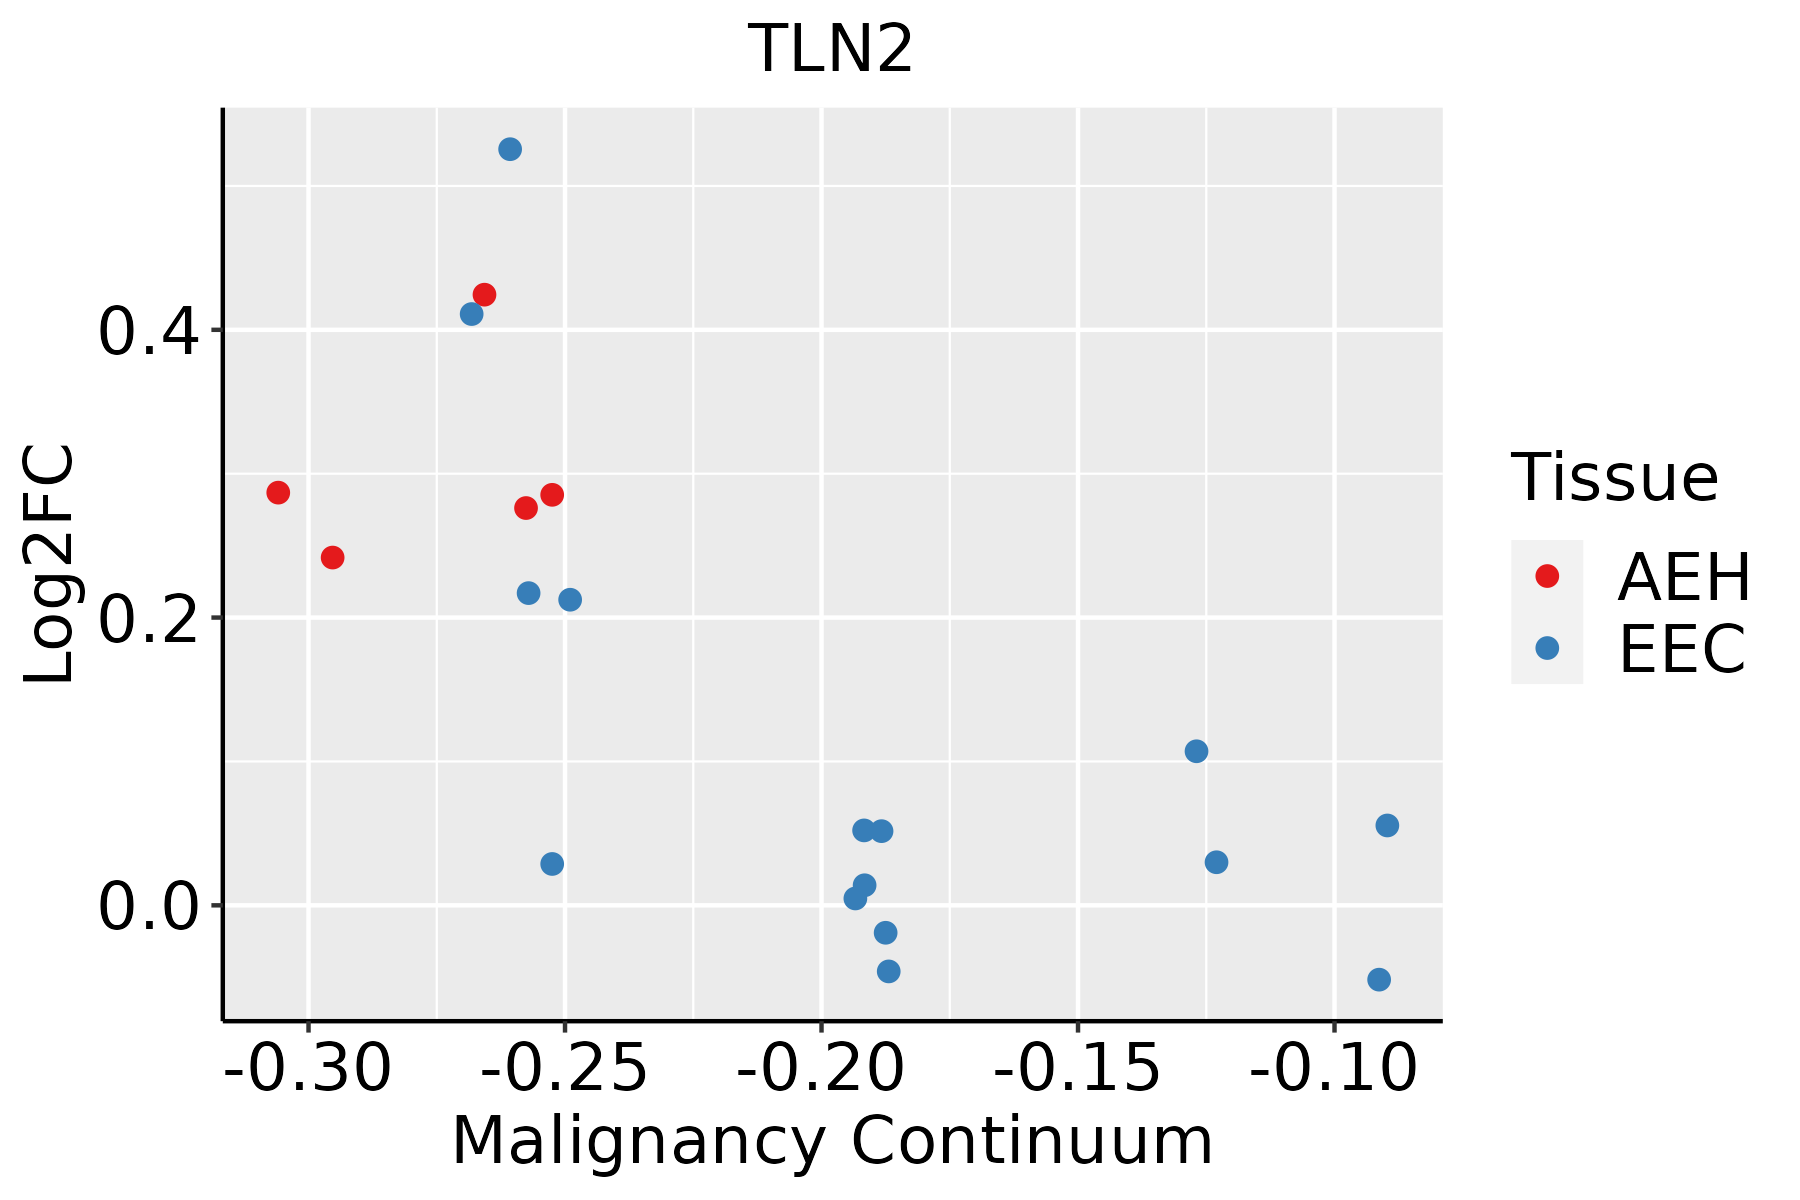 | AEH: Atypical endometrial hyperplasia |
| EEC: Endometrioid Cancer | ||
| Lung | 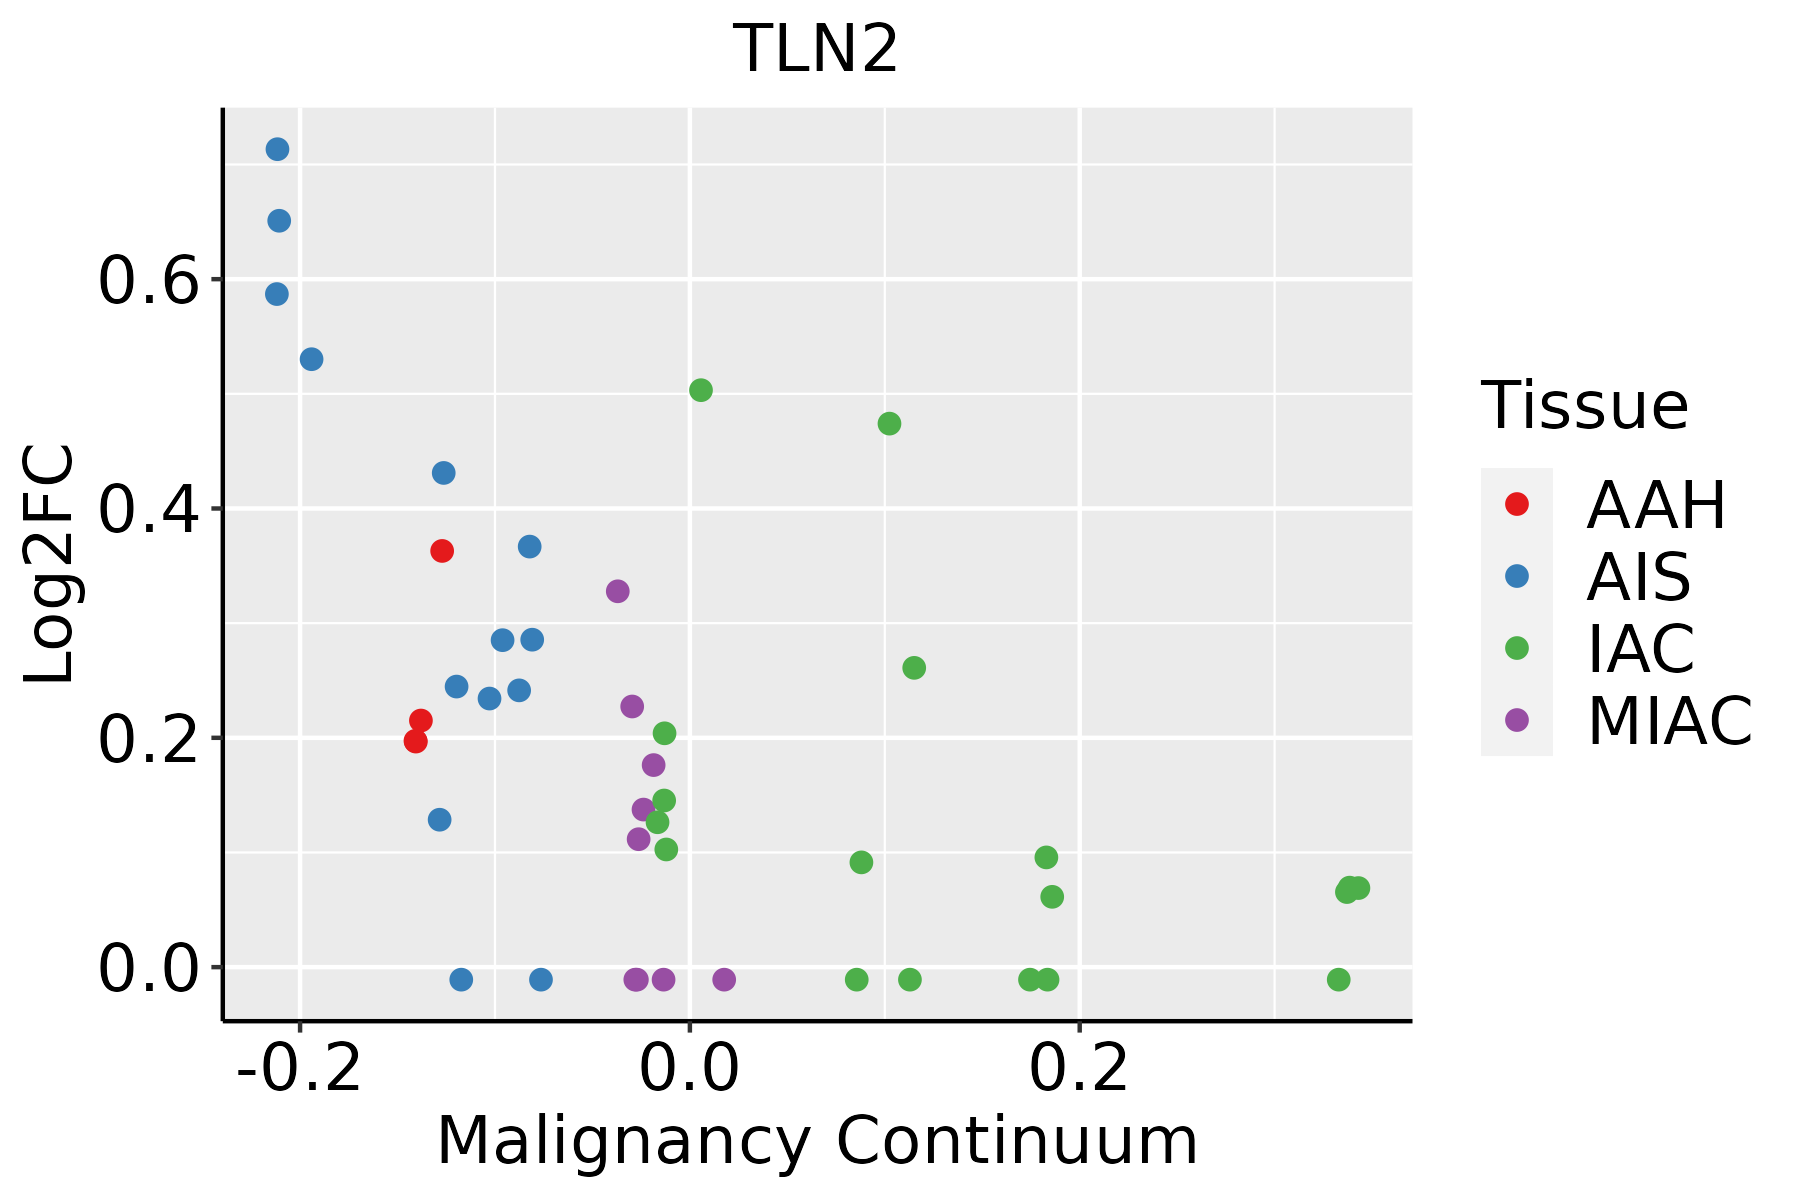 | AAH: Atypical adenomatous hyperplasia |
| AIS: Adenocarcinoma in situ | ||
| IAC: Invasive lung adenocarcinoma | ||
| MIA: Minimally invasive adenocarcinoma | ||
| Thyroid | 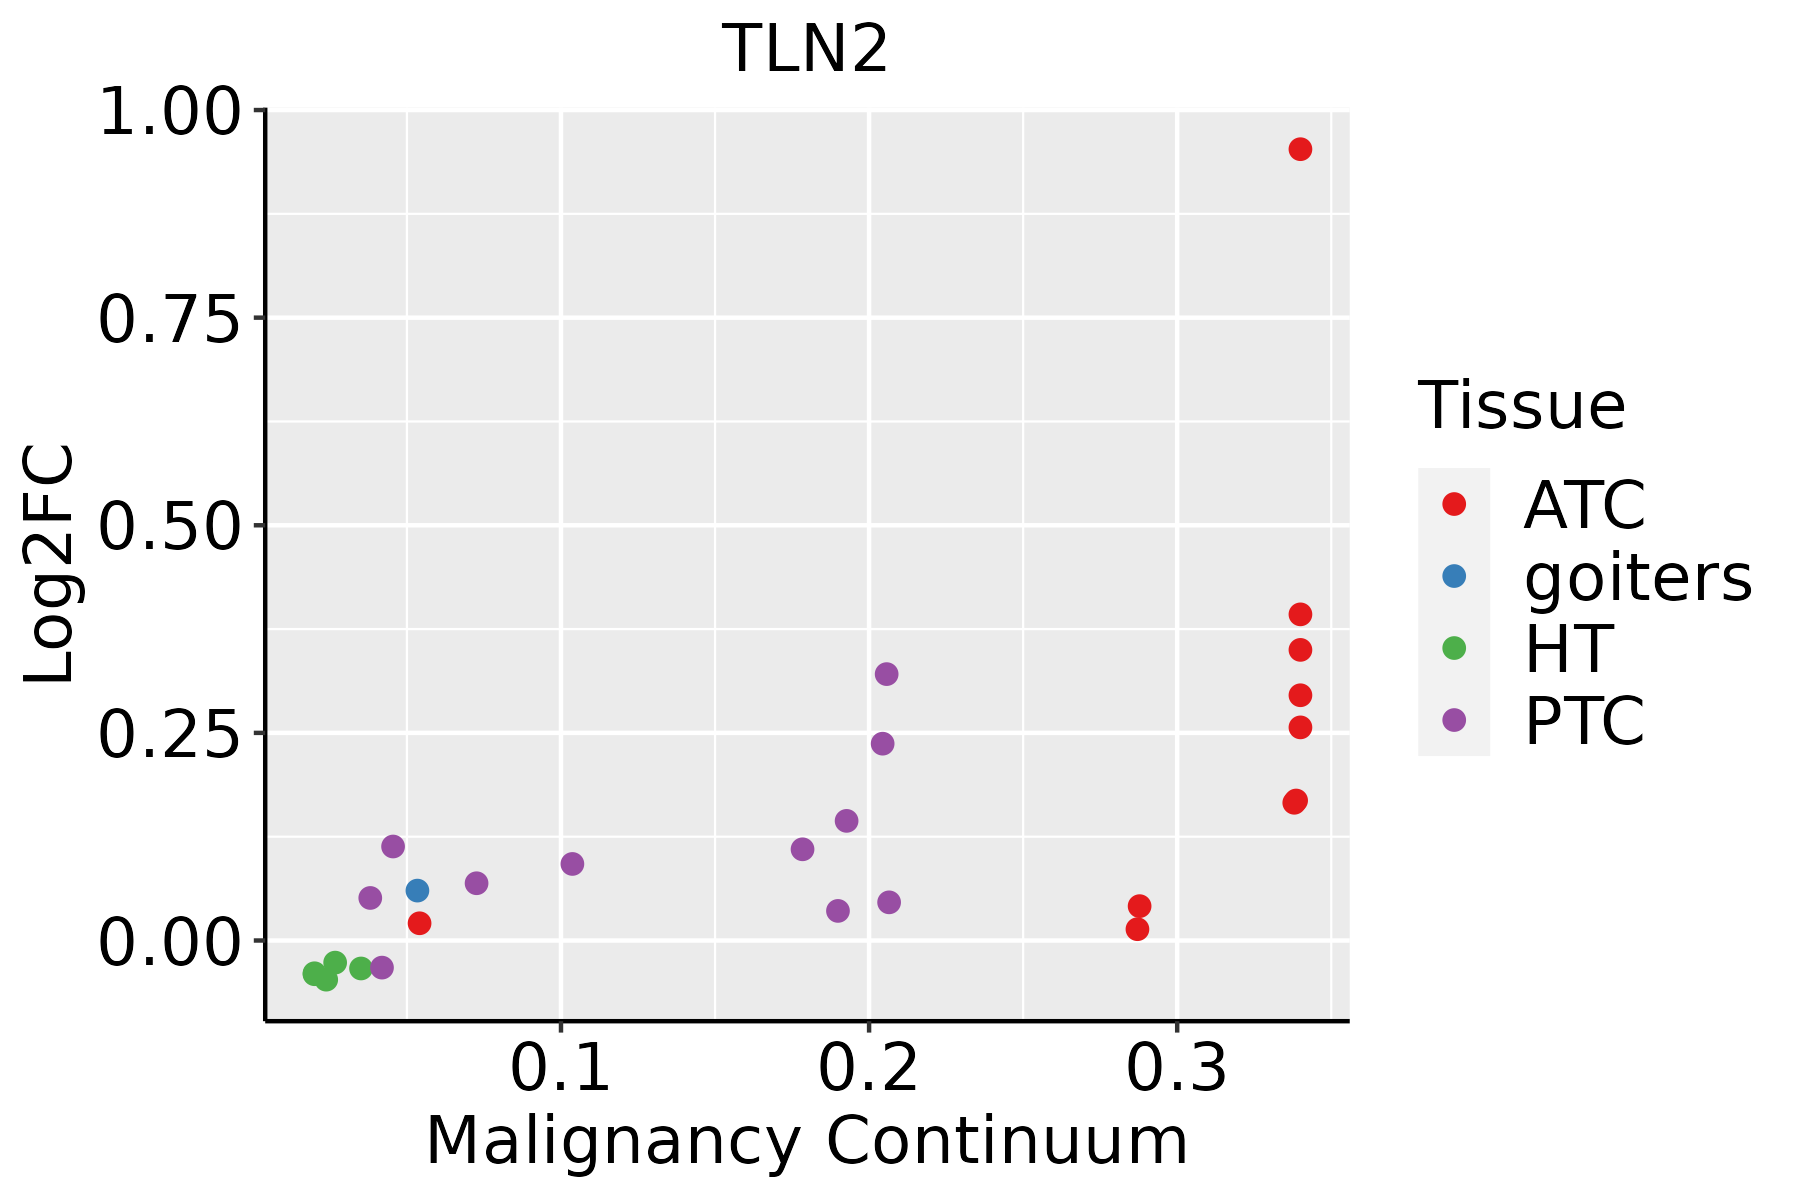 | ATC: Anaplastic thyroid cancer |
| HT: Hashimoto's thyroiditis | ||
| PTC: Papillary thyroid cancer |
| ∗log2FC in expression of this searched gene in stem-like cells from each diseased tissue sample relative to stem-like cells in normal samples in each tissue plotted against the malignancy continuum. Samples are colored based on if they are from different disease stage. |
Top |
Malignant transformation related pathway analysis |
| Find out the enriched GO biological processes and KEGG pathways involved in transition from healthy to precancer to cancer |
| Tissue | Disease Stage | Enriched GO biological Processes |
| Colorectum | AD |  |
| Colorectum | SER |  |
| Colorectum | MSS |  |
| Colorectum | MSI-H |  |
| Colorectum | FAP |  |
| ∗Top 15 enriched GO BP terms are showed in the bar plot of each disease state in each tissue. Each row represents a significant GO biological process which is colored according to the -log10(p.adjust). |
| Page: 1 2 3 4 5 6 7 8 9 |
| GO ID | Tissue | Disease Stage | Description | Gene Ratio | Bg Ratio | pvalue | p.adjust | Count |
| GO:0045216 | Colorectum | AD | cell-cell junction organization | 80/3918 | 200/18723 | 5.57e-10 | 4.58e-08 | 80 |
| GO:0034329 | Colorectum | AD | cell junction assembly | 136/3918 | 420/18723 | 2.02e-08 | 1.15e-06 | 136 |
| GO:0007043 | Colorectum | AD | cell-cell junction assembly | 57/3918 | 146/18723 | 4.18e-07 | 1.61e-05 | 57 |
| GO:00452161 | Colorectum | SER | cell-cell junction organization | 63/2897 | 200/18723 | 9.15e-09 | 7.80e-07 | 63 |
| GO:00070431 | Colorectum | SER | cell-cell junction assembly | 45/2897 | 146/18723 | 2.23e-06 | 9.31e-05 | 45 |
| GO:00343291 | Colorectum | SER | cell junction assembly | 100/2897 | 420/18723 | 4.23e-06 | 1.61e-04 | 100 |
| GO:00452162 | Colorectum | MSS | cell-cell junction organization | 69/3467 | 200/18723 | 5.07e-08 | 2.70e-06 | 69 |
| GO:00343292 | Colorectum | MSS | cell junction assembly | 120/3467 | 420/18723 | 2.51e-07 | 1.07e-05 | 120 |
| GO:00070432 | Colorectum | MSS | cell-cell junction assembly | 50/3467 | 146/18723 | 4.24e-06 | 1.21e-04 | 50 |
| GO:00343293 | Colorectum | FAP | cell junction assembly | 105/2622 | 420/18723 | 1.03e-09 | 2.18e-07 | 105 |
| GO:00452164 | Colorectum | FAP | cell-cell junction organization | 58/2622 | 200/18723 | 2.51e-08 | 2.36e-06 | 58 |
| GO:00070434 | Colorectum | FAP | cell-cell junction assembly | 39/2622 | 146/18723 | 3.74e-05 | 8.09e-04 | 39 |
| GO:00343294 | Colorectum | CRC | cell junction assembly | 83/2078 | 420/18723 | 1.08e-07 | 1.29e-05 | 83 |
| GO:00452165 | Colorectum | CRC | cell-cell junction organization | 48/2078 | 200/18723 | 1.67e-07 | 1.72e-05 | 48 |
| GO:00070435 | Colorectum | CRC | cell-cell junction assembly | 31/2078 | 146/18723 | 2.75e-04 | 4.40e-03 | 31 |
| GO:00343299 | Endometrium | AEH | cell junction assembly | 78/2100 | 420/18723 | 4.80e-06 | 1.24e-04 | 78 |
| GO:004521610 | Endometrium | AEH | cell-cell junction organization | 42/2100 | 200/18723 | 4.26e-05 | 7.20e-04 | 42 |
| GO:000704310 | Endometrium | AEH | cell-cell junction assembly | 30/2100 | 146/18723 | 7.29e-04 | 6.98e-03 | 30 |
| GO:003432914 | Endometrium | EEC | cell junction assembly | 79/2168 | 420/18723 | 8.37e-06 | 1.85e-04 | 79 |
| GO:004521615 | Endometrium | EEC | cell-cell junction organization | 42/2168 | 200/18723 | 8.84e-05 | 1.25e-03 | 42 |
| Page: 1 2 |
| Pathway ID | Tissue | Disease Stage | Description | Gene Ratio | Bg Ratio | pvalue | p.adjust | qvalue | Count |
| hsa05131 | Colorectum | AD | Shigellosis | 109/2092 | 247/8465 | 1.09e-11 | 2.44e-10 | 1.55e-10 | 109 |
| hsa04015 | Colorectum | AD | Rap1 signaling pathway | 71/2092 | 210/8465 | 1.72e-03 | 9.68e-03 | 6.18e-03 | 71 |
| hsa04510 | Colorectum | AD | Focal adhesion | 67/2092 | 203/8465 | 4.40e-03 | 2.17e-02 | 1.38e-02 | 67 |
| hsa05166 | Colorectum | AD | Human T-cell leukemia virus 1 infection | 72/2092 | 222/8465 | 5.24e-03 | 2.44e-02 | 1.55e-02 | 72 |
| hsa051311 | Colorectum | AD | Shigellosis | 109/2092 | 247/8465 | 1.09e-11 | 2.44e-10 | 1.55e-10 | 109 |
| hsa040151 | Colorectum | AD | Rap1 signaling pathway | 71/2092 | 210/8465 | 1.72e-03 | 9.68e-03 | 6.18e-03 | 71 |
| hsa045101 | Colorectum | AD | Focal adhesion | 67/2092 | 203/8465 | 4.40e-03 | 2.17e-02 | 1.38e-02 | 67 |
| hsa051661 | Colorectum | AD | Human T-cell leukemia virus 1 infection | 72/2092 | 222/8465 | 5.24e-03 | 2.44e-02 | 1.55e-02 | 72 |
| hsa051312 | Colorectum | SER | Shigellosis | 87/1580 | 247/8465 | 3.07e-10 | 7.27e-09 | 5.28e-09 | 87 |
| hsa040152 | Colorectum | SER | Rap1 signaling pathway | 54/1580 | 210/8465 | 6.55e-03 | 3.68e-02 | 2.67e-02 | 54 |
| hsa051313 | Colorectum | SER | Shigellosis | 87/1580 | 247/8465 | 3.07e-10 | 7.27e-09 | 5.28e-09 | 87 |
| hsa040153 | Colorectum | SER | Rap1 signaling pathway | 54/1580 | 210/8465 | 6.55e-03 | 3.68e-02 | 2.67e-02 | 54 |
| hsa051314 | Colorectum | MSS | Shigellosis | 94/1875 | 247/8465 | 6.82e-09 | 1.34e-07 | 8.23e-08 | 94 |
| hsa040154 | Colorectum | MSS | Rap1 signaling pathway | 66/1875 | 210/8465 | 1.03e-03 | 5.94e-03 | 3.64e-03 | 66 |
| hsa051662 | Colorectum | MSS | Human T-cell leukemia virus 1 infection | 68/1875 | 222/8465 | 1.84e-03 | 9.61e-03 | 5.89e-03 | 68 |
| hsa051315 | Colorectum | MSS | Shigellosis | 94/1875 | 247/8465 | 6.82e-09 | 1.34e-07 | 8.23e-08 | 94 |
| hsa040155 | Colorectum | MSS | Rap1 signaling pathway | 66/1875 | 210/8465 | 1.03e-03 | 5.94e-03 | 3.64e-03 | 66 |
| hsa051663 | Colorectum | MSS | Human T-cell leukemia virus 1 infection | 68/1875 | 222/8465 | 1.84e-03 | 9.61e-03 | 5.89e-03 | 68 |
| hsa051318 | Colorectum | FAP | Shigellosis | 76/1404 | 247/8465 | 1.57e-08 | 5.84e-07 | 3.55e-07 | 76 |
| hsa045102 | Colorectum | FAP | Focal adhesion | 61/1404 | 203/8465 | 1.03e-06 | 2.15e-05 | 1.31e-05 | 61 |
| Page: 1 2 3 |
Top |
Cell-cell communication analysis |
| Identification of potential cell-cell interactions between two cell types and their ligand-receptor pairs for different disease states |
| Ligand | Receptor | LRpair | Pathway | Tissue | Disease Stage |
| Page: 1 |
Top |
Single-cell gene regulatory network inference analysis |
| Find out the significant the regulons (TFs) and the target genes of each regulon across cell types for different disease states |
| TF | Cell Type | Tissue | Disease Stage | Target Gene | RSS | Regulon Activity |
| ∗The dot plots of a searched regulon are shown for all cell subpopulations in each disease state of each tissue based on the regulon specific score inferred using pySCENIC and by calculating the average expression. |
| Page: 1 |
Top |
Somatic mutation of malignant transformation related genes |
| Annotation of somatic variants for genes involved in malignant transformation |
| Hugo Symbol | Variant Class | Variant Classification | dbSNP RS | HGVSc | HGVSp | HGVSp Short | SWISSPROT | BIOTYPE | SIFT | PolyPhen | Tumor Sample Barcode | Tissue | Histology | Sex | Age | Stage | Therapy Types | Drugs | Outcome |
| TLN2 | SNV | Missense_Mutation | rs754986736 | c.1454N>A | p.Arg485Gln | p.R485Q | Q9Y4G6 | protein_coding | tolerated(0.4) | possibly_damaging(0.716) | TCGA-A8-A09G-01 | Breast | breast invasive carcinoma | Female | >=65 | III/IV | Unknown | Unknown | SD |
| TLN2 | SNV | Missense_Mutation | novel | c.5716G>A | p.Ala1906Thr | p.A1906T | Q9Y4G6 | protein_coding | tolerated(0.19) | benign(0.155) | TCGA-A8-A09Z-01 | Breast | breast invasive carcinoma | Female | >=65 | I/II | Unknown | Unknown | SD |
| TLN2 | SNV | Missense_Mutation | c.7362N>T | p.Met2454Ile | p.M2454I | Q9Y4G6 | protein_coding | tolerated(0.07) | probably_damaging(0.992) | TCGA-B6-A0IK-01 | Breast | breast invasive carcinoma | Female | <65 | III/IV | Unknown | Unknown | PD | |
| TLN2 | SNV | Missense_Mutation | novel | c.3484G>A | p.Glu1162Lys | p.E1162K | Q9Y4G6 | protein_coding | tolerated(0.67) | benign(0.269) | TCGA-BH-A0HF-01 | Breast | breast invasive carcinoma | Female | >=65 | I/II | Hormone Therapy | arimidex | SD |
| TLN2 | SNV | Missense_Mutation | c.5096N>T | p.Ala1699Val | p.A1699V | Q9Y4G6 | protein_coding | tolerated(0.1) | benign(0.354) | TCGA-BH-A18G-01 | Breast | breast invasive carcinoma | Female | >=65 | I/II | Unknown | Unknown | SD | |
| TLN2 | SNV | Missense_Mutation | c.3785C>T | p.Thr1262Ile | p.T1262I | Q9Y4G6 | protein_coding | tolerated(0.25) | benign(0.11) | TCGA-C8-A12Q-01 | Breast | breast invasive carcinoma | Female | >=65 | III/IV | Unknown | Unknown | PD | |
| TLN2 | SNV | Missense_Mutation | novel | c.514G>A | p.Asp172Asn | p.D172N | Q9Y4G6 | protein_coding | deleterious(0) | benign(0.263) | TCGA-C8-A26Y-01 | Breast | breast invasive carcinoma | Female | >=65 | I/II | Unknown | Unknown | SD |
| TLN2 | SNV | Missense_Mutation | c.4714G>A | p.Glu1572Lys | p.E1572K | Q9Y4G6 | protein_coding | tolerated(0.17) | possibly_damaging(0.593) | TCGA-C8-A26Y-01 | Breast | breast invasive carcinoma | Female | >=65 | I/II | Unknown | Unknown | SD | |
| TLN2 | SNV | Missense_Mutation | c.626N>A | p.Arg209Lys | p.R209K | Q9Y4G6 | protein_coding | tolerated(0.1) | probably_damaging(0.993) | TCGA-D8-A1J8-01 | Breast | breast invasive carcinoma | Female | >=65 | I/II | Hormone Therapy | nolvadex | SD | |
| TLN2 | SNV | Missense_Mutation | novel | c.6479N>G | p.Val2160Gly | p.V2160G | Q9Y4G6 | protein_coding | deleterious(0.03) | benign(0.088) | TCGA-D8-A1JD-01 | Breast | breast invasive carcinoma | Female | <65 | I/II | Chemotherapy | adriamycin | SD |
| Page: 1 2 3 4 5 6 7 8 9 10 11 12 13 14 15 16 17 18 19 20 21 22 23 24 25 26 |
Top |
Related drugs of malignant transformation related genes |
| Identification of chemicals and drugs interact with genes involved in malignant transfromation |
| (DGIdb 4.0) |
| Entrez ID | Symbol | Category | Interaction Types | Drug Claim Name | Drug Name | PMIDs |
| Page: 1 |

Copyright 2023-Present -The University of Texas Health Science Center at Houston |