
|
|||||
|
 | |
| |
| |
| |
| |
| |
|
Gene: TLN1 |
Gene summary for TLN1 |
| Gene information | Species | Human | Gene symbol | TLN1 | Gene ID | 7094 |
| Gene name | talin 1 | |
| Gene Alias | ILWEQ | |
| Cytomap | 9p13.3 | |
| Gene Type | protein-coding | GO ID | GO:0001775 | UniProtAcc | Q9Y490 |
Top |
Malignant transformation analysis |
| Identification of the aberrant gene expression in precancerous and cancerous lesions by comparing the gene expression of stem-like cells in diseased tissues with normal stem cells |
| Entrez ID | Symbol | Replicates | Species | Organ | Tissue | Adj P-value | Log2FC | Malignancy |
| 7094 | TLN1 | CA_HPV_1 | Human | Cervix | CC | 1.08e-06 | 1.03e-01 | 0.0264 |
| 7094 | TLN1 | CA_HPV_3 | Human | Cervix | CC | 1.87e-06 | -1.65e-01 | 0.0414 |
| 7094 | TLN1 | CCI_1 | Human | Cervix | CC | 3.11e-06 | -6.71e-01 | 0.528 |
| 7094 | TLN1 | CCI_3 | Human | Cervix | CC | 6.80e-07 | -6.30e-01 | 0.516 |
| 7094 | TLN1 | CCII_1 | Human | Cervix | CC | 3.40e-16 | -7.18e-01 | 0.3249 |
| 7094 | TLN1 | Tumor | Human | Cervix | CC | 8.37e-16 | -5.33e-01 | 0.1241 |
| 7094 | TLN1 | sample3 | Human | Cervix | CC | 3.97e-18 | -5.09e-01 | 0.1387 |
| 7094 | TLN1 | H2 | Human | Cervix | HSIL_HPV | 2.26e-06 | -3.63e-01 | 0.0632 |
| 7094 | TLN1 | L1 | Human | Cervix | CC | 1.36e-11 | -6.04e-01 | 0.0802 |
| 7094 | TLN1 | T1 | Human | Cervix | CC | 5.19e-08 | -4.78e-01 | 0.0918 |
| 7094 | TLN1 | T3 | Human | Cervix | CC | 2.40e-15 | -5.17e-01 | 0.1389 |
| 7094 | TLN1 | HTA11_3410_2000001011 | Human | Colorectum | AD | 8.82e-06 | 2.23e-01 | 0.0155 |
| 7094 | TLN1 | HTA11_1938_2000001011 | Human | Colorectum | AD | 2.27e-03 | 2.97e-01 | -0.0811 |
| 7094 | TLN1 | HTA11_347_2000001011 | Human | Colorectum | AD | 2.14e-12 | 3.72e-01 | -0.1954 |
| 7094 | TLN1 | HTA11_696_2000001011 | Human | Colorectum | AD | 2.39e-09 | 3.67e-01 | -0.1464 |
| 7094 | TLN1 | HTA11_866_2000001011 | Human | Colorectum | AD | 1.44e-04 | 2.85e-01 | -0.1001 |
| 7094 | TLN1 | HTA11_1391_2000001011 | Human | Colorectum | AD | 2.98e-08 | 4.99e-01 | -0.059 |
| 7094 | TLN1 | HTA11_546_2000001011 | Human | Colorectum | AD | 2.27e-03 | 3.01e-01 | -0.0842 |
| 7094 | TLN1 | HTA11_10711_2000001011 | Human | Colorectum | AD | 1.42e-02 | 2.59e-01 | 0.0338 |
| 7094 | TLN1 | HTA11_7696_3000711011 | Human | Colorectum | AD | 3.46e-16 | 5.44e-01 | 0.0674 |
| Page: 1 2 3 4 5 6 7 8 9 |
| Tissue | Expression Dynamics | Abbreviation |
| Cervix | 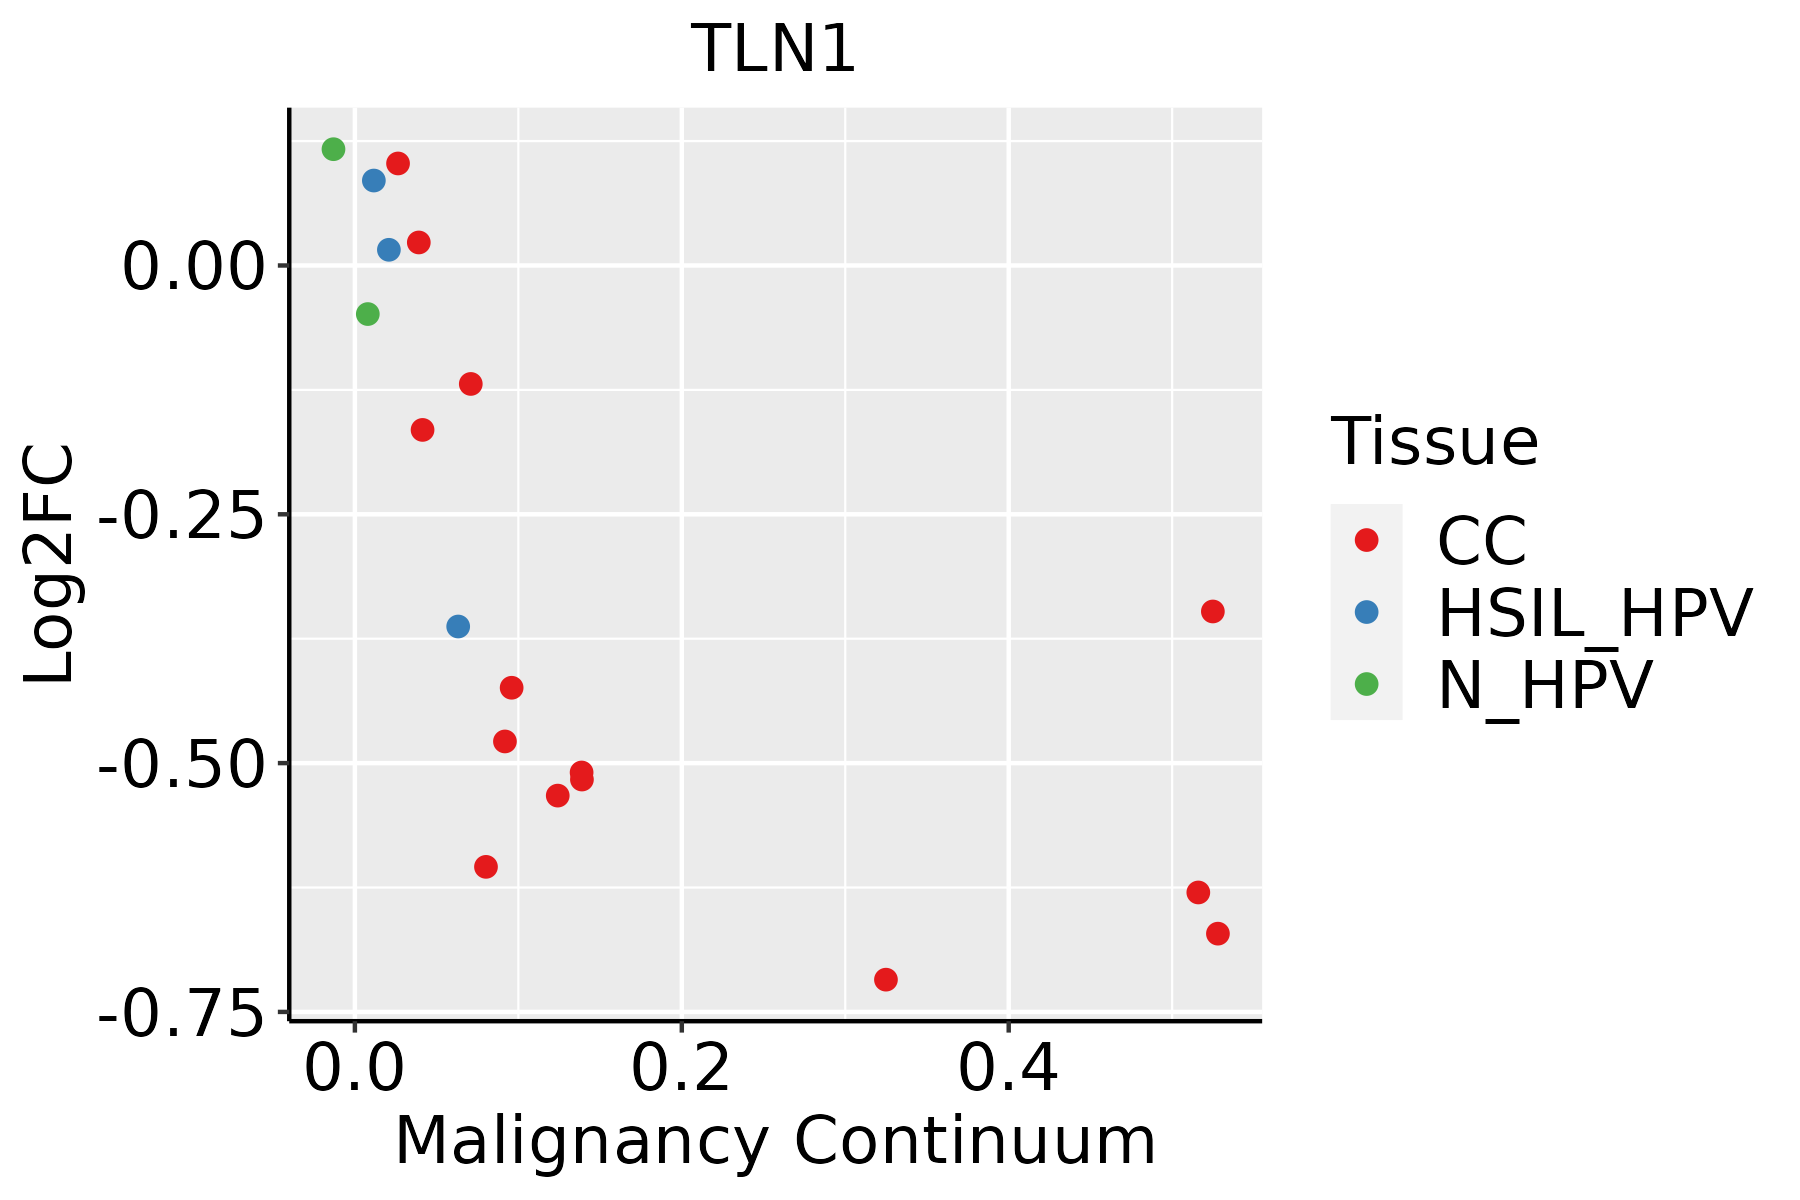 | CC: Cervix cancer |
| HSIL_HPV: HPV-infected high-grade squamous intraepithelial lesions | ||
| N_HPV: HPV-infected normal cervix | ||
| Colorectum (GSE201348) |  | FAP: Familial adenomatous polyposis |
| CRC: Colorectal cancer | ||
| Colorectum (HTA11) |  | AD: Adenomas |
| SER: Sessile serrated lesions | ||
| MSI-H: Microsatellite-high colorectal cancer | ||
| MSS: Microsatellite stable colorectal cancer | ||
| Esophagus | 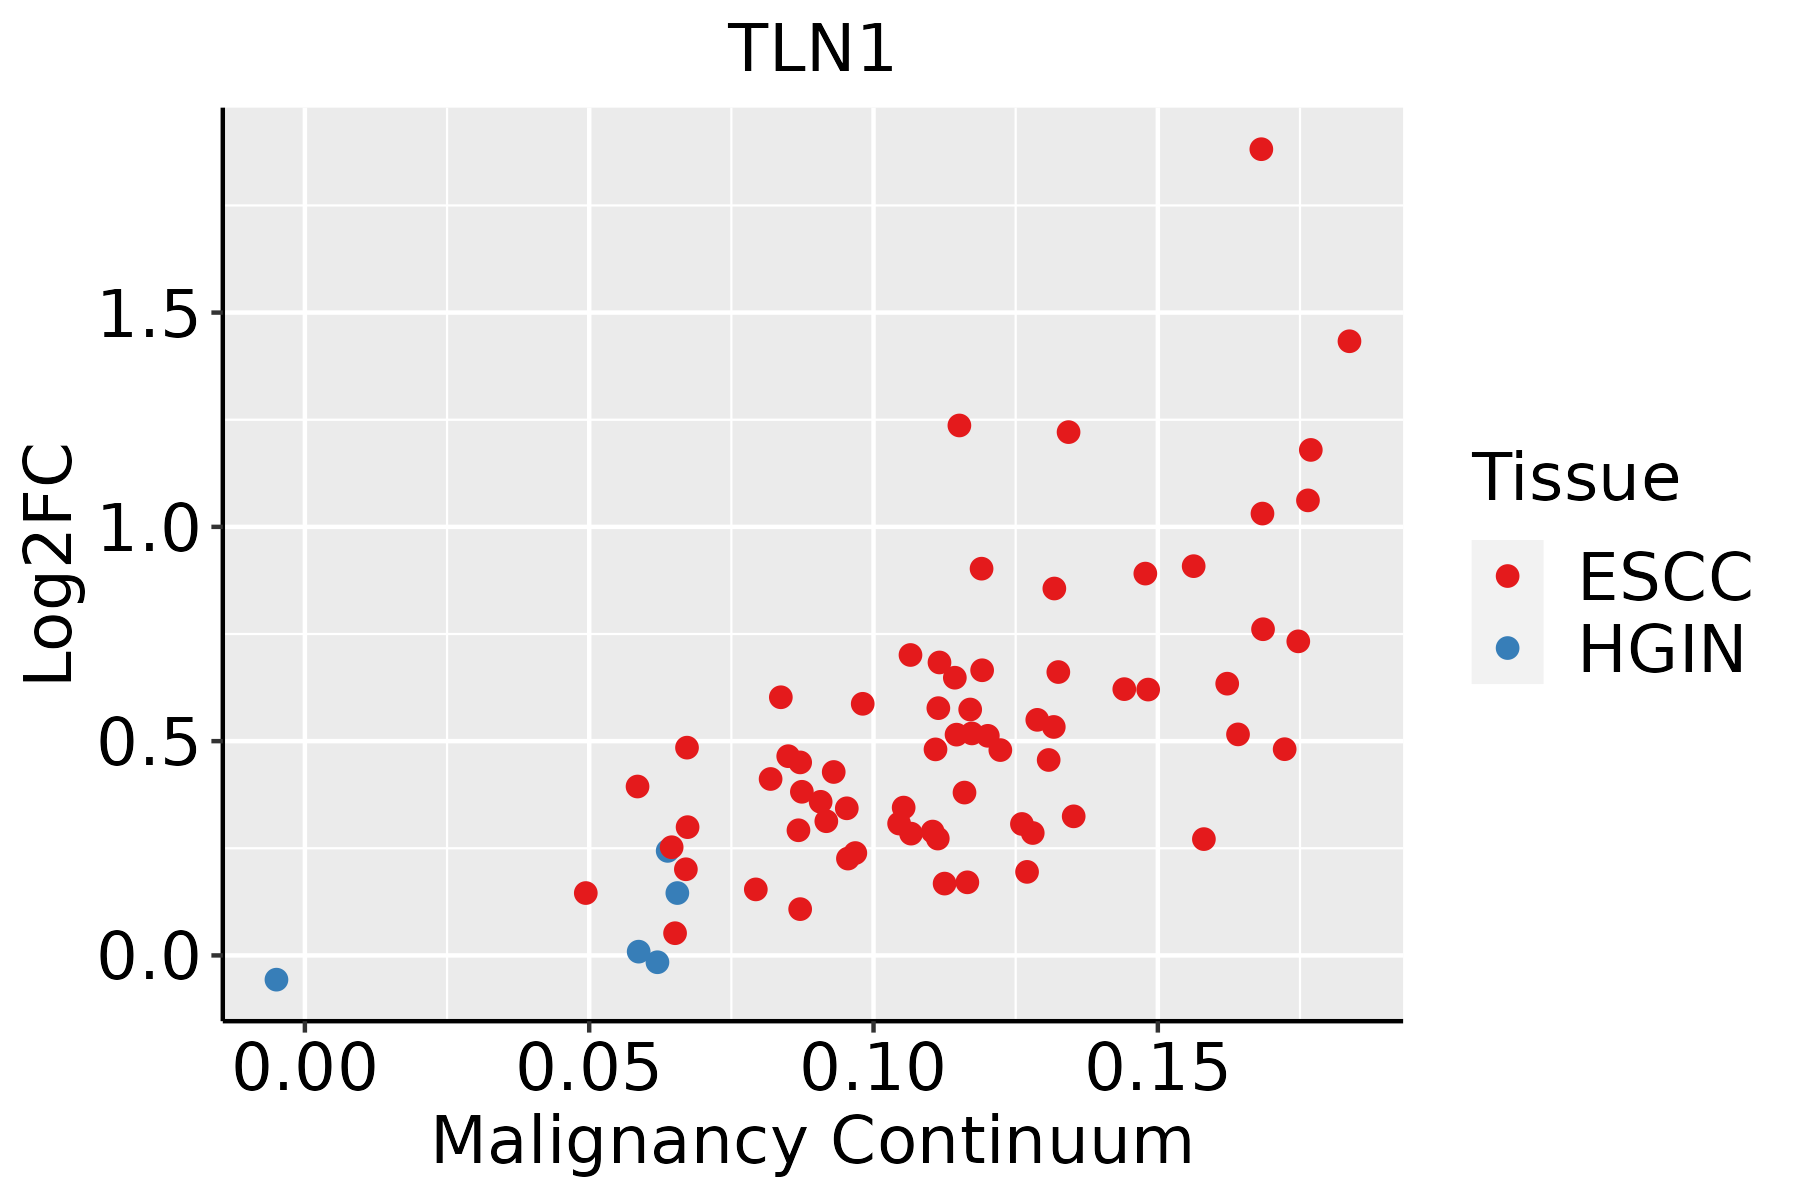 | ESCC: Esophageal squamous cell carcinoma |
| HGIN: High-grade intraepithelial neoplasias | ||
| LGIN: Low-grade intraepithelial neoplasias | ||
| Liver | 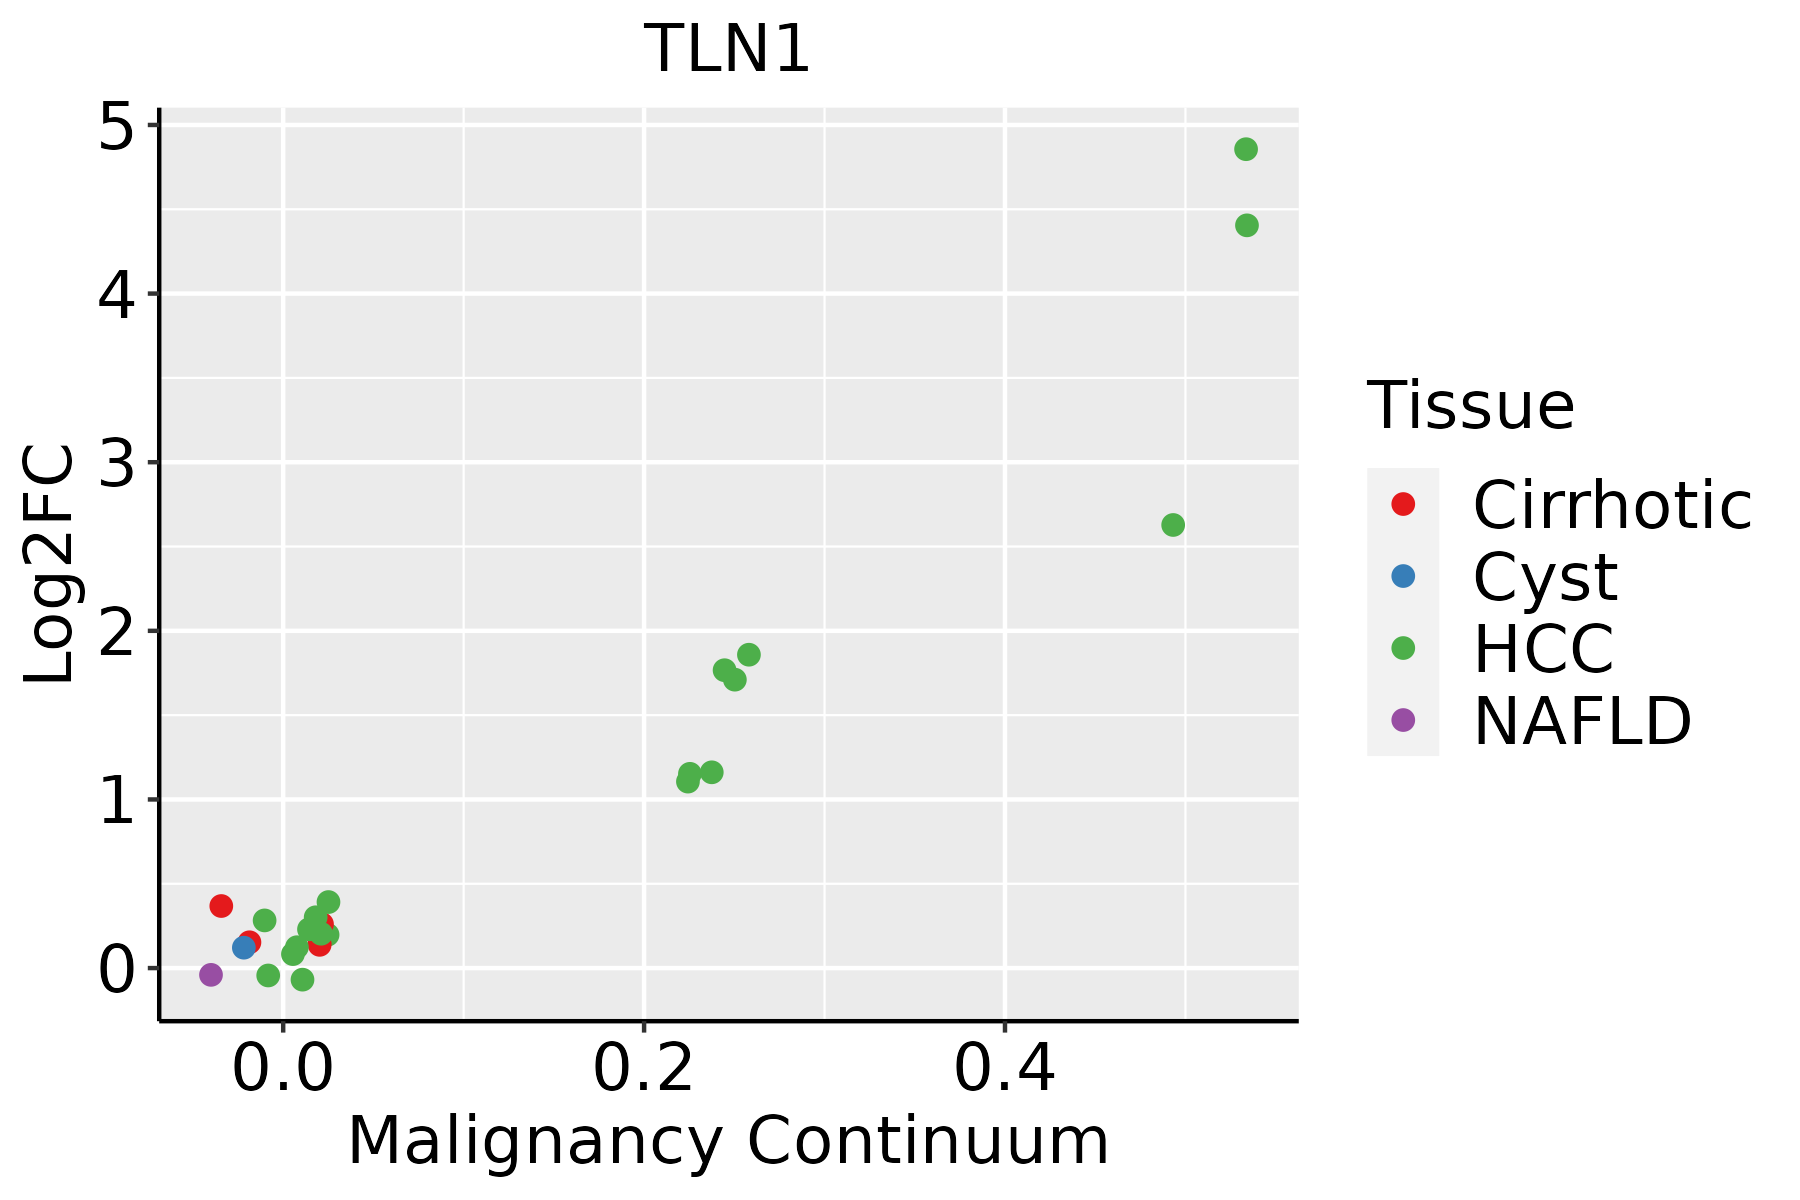 | HCC: Hepatocellular carcinoma |
| NAFLD: Non-alcoholic fatty liver disease | ||
| Oral Cavity | 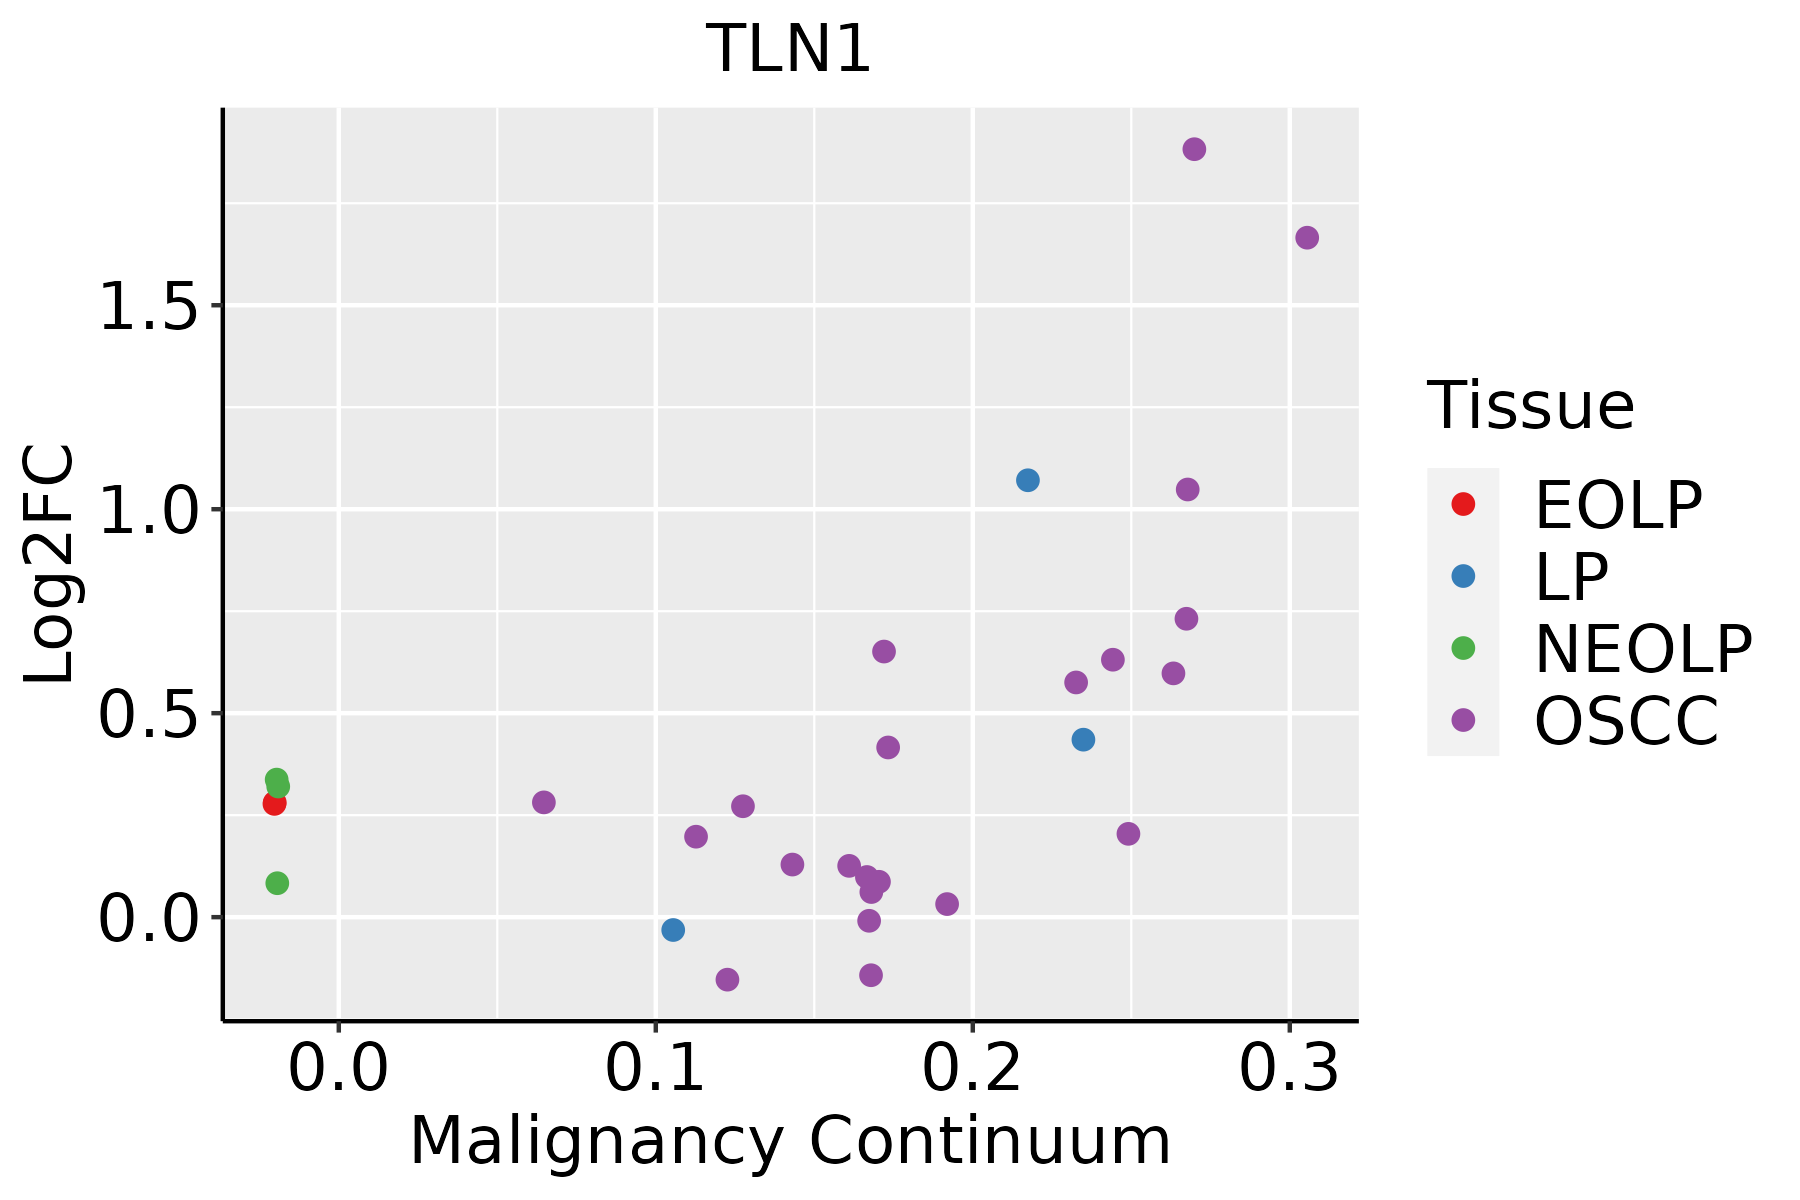 | EOLP: Erosive Oral lichen planus |
| LP: leukoplakia | ||
| NEOLP: Non-erosive oral lichen planus | ||
| OSCC: Oral squamous cell carcinoma | ||
| Prostate |  | BPH: Benign Prostatic Hyperplasia |
| Skin | 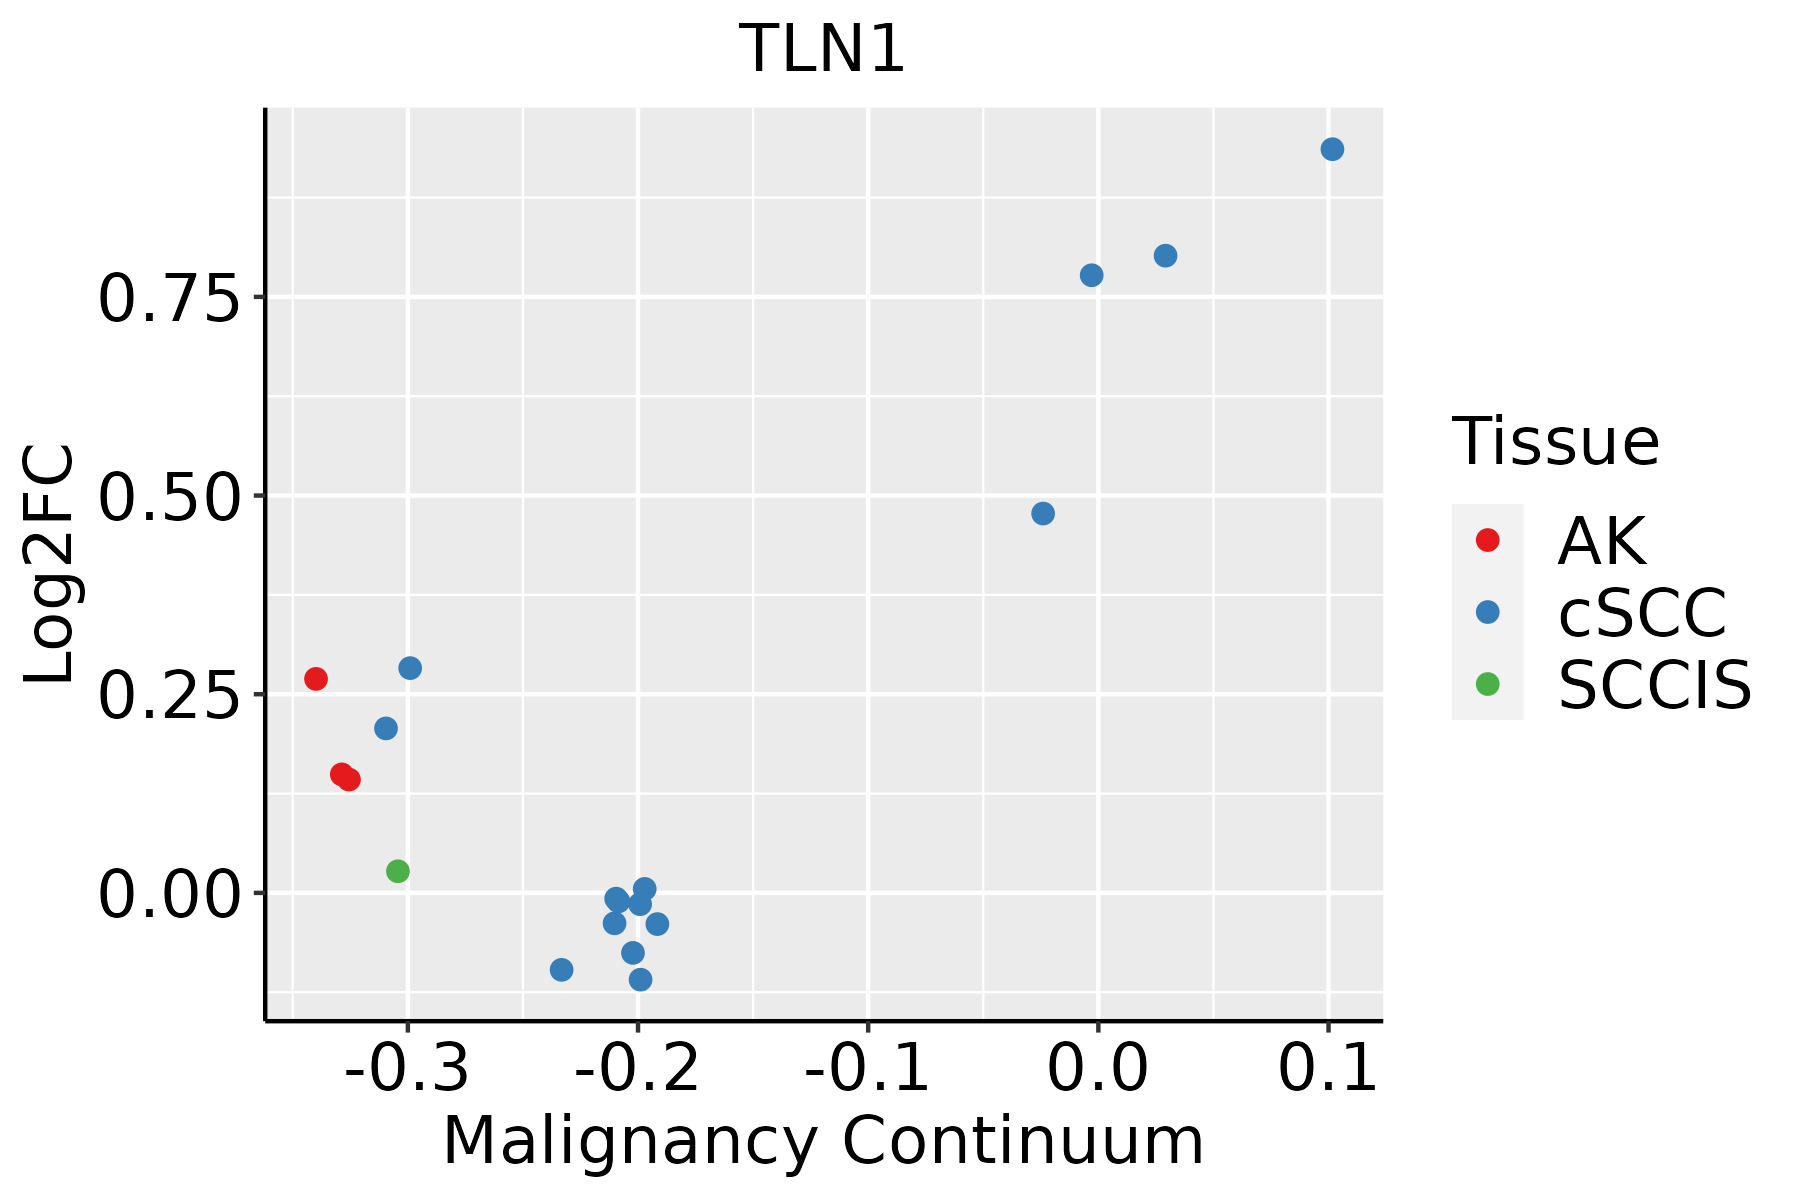 | AK: Actinic keratosis |
| cSCC: Cutaneous squamous cell carcinoma | ||
| SCCIS:squamous cell carcinoma in situ | ||
| Thyroid | 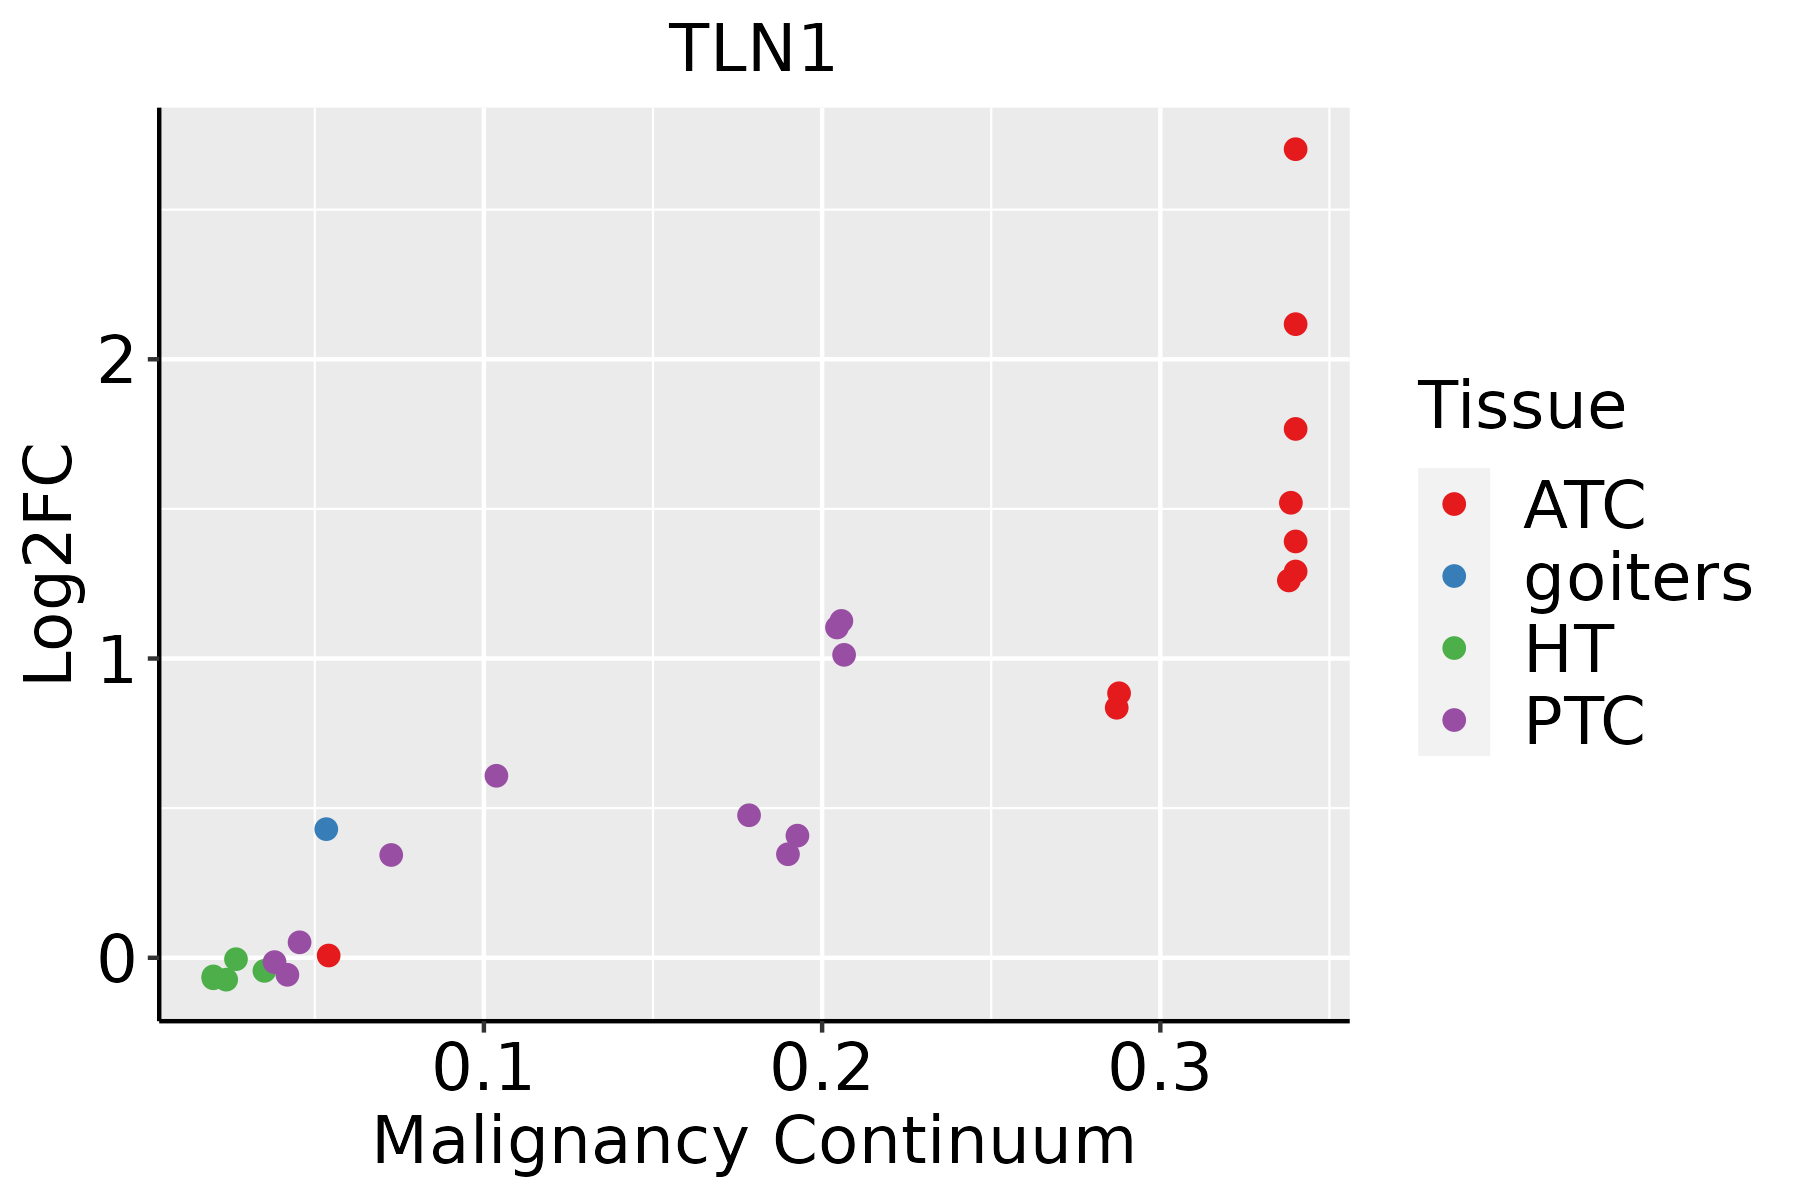 | ATC: Anaplastic thyroid cancer |
| HT: Hashimoto's thyroiditis | ||
| PTC: Papillary thyroid cancer |
| ∗log2FC in expression of this searched gene in stem-like cells from each diseased tissue sample relative to stem-like cells in normal samples in each tissue plotted against the malignancy continuum. Samples are colored based on if they are from different disease stage. |
Top |
Malignant transformation related pathway analysis |
| Find out the enriched GO biological processes and KEGG pathways involved in transition from healthy to precancer to cancer |
| Tissue | Disease Stage | Enriched GO biological Processes |
| Colorectum | AD |  |
| Colorectum | SER |  |
| Colorectum | MSS |  |
| Colorectum | MSI-H |  |
| Colorectum | FAP |  |
| ∗Top 15 enriched GO BP terms are showed in the bar plot of each disease state in each tissue. Each row represents a significant GO biological process which is colored according to the -log10(p.adjust). |
| Page: 1 2 3 4 5 6 7 8 9 |
| GO ID | Tissue | Disease Stage | Description | Gene Ratio | Bg Ratio | pvalue | p.adjust | Count |
| GO:004206010 | Cervix | CC | wound healing | 109/2311 | 422/18723 | 1.84e-14 | 1.57e-11 | 109 |
| GO:01501159 | Cervix | CC | cell-substrate junction organization | 37/2311 | 101/18723 | 3.20e-10 | 4.46e-08 | 37 |
| GO:00070448 | Cervix | CC | cell-substrate junction assembly | 34/2311 | 95/18723 | 3.35e-09 | 3.45e-07 | 34 |
| GO:00452169 | Cervix | CC | cell-cell junction organization | 53/2311 | 200/18723 | 3.83e-08 | 2.53e-06 | 53 |
| GO:00072295 | Cervix | CC | integrin-mediated signaling pathway | 34/2311 | 107/18723 | 1.01e-07 | 5.25e-06 | 34 |
| GO:00343298 | Cervix | CC | cell junction assembly | 88/2311 | 420/18723 | 3.42e-07 | 1.38e-05 | 88 |
| GO:00070439 | Cervix | CC | cell-cell junction assembly | 39/2311 | 146/18723 | 1.86e-06 | 5.94e-05 | 39 |
| GO:005087810 | Cervix | CC | regulation of body fluid levels | 78/2311 | 379/18723 | 3.20e-06 | 8.77e-05 | 78 |
| GO:003410910 | Cervix | CC | homotypic cell-cell adhesion | 26/2311 | 90/18723 | 2.12e-05 | 3.82e-04 | 26 |
| GO:00308657 | Cervix | CC | cortical cytoskeleton organization | 19/2311 | 61/18723 | 8.72e-05 | 1.16e-03 | 19 |
| GO:00705279 | Cervix | CC | platelet aggregation | 19/2311 | 67/18723 | 3.42e-04 | 3.58e-03 | 19 |
| GO:00508176 | Cervix | CC | coagulation | 45/2311 | 222/18723 | 5.08e-04 | 4.94e-03 | 45 |
| GO:00075966 | Cervix | CC | blood coagulation | 44/2311 | 217/18723 | 5.78e-04 | 5.52e-03 | 44 |
| GO:00301682 | Cervix | CC | platelet activation | 28/2311 | 123/18723 | 8.92e-04 | 7.71e-03 | 28 |
| GO:00075996 | Cervix | CC | hemostasis | 44/2311 | 222/18723 | 9.47e-04 | 7.95e-03 | 44 |
| GO:00308667 | Cervix | CC | cortical actin cytoskeleton organization | 12/2311 | 40/18723 | 2.44e-03 | 1.71e-02 | 12 |
| GO:000722913 | Cervix | HSIL_HPV | integrin-mediated signaling pathway | 19/737 | 107/18723 | 3.37e-08 | 2.76e-06 | 19 |
| GO:004206015 | Cervix | HSIL_HPV | wound healing | 40/737 | 422/18723 | 2.80e-07 | 1.61e-05 | 40 |
| GO:005087814 | Cervix | HSIL_HPV | regulation of body fluid levels | 37/737 | 379/18723 | 3.81e-07 | 2.06e-05 | 37 |
| GO:004521614 | Cervix | HSIL_HPV | cell-cell junction organization | 23/737 | 200/18723 | 4.21e-06 | 1.69e-04 | 23 |
| Page: 1 2 3 4 5 6 7 8 9 10 11 12 |
| Pathway ID | Tissue | Disease Stage | Description | Gene Ratio | Bg Ratio | pvalue | p.adjust | qvalue | Count |
| hsa0513120 | Cervix | CC | Shigellosis | 69/1267 | 247/8465 | 7.64e-08 | 1.03e-06 | 6.10e-07 | 69 |
| hsa0451010 | Cervix | CC | Focal adhesion | 59/1267 | 203/8465 | 1.53e-07 | 1.84e-06 | 1.09e-06 | 59 |
| hsa0516620 | Cervix | CC | Human T-cell leukemia virus 1 infection | 61/1267 | 222/8465 | 8.13e-07 | 7.98e-06 | 4.72e-06 | 61 |
| hsa0401512 | Cervix | CC | Rap1 signaling pathway | 56/1267 | 210/8465 | 6.23e-06 | 5.61e-05 | 3.32e-05 | 56 |
| hsa046115 | Cervix | CC | Platelet activation | 28/1267 | 124/8465 | 1.50e-02 | 4.45e-02 | 2.63e-02 | 28 |
| hsa05131110 | Cervix | CC | Shigellosis | 69/1267 | 247/8465 | 7.64e-08 | 1.03e-06 | 6.10e-07 | 69 |
| hsa0451014 | Cervix | CC | Focal adhesion | 59/1267 | 203/8465 | 1.53e-07 | 1.84e-06 | 1.09e-06 | 59 |
| hsa05166110 | Cervix | CC | Human T-cell leukemia virus 1 infection | 61/1267 | 222/8465 | 8.13e-07 | 7.98e-06 | 4.72e-06 | 61 |
| hsa0401513 | Cervix | CC | Rap1 signaling pathway | 56/1267 | 210/8465 | 6.23e-06 | 5.61e-05 | 3.32e-05 | 56 |
| hsa0461113 | Cervix | CC | Platelet activation | 28/1267 | 124/8465 | 1.50e-02 | 4.45e-02 | 2.63e-02 | 28 |
| hsa0513125 | Cervix | HSIL_HPV | Shigellosis | 27/459 | 247/8465 | 3.78e-04 | 3.49e-03 | 2.82e-03 | 27 |
| hsa0516625 | Cervix | HSIL_HPV | Human T-cell leukemia virus 1 infection | 25/459 | 222/8465 | 3.95e-04 | 3.49e-03 | 2.82e-03 | 25 |
| hsa0451023 | Cervix | HSIL_HPV | Focal adhesion | 21/459 | 203/8465 | 3.24e-03 | 2.02e-02 | 1.63e-02 | 21 |
| hsa0513135 | Cervix | HSIL_HPV | Shigellosis | 27/459 | 247/8465 | 3.78e-04 | 3.49e-03 | 2.82e-03 | 27 |
| hsa0516635 | Cervix | HSIL_HPV | Human T-cell leukemia virus 1 infection | 25/459 | 222/8465 | 3.95e-04 | 3.49e-03 | 2.82e-03 | 25 |
| hsa0451033 | Cervix | HSIL_HPV | Focal adhesion | 21/459 | 203/8465 | 3.24e-03 | 2.02e-02 | 1.63e-02 | 21 |
| hsa05131 | Colorectum | AD | Shigellosis | 109/2092 | 247/8465 | 1.09e-11 | 2.44e-10 | 1.55e-10 | 109 |
| hsa04015 | Colorectum | AD | Rap1 signaling pathway | 71/2092 | 210/8465 | 1.72e-03 | 9.68e-03 | 6.18e-03 | 71 |
| hsa04510 | Colorectum | AD | Focal adhesion | 67/2092 | 203/8465 | 4.40e-03 | 2.17e-02 | 1.38e-02 | 67 |
| hsa05166 | Colorectum | AD | Human T-cell leukemia virus 1 infection | 72/2092 | 222/8465 | 5.24e-03 | 2.44e-02 | 1.55e-02 | 72 |
| Page: 1 2 3 4 5 |
Top |
Cell-cell communication analysis |
| Identification of potential cell-cell interactions between two cell types and their ligand-receptor pairs for different disease states |
| Ligand | Receptor | LRpair | Pathway | Tissue | Disease Stage |
| Page: 1 |
Top |
Single-cell gene regulatory network inference analysis |
| Find out the significant the regulons (TFs) and the target genes of each regulon across cell types for different disease states |
| TF | Cell Type | Tissue | Disease Stage | Target Gene | RSS | Regulon Activity |
| ∗The dot plots of a searched regulon are shown for all cell subpopulations in each disease state of each tissue based on the regulon specific score inferred using pySCENIC and by calculating the average expression. |
| Page: 1 |
Top |
Somatic mutation of malignant transformation related genes |
| Annotation of somatic variants for genes involved in malignant transformation |
| Hugo Symbol | Variant Class | Variant Classification | dbSNP RS | HGVSc | HGVSp | HGVSp Short | SWISSPROT | BIOTYPE | SIFT | PolyPhen | Tumor Sample Barcode | Tissue | Histology | Sex | Age | Stage | Therapy Types | Drugs | Outcome |
| TLN1 | SNV | Missense_Mutation | novel | c.471G>C | p.Lys157Asn | p.K157N | Q9Y490 | protein_coding | deleterious(0) | probably_damaging(0.996) | TCGA-5L-AAT0-01 | Breast | breast invasive carcinoma | Female | <65 | I/II | Hormone Therapy | tamoxiphen | SD |
| TLN1 | SNV | Missense_Mutation | c.923N>G | p.Tyr308Cys | p.Y308C | Q9Y490 | protein_coding | deleterious(0) | probably_damaging(0.999) | TCGA-A2-A04W-01 | Breast | breast invasive carcinoma | Female | <65 | I/II | Chemotherapy | cytoxan | SD | |
| TLN1 | SNV | Missense_Mutation | rs770655381 | c.3721C>T | p.Arg1241Trp | p.R1241W | Q9Y490 | protein_coding | deleterious(0) | benign(0.289) | TCGA-A2-A0ET-01 | Breast | breast invasive carcinoma | Female | <65 | III/IV | Chemotherapy | cytoxan | SD |
| TLN1 | SNV | Missense_Mutation | novel | c.1981G>A | p.Asp661Asn | p.D661N | Q9Y490 | protein_coding | tolerated(0.34) | benign(0.017) | TCGA-A2-A0YK-01 | Breast | breast invasive carcinoma | Female | <65 | I/II | Chemotherapy | cytoxan | SD |
| TLN1 | SNV | Missense_Mutation | c.1437G>C | p.Gln479His | p.Q479H | Q9Y490 | protein_coding | deleterious(0) | benign(0.087) | TCGA-A8-A06Q-01 | Breast | breast invasive carcinoma | Female | <65 | III/IV | Unknown | Unknown | SD | |
| TLN1 | SNV | Missense_Mutation | c.310N>A | p.Asp104Asn | p.D104N | Q9Y490 | protein_coding | deleterious(0) | probably_damaging(0.987) | TCGA-A8-A08R-01 | Breast | breast invasive carcinoma | Female | <65 | I/II | Unknown | Unknown | SD | |
| TLN1 | SNV | Missense_Mutation | c.480N>T | p.Lys160Asn | p.K160N | Q9Y490 | protein_coding | deleterious(0.03) | possibly_damaging(0.484) | TCGA-A8-A09E-01 | Breast | breast invasive carcinoma | Female | >=65 | III/IV | Hormone Therapy | anastrozole | SD | |
| TLN1 | SNV | Missense_Mutation | c.887N>C | p.Val296Ala | p.V296A | Q9Y490 | protein_coding | tolerated(0.09) | benign(0.151) | TCGA-A8-A09Q-01 | Breast | breast invasive carcinoma | Female | >=65 | III/IV | Hormone Therapy | anastrozole | SD | |
| TLN1 | SNV | Missense_Mutation | c.3268G>A | p.Asp1090Asn | p.D1090N | Q9Y490 | protein_coding | tolerated(0.05) | benign(0.025) | TCGA-AC-A23C-01 | Breast | breast invasive carcinoma | Female | <65 | I/II | Chemotherapy | chemo | CR | |
| TLN1 | SNV | Missense_Mutation | c.2862N>C | p.Gln954His | p.Q954H | Q9Y490 | protein_coding | tolerated(0.24) | benign(0.005) | TCGA-AC-A23H-01 | Breast | breast invasive carcinoma | Female | >=65 | I/II | Unknown | Unknown | PD |
| Page: 1 2 3 4 5 6 7 8 9 10 11 12 13 14 15 16 17 18 19 20 21 22 23 24 |
Top |
Related drugs of malignant transformation related genes |
| Identification of chemicals and drugs interact with genes involved in malignant transfromation |
| (DGIdb 4.0) |
| Entrez ID | Symbol | Category | Interaction Types | Drug Claim Name | Drug Name | PMIDs |
| Page: 1 |

Copyright 2023-Present -The University of Texas Health Science Center at Houston |