| Tissue | Expression Dynamics | Abbreviation |
| Cervix | 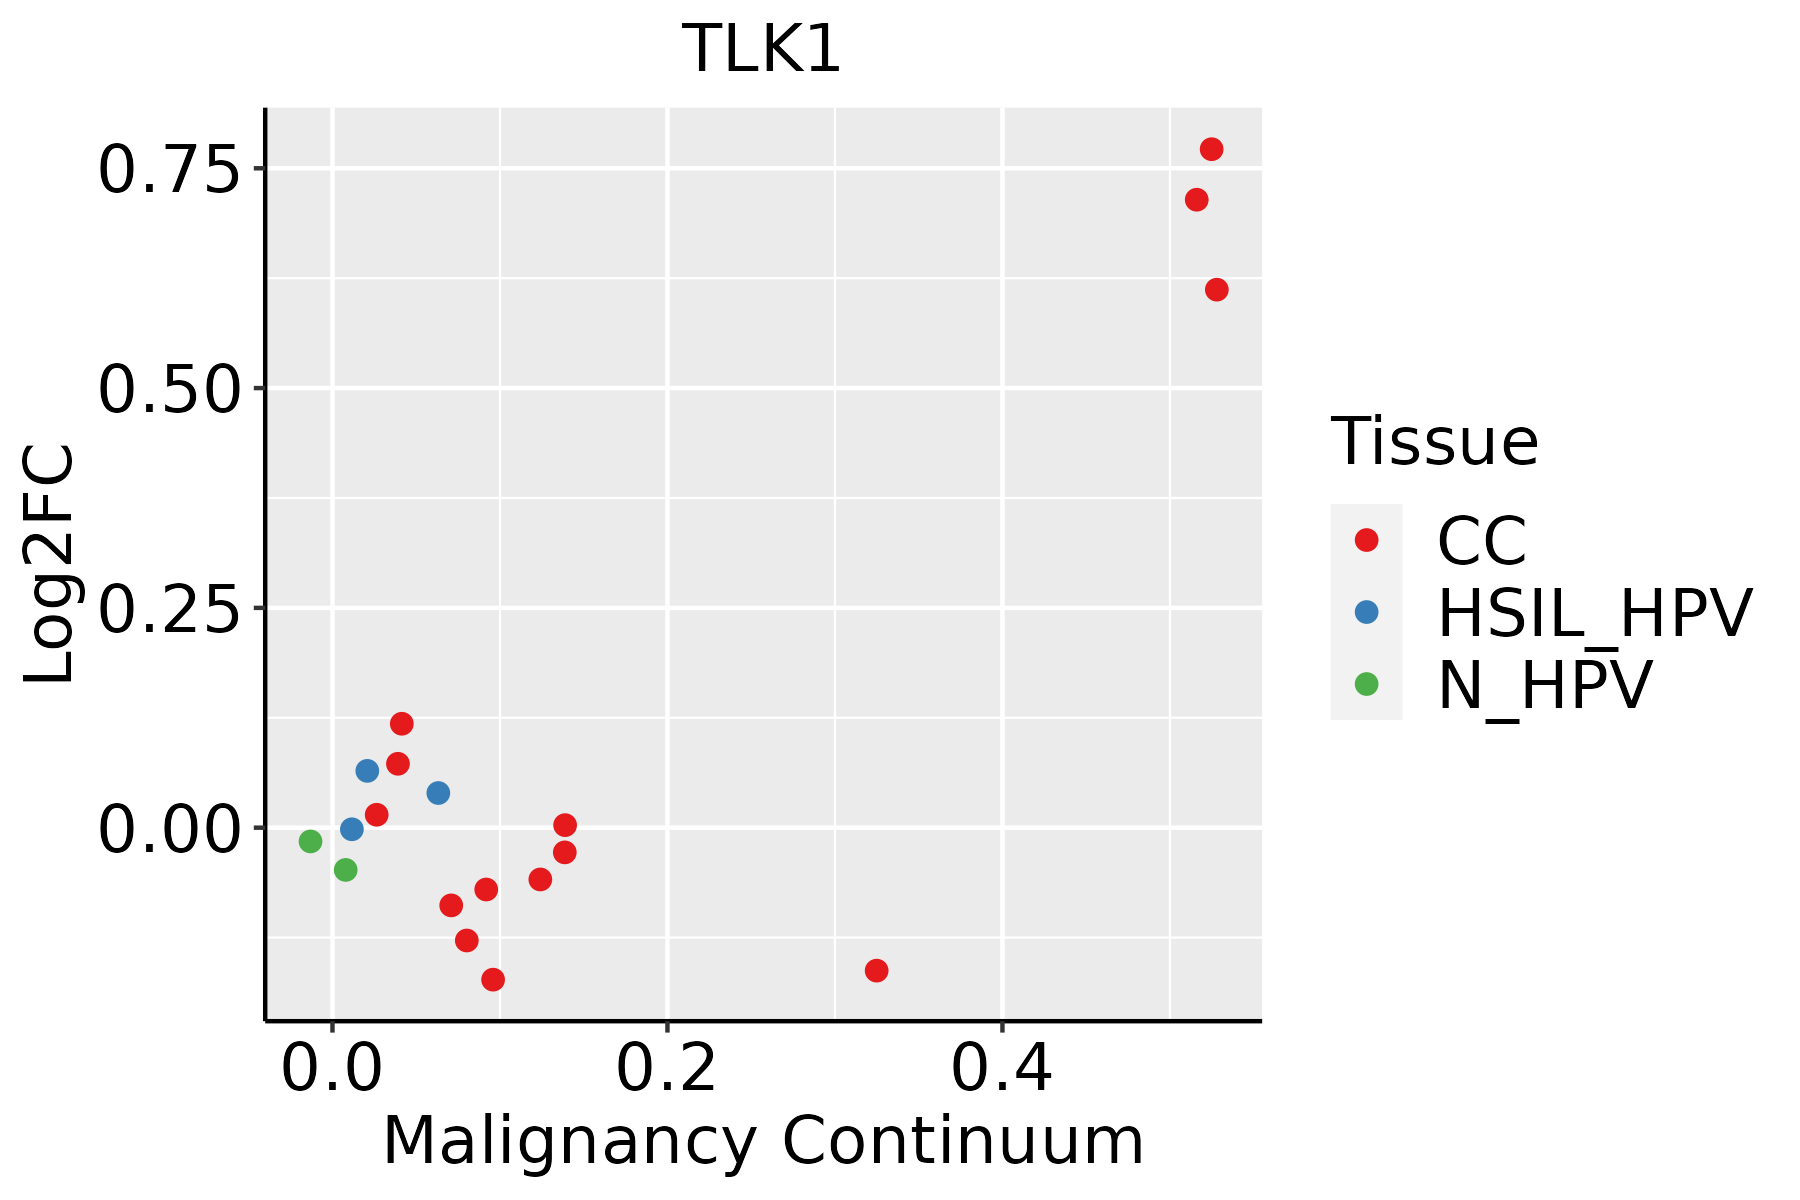 | CC: Cervix cancer |
| HSIL_HPV: HPV-infected high-grade squamous intraepithelial lesions |
| N_HPV: HPV-infected normal cervix |
| Colorectum (GSE201348) |  | FAP: Familial adenomatous polyposis |
| CRC: Colorectal cancer |
| Colorectum (HTA11) |  | AD: Adenomas |
| SER: Sessile serrated lesions |
| MSI-H: Microsatellite-high colorectal cancer |
| MSS: Microsatellite stable colorectal cancer |
| Esophagus | 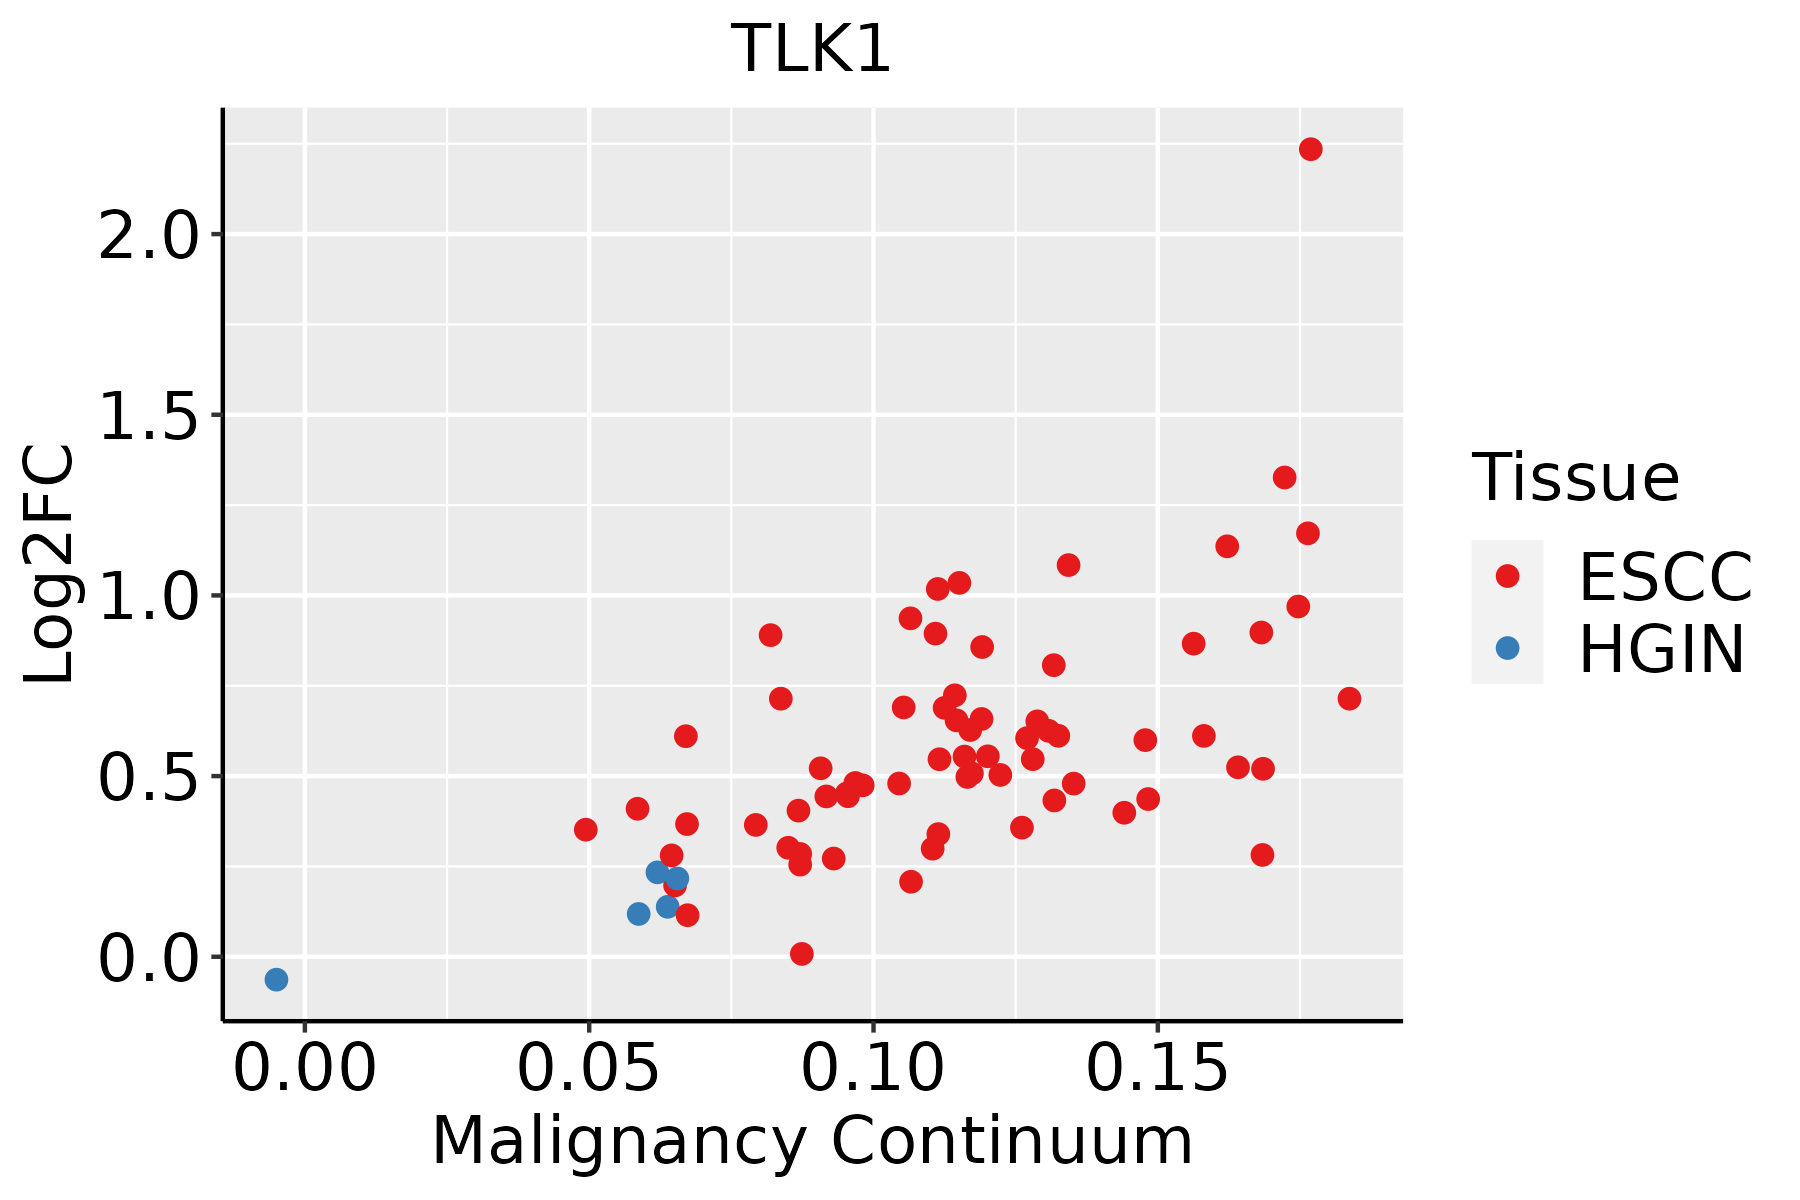 | ESCC: Esophageal squamous cell carcinoma |
| HGIN: High-grade intraepithelial neoplasias |
| LGIN: Low-grade intraepithelial neoplasias |
| Liver | 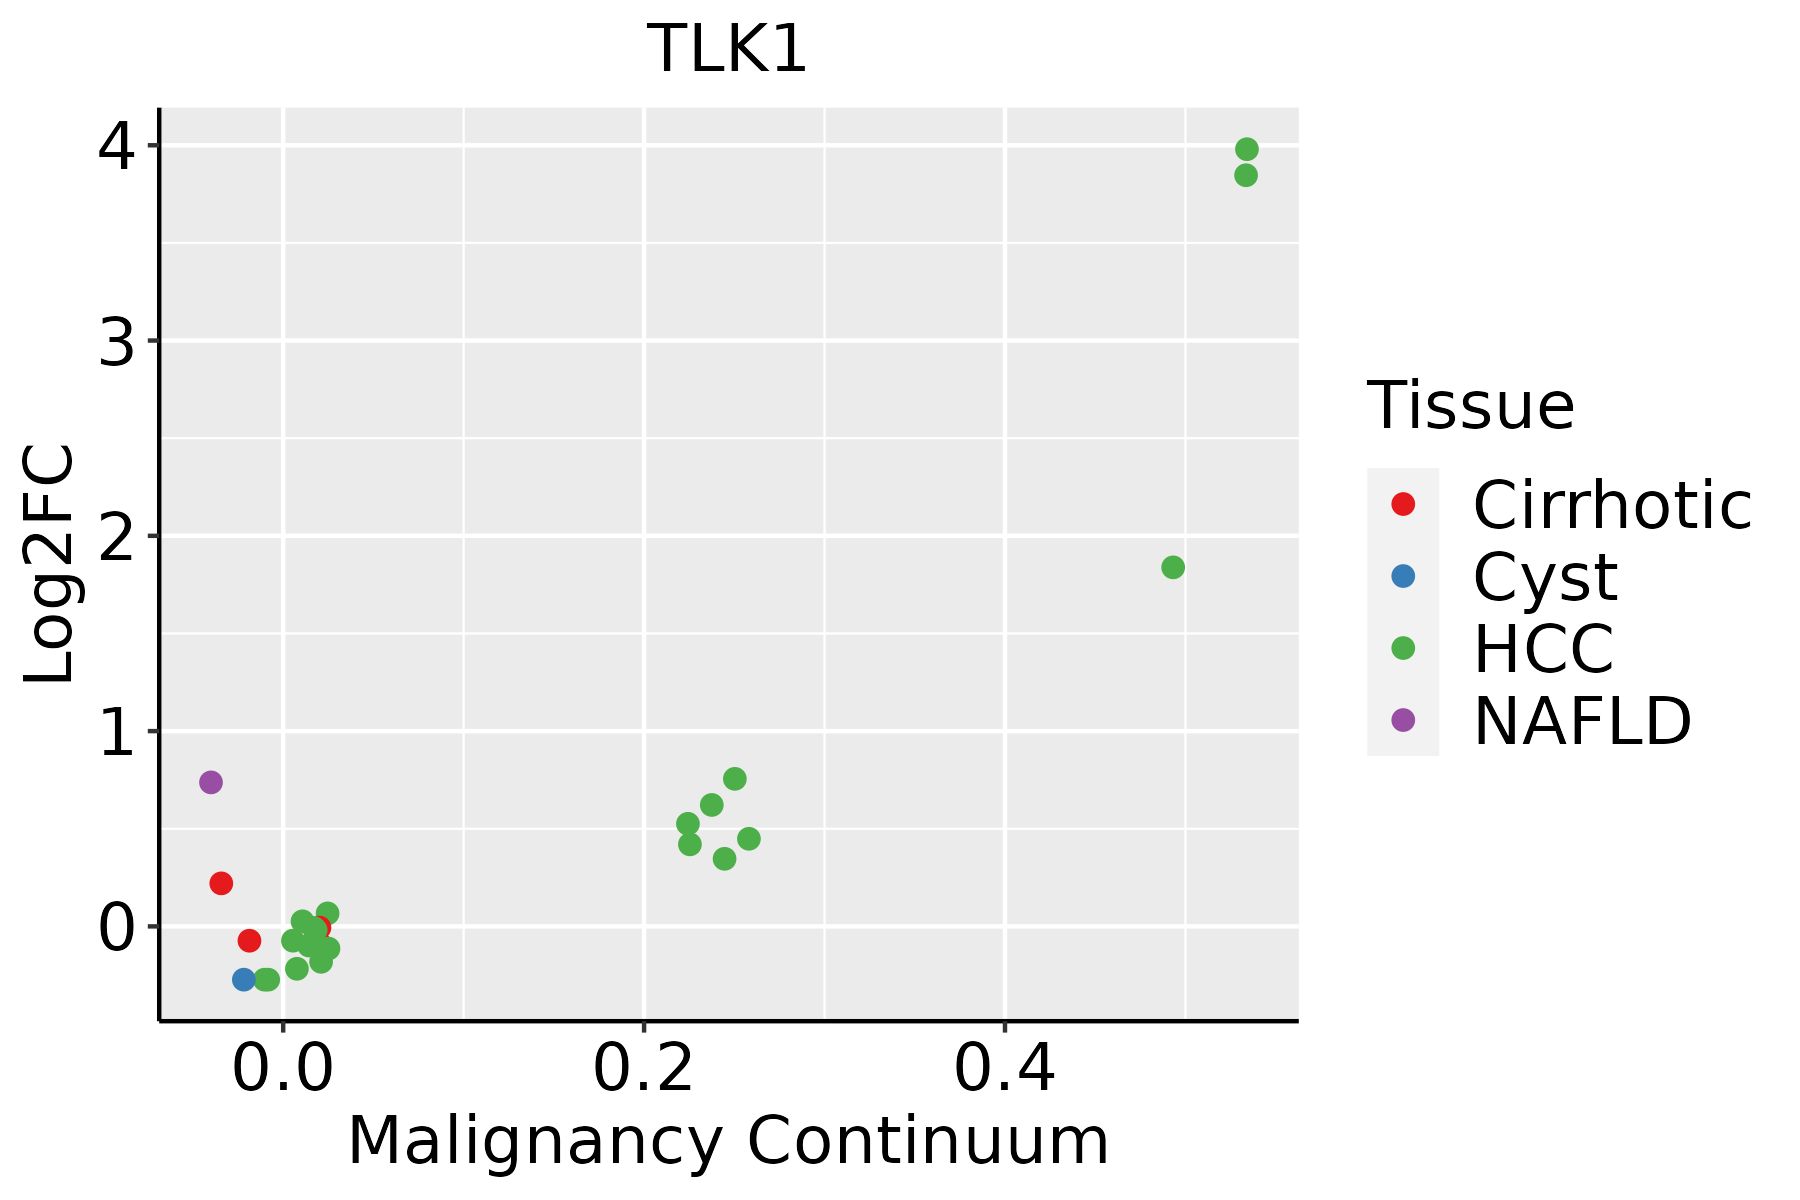 | HCC: Hepatocellular carcinoma |
| NAFLD: Non-alcoholic fatty liver disease |
| Lung |  | AAH: Atypical adenomatous hyperplasia |
| AIS: Adenocarcinoma in situ |
| IAC: Invasive lung adenocarcinoma |
| MIA: Minimally invasive adenocarcinoma |
| Oral Cavity |  | EOLP: Erosive Oral lichen planus |
| LP: leukoplakia |
| NEOLP: Non-erosive oral lichen planus |
| OSCC: Oral squamous cell carcinoma |
| Prostate |  | BPH: Benign Prostatic Hyperplasia |
| Skin | 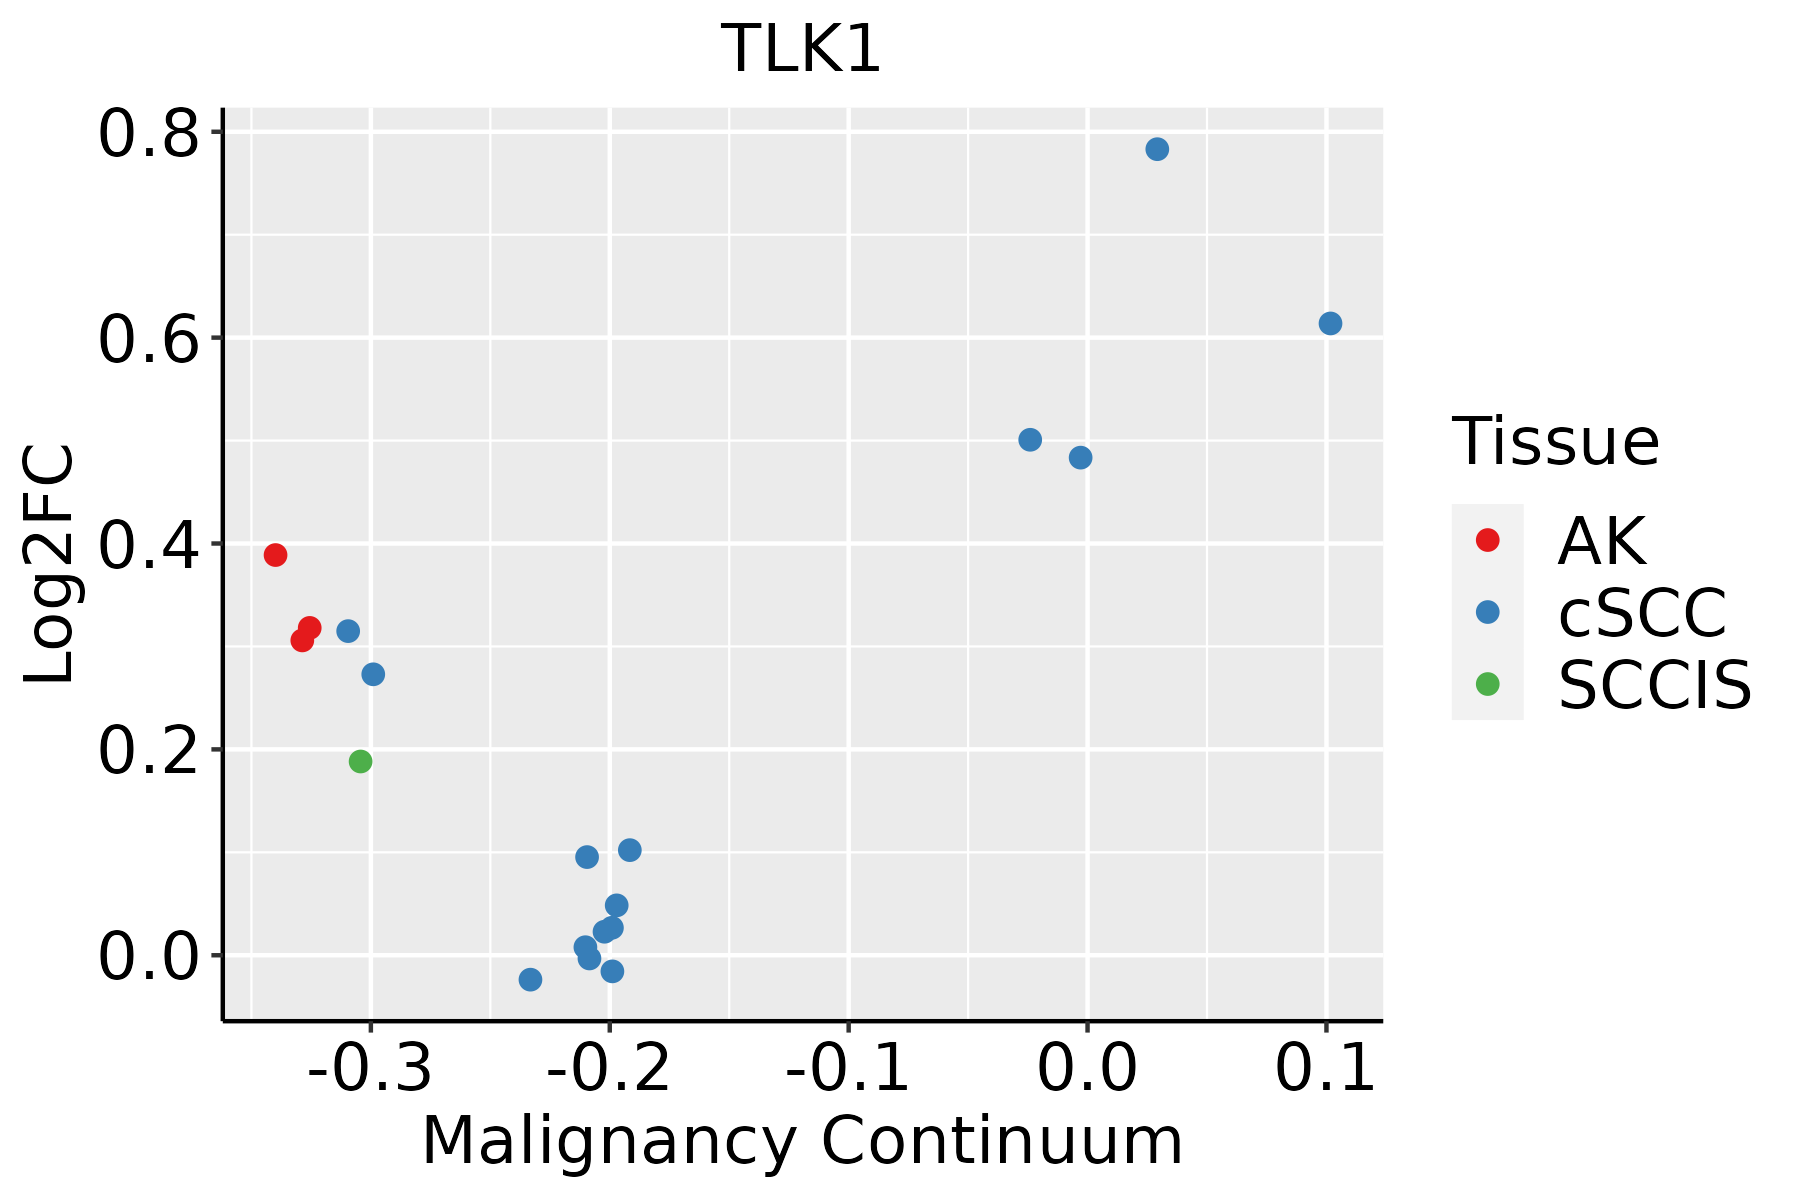 | AK: Actinic keratosis |
| cSCC: Cutaneous squamous cell carcinoma |
| SCCIS:squamous cell carcinoma in situ |
| Thyroid |  | ATC: Anaplastic thyroid cancer |
| HT: Hashimoto's thyroiditis |
| PTC: Papillary thyroid cancer |
| GO ID | Tissue | Disease Stage | Description | Gene Ratio | Bg Ratio | pvalue | p.adjust | Count |
| GO:00063257 | Cervix | CC | chromatin organization | 78/2311 | 409/18723 | 5.40e-05 | 8.02e-04 | 78 |
| GO:00181057 | Cervix | CC | peptidyl-serine phosphorylation | 63/2311 | 315/18723 | 6.65e-05 | 9.47e-04 | 63 |
| GO:00182096 | Cervix | CC | peptidyl-serine modification | 66/2311 | 338/18723 | 9.58e-05 | 1.25e-03 | 66 |
| GO:0006325 | Colorectum | AD | chromatin organization | 119/3918 | 409/18723 | 4.85e-05 | 8.33e-04 | 119 |
| GO:0018105 | Colorectum | AD | peptidyl-serine phosphorylation | 88/3918 | 315/18723 | 1.73e-03 | 1.43e-02 | 88 |
| GO:0018209 | Colorectum | AD | peptidyl-serine modification | 92/3918 | 338/18723 | 3.19e-03 | 2.36e-02 | 92 |
| GO:00063251 | Colorectum | SER | chromatin organization | 89/2897 | 409/18723 | 4.15e-04 | 6.17e-03 | 89 |
| GO:00181051 | Colorectum | SER | peptidyl-serine phosphorylation | 66/2897 | 315/18723 | 5.47e-03 | 4.06e-02 | 66 |
| GO:00063252 | Colorectum | MSS | chromatin organization | 107/3467 | 409/18723 | 7.22e-05 | 1.21e-03 | 107 |
| GO:00181052 | Colorectum | MSS | peptidyl-serine phosphorylation | 81/3467 | 315/18723 | 8.92e-04 | 9.12e-03 | 81 |
| GO:00182091 | Colorectum | MSS | peptidyl-serine modification | 84/3467 | 338/18723 | 2.12e-03 | 1.79e-02 | 84 |
| GO:00181053 | Colorectum | FAP | peptidyl-serine phosphorylation | 71/2622 | 315/18723 | 2.51e-05 | 5.82e-04 | 71 |
| GO:00182092 | Colorectum | FAP | peptidyl-serine modification | 73/2622 | 338/18723 | 8.47e-05 | 1.51e-03 | 73 |
| GO:00063253 | Colorectum | FAP | chromatin organization | 84/2622 | 409/18723 | 1.62e-04 | 2.47e-03 | 84 |
| GO:00181054 | Colorectum | CRC | peptidyl-serine phosphorylation | 61/2078 | 315/18723 | 9.88e-06 | 3.31e-04 | 61 |
| GO:00063254 | Colorectum | CRC | chromatin organization | 74/2078 | 409/18723 | 1.48e-05 | 4.61e-04 | 74 |
| GO:00182093 | Colorectum | CRC | peptidyl-serine modification | 62/2078 | 338/18723 | 4.67e-05 | 1.10e-03 | 62 |
| GO:000705911 | Esophagus | ESCC | chromosome segregation | 238/8552 | 346/18723 | 1.72e-18 | 1.82e-16 | 238 |
| GO:000632517 | Esophagus | ESCC | chromatin organization | 240/8552 | 409/18723 | 6.52e-08 | 1.14e-06 | 240 |
| GO:00182099 | Esophagus | ESCC | peptidyl-serine modification | 196/8552 | 338/18723 | 3.07e-06 | 3.47e-05 | 196 |
| Hugo Symbol | Variant Class | Variant Classification | dbSNP RS | HGVSc | HGVSp | HGVSp Short | SWISSPROT | BIOTYPE | SIFT | PolyPhen | Tumor Sample Barcode | Tissue | Histology | Sex | Age | Stage | Therapy Types | Drugs | Outcome |
| TLK1 | SNV | Missense_Mutation | | c.1331C>T | p.Ser444Leu | p.S444L | Q9UKI8 | protein_coding | deleterious(0.01) | possibly_damaging(0.83) | TCGA-A2-A0EQ-01 | Breast | breast invasive carcinoma | Female | <65 | I/II | Chemotherapy | adriamycin | SD |
| TLK1 | SNV | Missense_Mutation | | c.181N>A | p.Glu61Lys | p.E61K | Q9UKI8 | protein_coding | deleterious_low_confidence(0) | benign(0.125) | TCGA-AC-A23H-01 | Breast | breast invasive carcinoma | Female | >=65 | I/II | Unknown | Unknown | PD |
| TLK1 | SNV | Missense_Mutation | novel | c.791N>C | p.Lys264Thr | p.K264T | Q9UKI8 | protein_coding | deleterious(0.02) | probably_damaging(0.998) | TCGA-AN-A046-01 | Breast | breast invasive carcinoma | Female | >=65 | I/II | Unknown | Unknown | SD |
| TLK1 | SNV | Missense_Mutation | | c.274N>A | p.Glu92Lys | p.E92K | Q9UKI8 | protein_coding | deleterious(0.02) | probably_damaging(0.995) | TCGA-AN-A046-01 | Breast | breast invasive carcinoma | Female | >=65 | I/II | Unknown | Unknown | SD |
| TLK1 | SNV | Missense_Mutation | novel | c.1285A>C | p.Asn429His | p.N429H | Q9UKI8 | protein_coding | deleterious(0) | possibly_damaging(0.883) | TCGA-D8-A3Z5-01 | Breast | breast invasive carcinoma | Female | <65 | III/IV | Unknown | Unknown | SD |
| TLK1 | SNV | Missense_Mutation | novel | c.1619A>T | p.Tyr540Phe | p.Y540F | Q9UKI8 | protein_coding | tolerated(0.11) | benign(0.084) | TCGA-2W-A8YY-01 | Cervix | cervical & endocervical cancer | Female | <65 | I/II | Chemotherapy | cisplatin | CR |
| TLK1 | SNV | Missense_Mutation | | c.274N>A | p.Glu92Lys | p.E92K | Q9UKI8 | protein_coding | deleterious(0.02) | probably_damaging(0.995) | TCGA-EA-A410-01 | Cervix | cervical & endocervical cancer | Female | <65 | I/II | Unknown | Unknown | SD |
| TLK1 | SNV | Missense_Mutation | | c.817A>C | p.Met273Leu | p.M273L | Q9UKI8 | protein_coding | tolerated(0.15) | probably_damaging(0.925) | TCGA-EA-A411-01 | Cervix | cervical & endocervical cancer | Female | <65 | I/II | Unknown | Unknown | SD |
| TLK1 | SNV | Missense_Mutation | | c.2191N>T | p.Asp731Tyr | p.D731Y | Q9UKI8 | protein_coding | deleterious(0) | probably_damaging(1) | TCGA-EK-A2RJ-01 | Cervix | cervical & endocervical cancer | Female | <65 | I/II | Unknown | Unknown | SD |
| TLK1 | SNV | Missense_Mutation | novel | c.1009G>A | p.Glu337Lys | p.E337K | Q9UKI8 | protein_coding | tolerated(0.07) | probably_damaging(0.995) | TCGA-HM-A4S6-01 | Cervix | cervical & endocervical cancer | Female | <65 | III/IV | Chemotherapy | cisplatin | CR |


