
|
|||||
|
 | |
| |
| |
| |
| |
| |
|
Gene: TLE3 |
Gene summary for TLE3 |
| Gene information | Species | Human | Gene symbol | TLE3 | Gene ID | 7090 |
| Gene name | TLE family member 3, transcriptional corepressor | |
| Gene Alias | ESG | |
| Cytomap | 15q23 | |
| Gene Type | protein-coding | GO ID | GO:0001659 | UniProtAcc | Q04726 |
Top |
Malignant transformation analysis |
| Identification of the aberrant gene expression in precancerous and cancerous lesions by comparing the gene expression of stem-like cells in diseased tissues with normal stem cells |
| Entrez ID | Symbol | Replicates | Species | Organ | Tissue | Adj P-value | Log2FC | Malignancy |
| 7090 | TLE3 | LZE2T | Human | Esophagus | ESCC | 4.43e-02 | 1.92e-01 | 0.082 |
| 7090 | TLE3 | LZE4T | Human | Esophagus | ESCC | 3.17e-03 | -4.09e-02 | 0.0811 |
| 7090 | TLE3 | LZE7T | Human | Esophagus | ESCC | 9.57e-08 | 1.44e-01 | 0.0667 |
| 7090 | TLE3 | LZE8T | Human | Esophagus | ESCC | 1.85e-03 | -4.52e-02 | 0.067 |
| 7090 | TLE3 | LZE20T | Human | Esophagus | ESCC | 7.41e-03 | -5.91e-02 | 0.0662 |
| 7090 | TLE3 | LZE22T | Human | Esophagus | ESCC | 2.73e-05 | 2.17e-01 | 0.068 |
| 7090 | TLE3 | LZE24T | Human | Esophagus | ESCC | 7.00e-12 | 2.83e-01 | 0.0596 |
| 7090 | TLE3 | LZE21T | Human | Esophagus | ESCC | 8.79e-06 | 2.46e-01 | 0.0655 |
| 7090 | TLE3 | LZE6T | Human | Esophagus | ESCC | 5.03e-03 | -3.54e-02 | 0.0845 |
| 7090 | TLE3 | P1T-E | Human | Esophagus | ESCC | 8.03e-08 | 7.32e-01 | 0.0875 |
| 7090 | TLE3 | P2T-E | Human | Esophagus | ESCC | 6.21e-32 | 6.18e-01 | 0.1177 |
| 7090 | TLE3 | P4T-E | Human | Esophagus | ESCC | 4.88e-15 | 3.26e-01 | 0.1323 |
| 7090 | TLE3 | P5T-E | Human | Esophagus | ESCC | 6.57e-11 | -5.48e-02 | 0.1327 |
| 7090 | TLE3 | P8T-E | Human | Esophagus | ESCC | 1.99e-27 | 5.49e-01 | 0.0889 |
| 7090 | TLE3 | P9T-E | Human | Esophagus | ESCC | 3.35e-06 | 2.23e-01 | 0.1131 |
| 7090 | TLE3 | P10T-E | Human | Esophagus | ESCC | 3.28e-28 | 5.32e-01 | 0.116 |
| 7090 | TLE3 | P12T-E | Human | Esophagus | ESCC | 2.20e-26 | 4.97e-01 | 0.1122 |
| 7090 | TLE3 | P15T-E | Human | Esophagus | ESCC | 2.02e-27 | 6.28e-01 | 0.1149 |
| 7090 | TLE3 | P16T-E | Human | Esophagus | ESCC | 9.09e-21 | 4.69e-01 | 0.1153 |
| 7090 | TLE3 | P17T-E | Human | Esophagus | ESCC | 1.35e-05 | 1.20e-01 | 0.1278 |
| Page: 1 2 3 4 5 |
| Tissue | Expression Dynamics | Abbreviation |
| Esophagus | 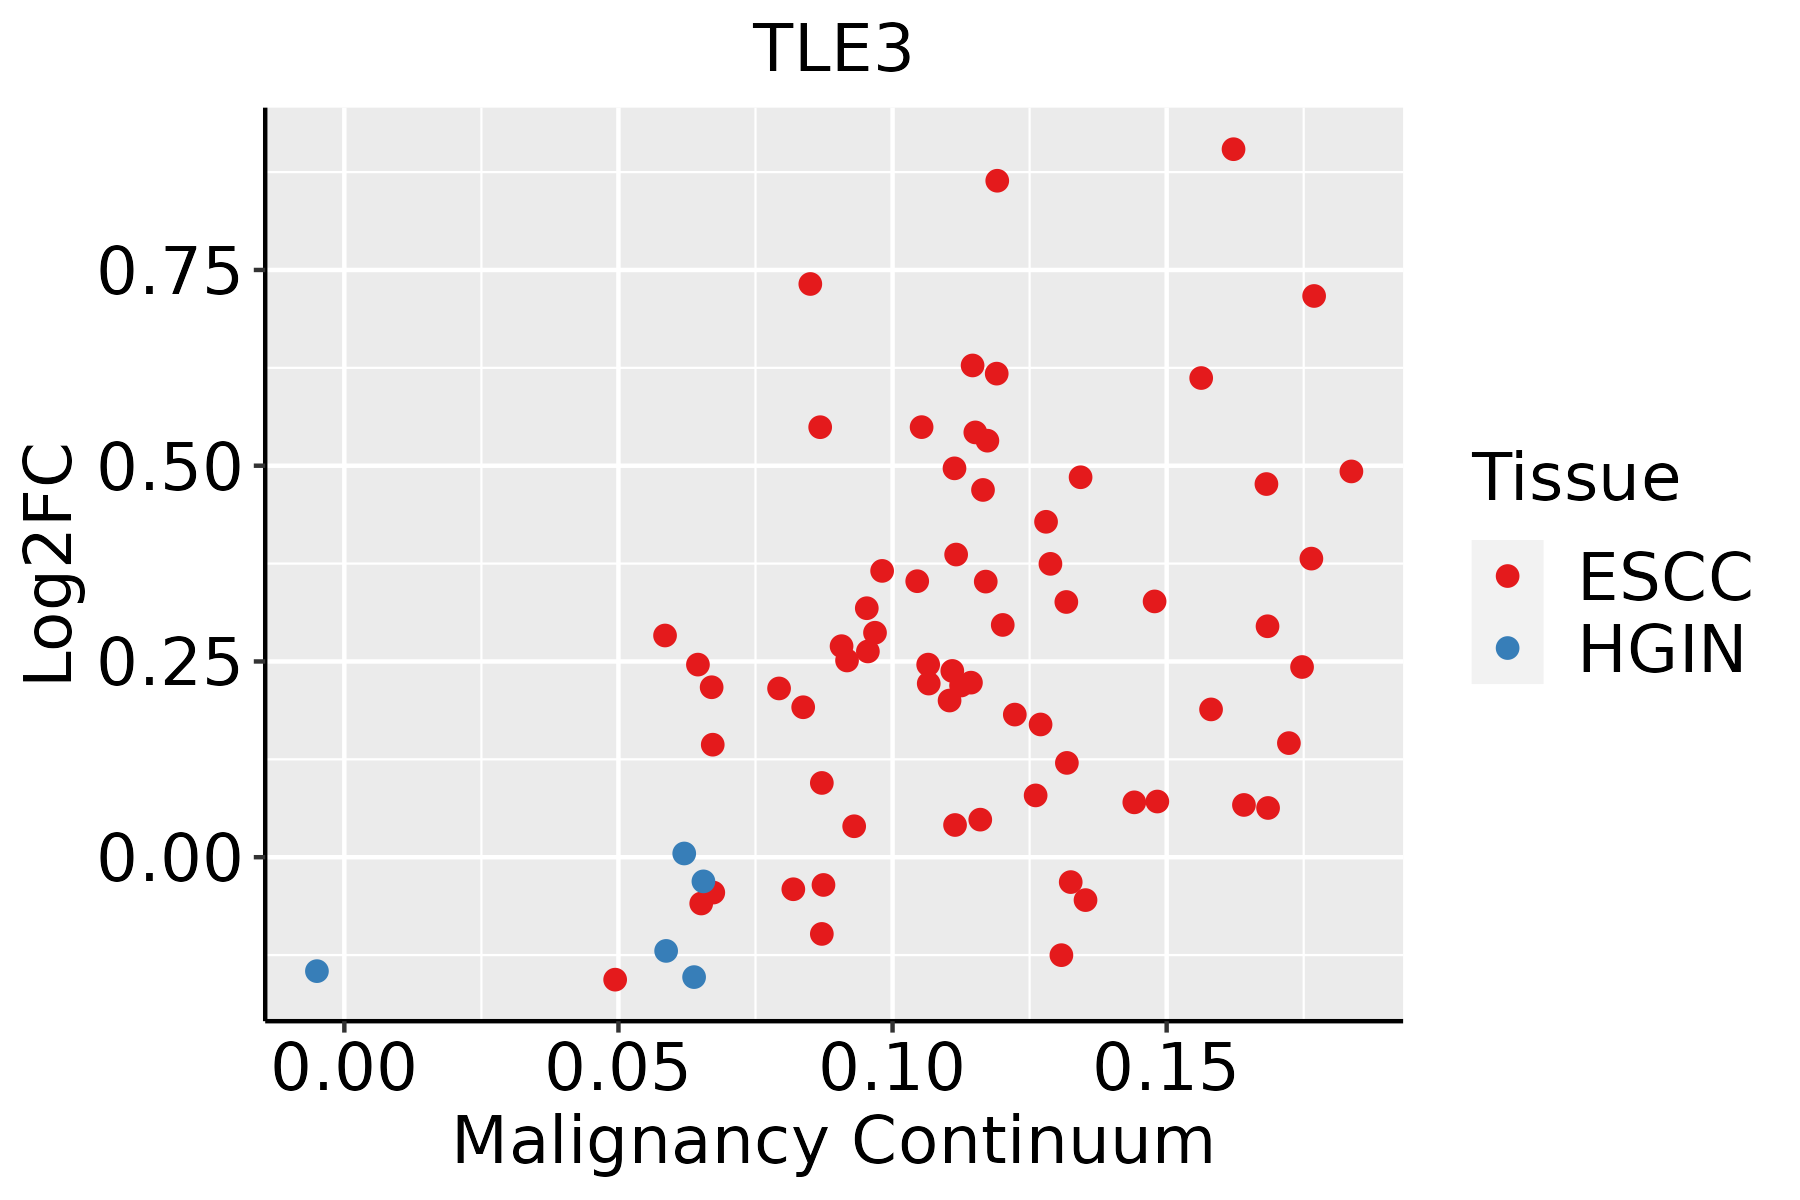 | ESCC: Esophageal squamous cell carcinoma |
| HGIN: High-grade intraepithelial neoplasias | ||
| LGIN: Low-grade intraepithelial neoplasias | ||
| Liver |  | HCC: Hepatocellular carcinoma |
| NAFLD: Non-alcoholic fatty liver disease | ||
| Oral Cavity | 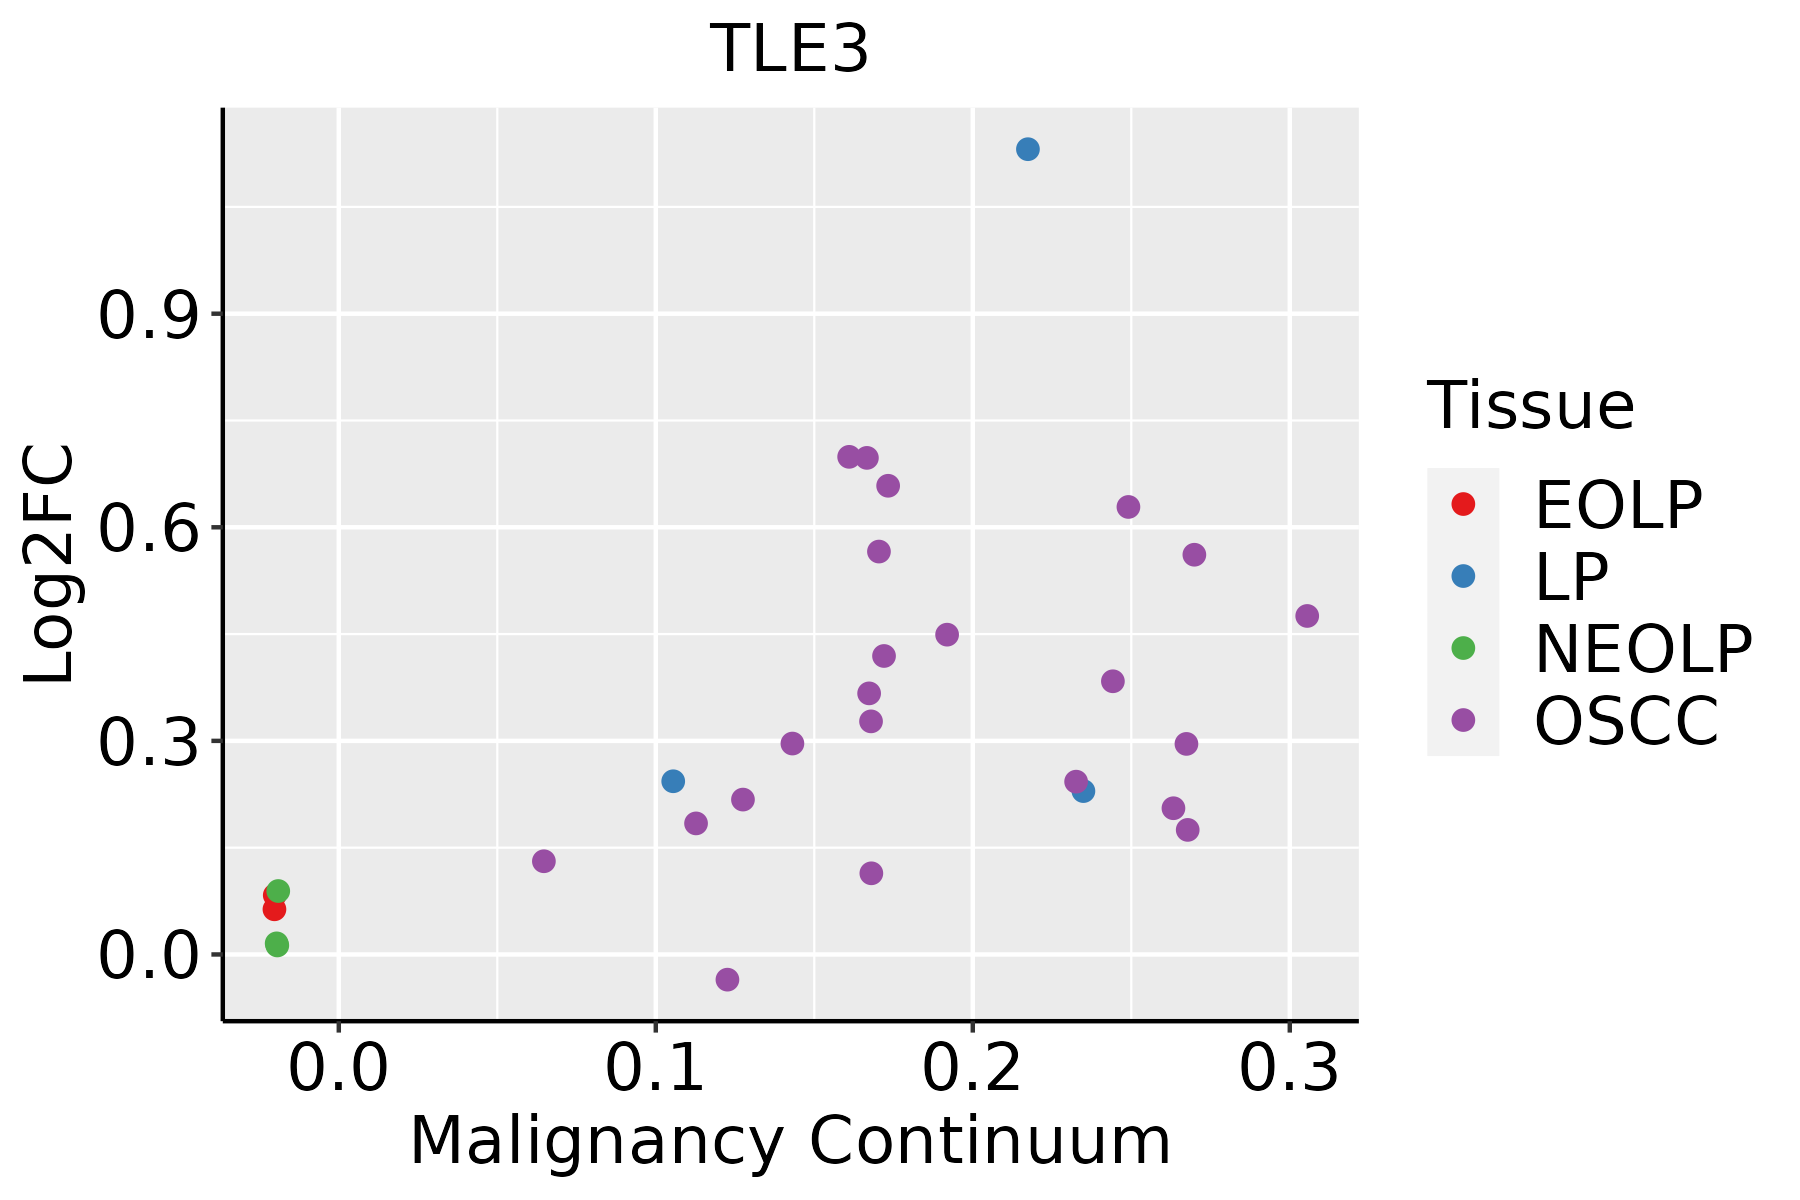 | EOLP: Erosive Oral lichen planus |
| LP: leukoplakia | ||
| NEOLP: Non-erosive oral lichen planus | ||
| OSCC: Oral squamous cell carcinoma | ||
| Prostate | 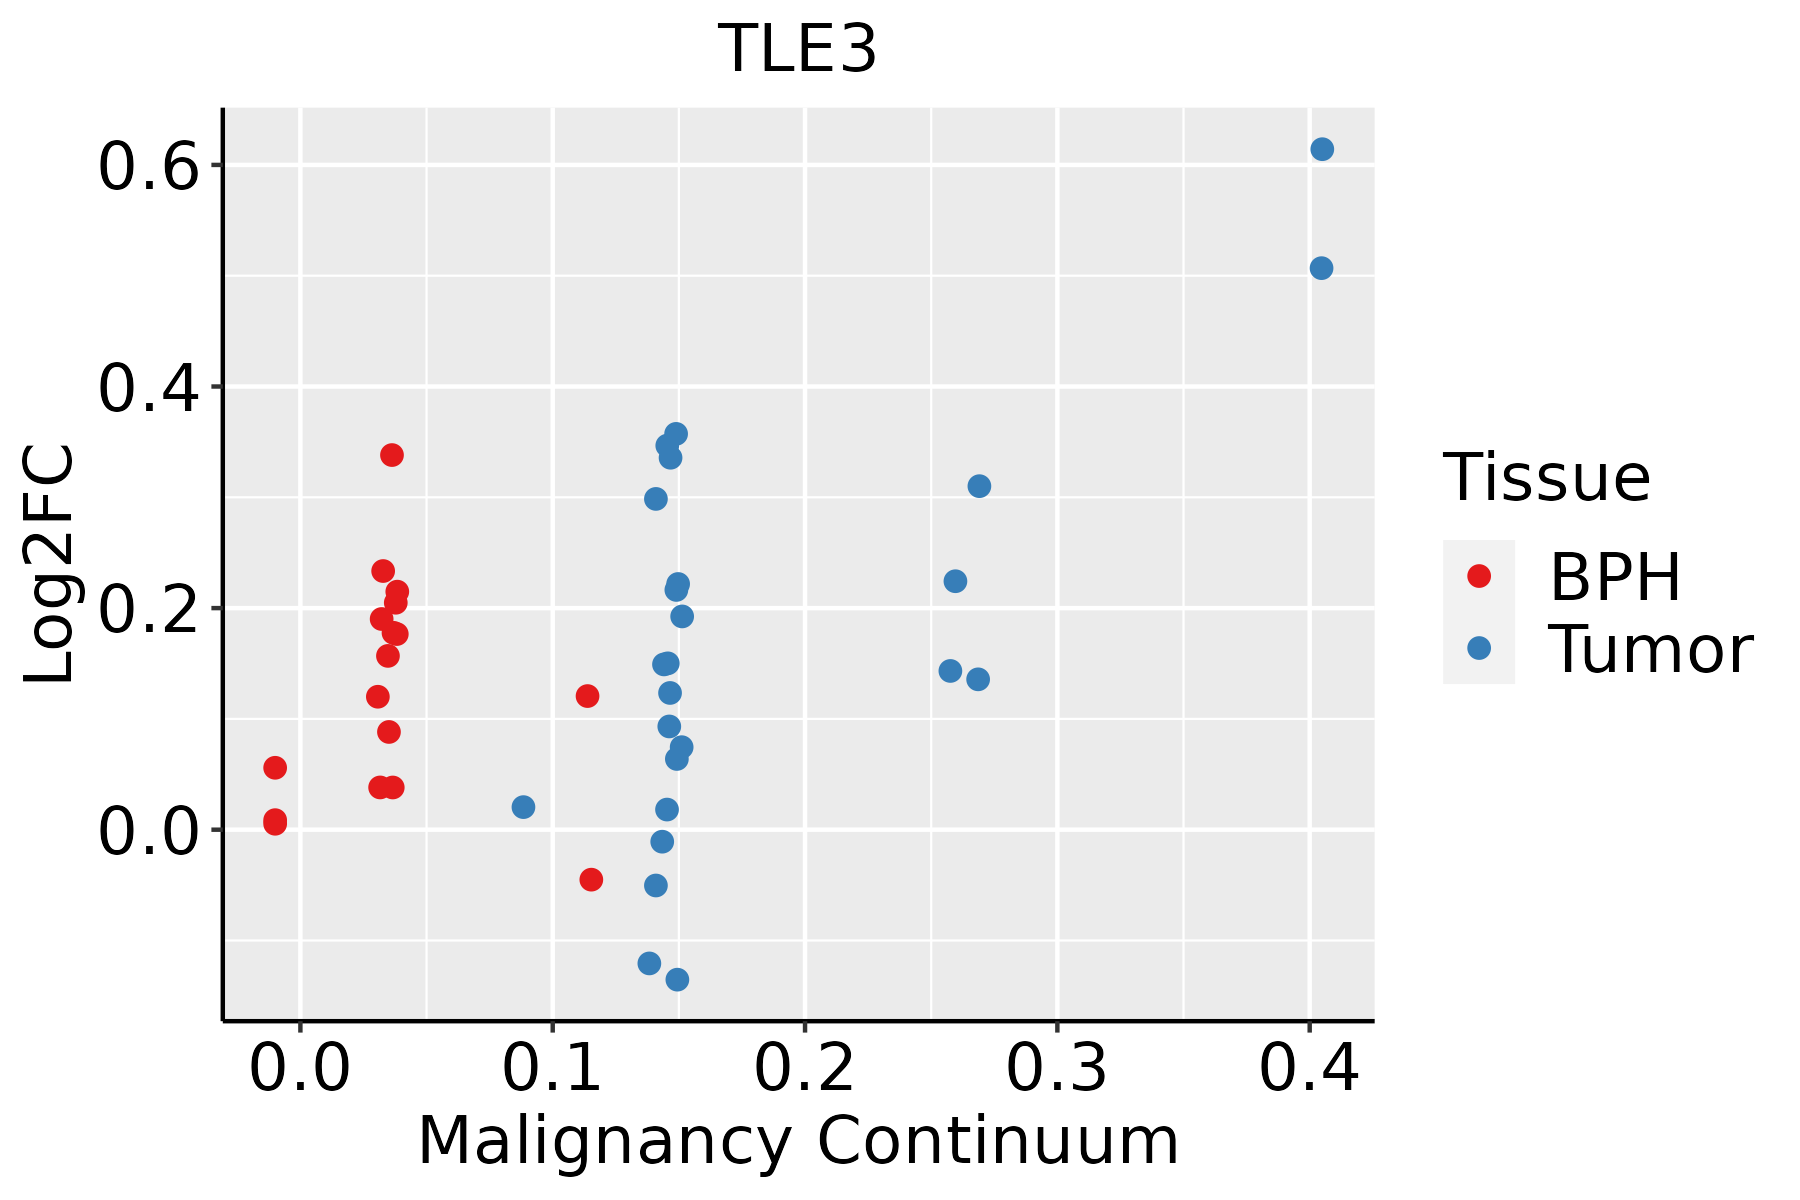 | BPH: Benign Prostatic Hyperplasia |
| Skin | 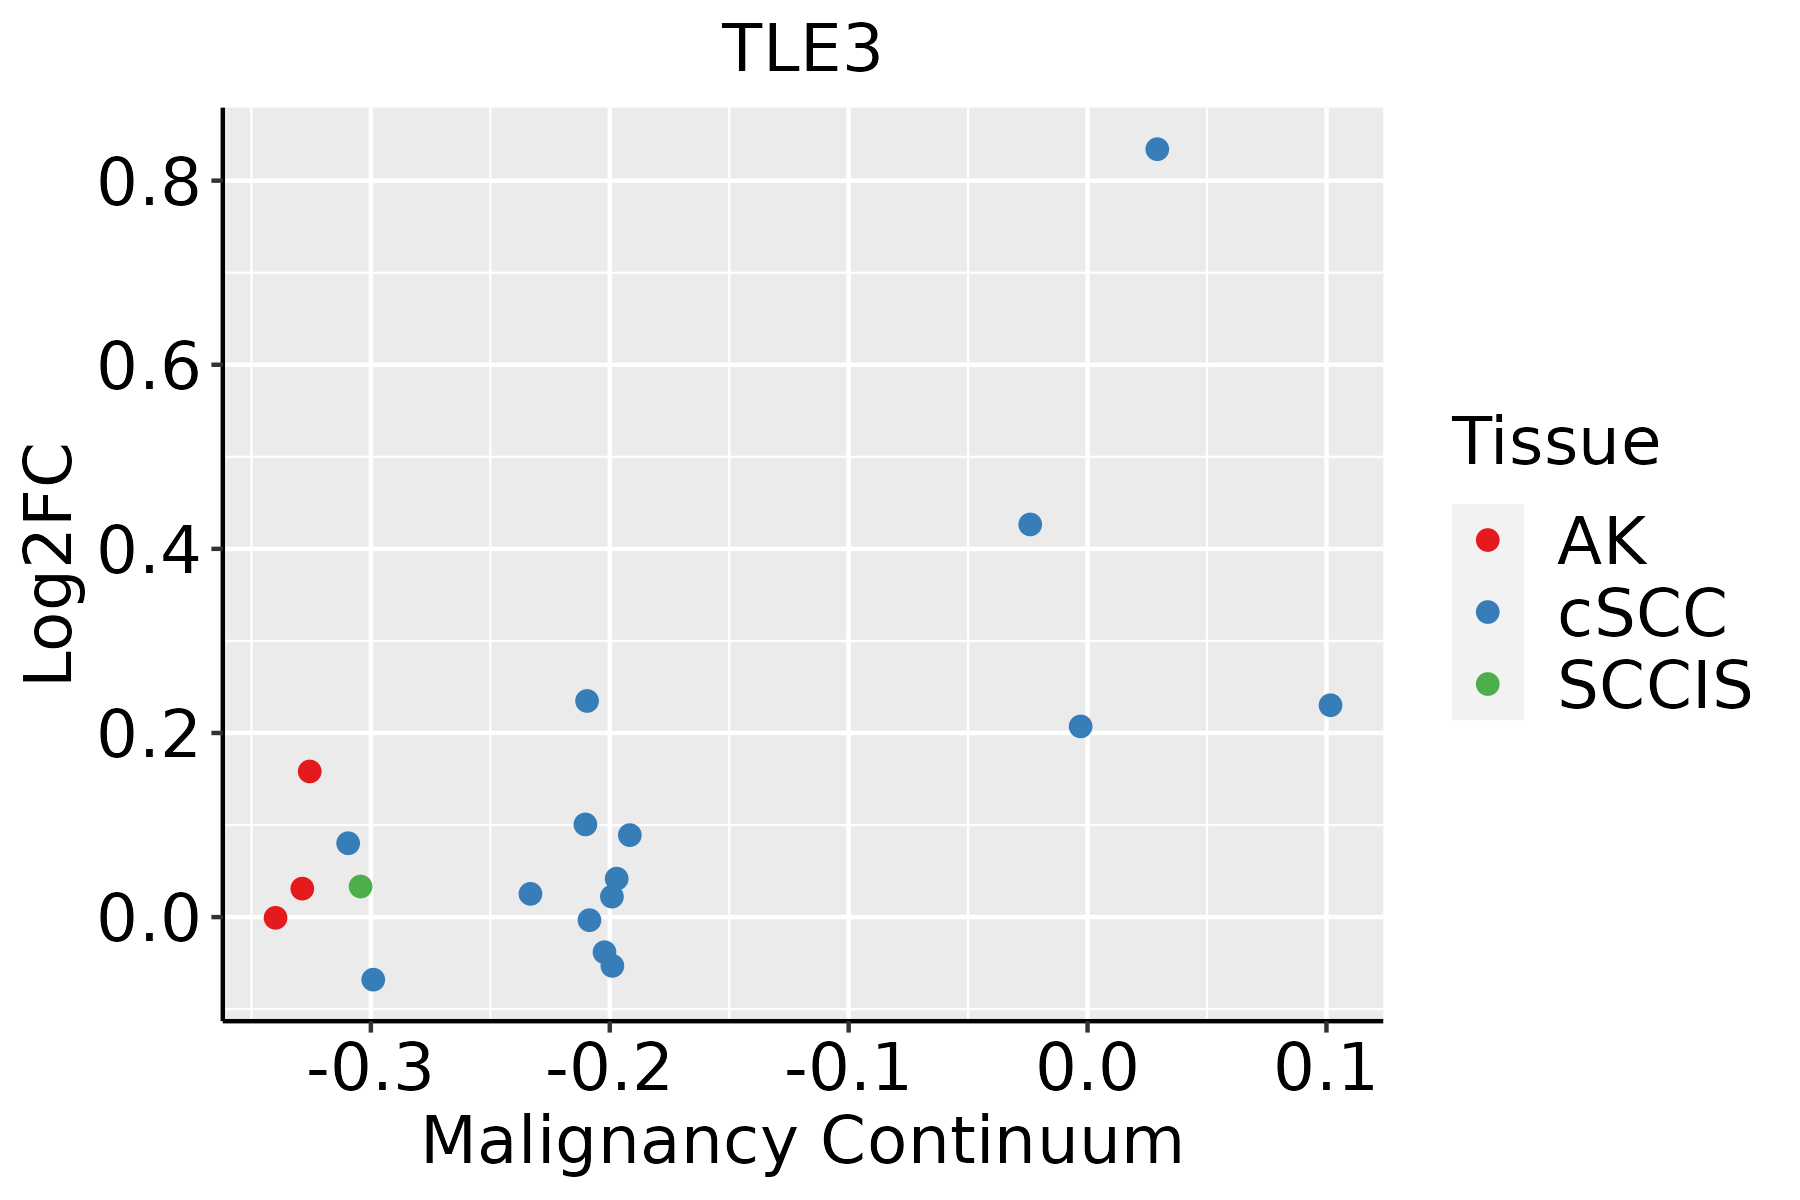 | AK: Actinic keratosis |
| cSCC: Cutaneous squamous cell carcinoma | ||
| SCCIS:squamous cell carcinoma in situ |
| ∗log2FC in expression of this searched gene in stem-like cells from each diseased tissue sample relative to stem-like cells in normal samples in each tissue plotted against the malignancy continuum. Samples are colored based on if they are from different disease stage. |
Top |
Malignant transformation related pathway analysis |
| Find out the enriched GO biological processes and KEGG pathways involved in transition from healthy to precancer to cancer |
| Tissue | Disease Stage | Enriched GO biological Processes |
| Colorectum | AD |  |
| Colorectum | SER |  |
| Colorectum | MSS |  |
| Colorectum | MSI-H |  |
| Colorectum | FAP |  |
| ∗Top 15 enriched GO BP terms are showed in the bar plot of each disease state in each tissue. Each row represents a significant GO biological process which is colored according to the -log10(p.adjust). |
| Page: 1 2 3 4 5 6 7 8 9 |
| GO ID | Tissue | Disease Stage | Description | Gene Ratio | Bg Ratio | pvalue | p.adjust | Count |
| GO:001605517 | Esophagus | ESCC | Wnt signaling pathway | 268/8552 | 444/18723 | 2.32e-10 | 6.58e-09 | 268 |
| GO:019873817 | Esophagus | ESCC | cell-cell signaling by wnt | 269/8552 | 446/18723 | 2.41e-10 | 6.79e-09 | 269 |
| GO:003011117 | Esophagus | ESCC | regulation of Wnt signaling pathway | 194/8552 | 328/18723 | 5.39e-07 | 7.14e-06 | 194 |
| GO:006007016 | Esophagus | ESCC | canonical Wnt signaling pathway | 180/8552 | 303/18723 | 9.15e-07 | 1.17e-05 | 180 |
| GO:006082817 | Esophagus | ESCC | regulation of canonical Wnt signaling pathway | 153/8552 | 253/18723 | 1.38e-06 | 1.67e-05 | 153 |
| GO:00301788 | Esophagus | ESCC | negative regulation of Wnt signaling pathway | 97/8552 | 170/18723 | 1.81e-03 | 8.31e-03 | 97 |
| GO:00900905 | Esophagus | ESCC | negative regulation of canonical Wnt signaling pathway | 78/8552 | 137/18723 | 5.17e-03 | 1.95e-02 | 78 |
| GO:01061066 | Esophagus | ESCC | cold-induced thermogenesis | 80/8552 | 144/18723 | 1.07e-02 | 3.65e-02 | 80 |
| GO:01201616 | Esophagus | ESCC | regulation of cold-induced thermogenesis | 80/8552 | 144/18723 | 1.07e-02 | 3.65e-02 | 80 |
| GO:019873821 | Liver | HCC | cell-cell signaling by wnt | 247/7958 | 446/18723 | 2.11e-08 | 4.96e-07 | 247 |
| GO:001605521 | Liver | HCC | Wnt signaling pathway | 245/7958 | 444/18723 | 3.68e-08 | 8.09e-07 | 245 |
| GO:003011121 | Liver | HCC | regulation of Wnt signaling pathway | 180/7958 | 328/18723 | 3.62e-06 | 4.72e-05 | 180 |
| GO:006007021 | Liver | HCC | canonical Wnt signaling pathway | 162/7958 | 303/18723 | 7.00e-05 | 6.32e-04 | 162 |
| GO:006082821 | Liver | HCC | regulation of canonical Wnt signaling pathway | 137/7958 | 253/18723 | 1.15e-04 | 9.70e-04 | 137 |
| GO:010610611 | Liver | HCC | cold-induced thermogenesis | 76/7958 | 144/18723 | 8.07e-03 | 3.18e-02 | 76 |
| GO:012016111 | Liver | HCC | regulation of cold-induced thermogenesis | 76/7958 | 144/18723 | 8.07e-03 | 3.18e-02 | 76 |
| GO:199084511 | Liver | HCC | adaptive thermogenesis | 81/7958 | 157/18723 | 1.32e-02 | 4.72e-02 | 81 |
| GO:001605510 | Oral cavity | OSCC | Wnt signaling pathway | 227/7305 | 444/18723 | 1.10e-07 | 1.87e-06 | 227 |
| GO:019873810 | Oral cavity | OSCC | cell-cell signaling by wnt | 227/7305 | 446/18723 | 1.75e-07 | 2.86e-06 | 227 |
| GO:003011110 | Oral cavity | OSCC | regulation of Wnt signaling pathway | 165/7305 | 328/18723 | 1.87e-05 | 1.80e-04 | 165 |
| Page: 1 2 3 |
| Pathway ID | Tissue | Disease Stage | Description | Gene Ratio | Bg Ratio | pvalue | p.adjust | qvalue | Count |
| hsa043306 | Esophagus | ESCC | Notch signaling pathway | 42/4205 | 62/8465 | 2.97e-03 | 7.97e-03 | 4.08e-03 | 42 |
| hsa0433013 | Esophagus | ESCC | Notch signaling pathway | 42/4205 | 62/8465 | 2.97e-03 | 7.97e-03 | 4.08e-03 | 42 |
| hsa043305 | Oral cavity | OSCC | Notch signaling pathway | 44/3704 | 62/8465 | 1.26e-05 | 5.55e-05 | 2.83e-05 | 44 |
| hsa0433012 | Oral cavity | OSCC | Notch signaling pathway | 44/3704 | 62/8465 | 1.26e-05 | 5.55e-05 | 2.83e-05 | 44 |
| hsa0431014 | Prostate | BPH | Wnt signaling pathway | 50/1718 | 171/8465 | 3.11e-03 | 1.15e-02 | 7.14e-03 | 50 |
| hsa043304 | Prostate | BPH | Notch signaling pathway | 21/1718 | 62/8465 | 8.53e-03 | 2.68e-02 | 1.66e-02 | 21 |
| hsa0431015 | Prostate | BPH | Wnt signaling pathway | 50/1718 | 171/8465 | 3.11e-03 | 1.15e-02 | 7.14e-03 | 50 |
| hsa0433011 | Prostate | BPH | Notch signaling pathway | 21/1718 | 62/8465 | 8.53e-03 | 2.68e-02 | 1.66e-02 | 21 |
| hsa043302 | Prostate | Tumor | Notch signaling pathway | 22/1791 | 62/8465 | 6.45e-03 | 2.16e-02 | 1.34e-02 | 22 |
| hsa0431023 | Prostate | Tumor | Wnt signaling pathway | 50/1791 | 171/8465 | 7.32e-03 | 2.37e-02 | 1.47e-02 | 50 |
| hsa043303 | Prostate | Tumor | Notch signaling pathway | 22/1791 | 62/8465 | 6.45e-03 | 2.16e-02 | 1.34e-02 | 22 |
| hsa0431033 | Prostate | Tumor | Wnt signaling pathway | 50/1791 | 171/8465 | 7.32e-03 | 2.37e-02 | 1.47e-02 | 50 |
| Page: 1 |
Top |
Cell-cell communication analysis |
| Identification of potential cell-cell interactions between two cell types and their ligand-receptor pairs for different disease states |
| Ligand | Receptor | LRpair | Pathway | Tissue | Disease Stage |
| Page: 1 |
Top |
Single-cell gene regulatory network inference analysis |
| Find out the significant the regulons (TFs) and the target genes of each regulon across cell types for different disease states |
| TF | Cell Type | Tissue | Disease Stage | Target Gene | RSS | Regulon Activity |
| ∗The dot plots of a searched regulon are shown for all cell subpopulations in each disease state of each tissue based on the regulon specific score inferred using pySCENIC and by calculating the average expression. |
| Page: 1 |
Top |
Somatic mutation of malignant transformation related genes |
| Annotation of somatic variants for genes involved in malignant transformation |
| Hugo Symbol | Variant Class | Variant Classification | dbSNP RS | HGVSc | HGVSp | HGVSp Short | SWISSPROT | BIOTYPE | SIFT | PolyPhen | Tumor Sample Barcode | Tissue | Histology | Sex | Age | Stage | Therapy Types | Drugs | Outcome |
| TLE3 | SNV | Missense_Mutation | c.1906G>A | p.Gly636Arg | p.G636R | Q04726 | protein_coding | deleterious(0) | probably_damaging(1) | TCGA-AC-A23H-01 | Breast | breast invasive carcinoma | Female | >=65 | I/II | Unknown | Unknown | PD | |
| TLE3 | SNV | Missense_Mutation | c.1812C>G | p.Asp604Glu | p.D604E | Q04726 | protein_coding | deleterious(0) | probably_damaging(0.993) | TCGA-BH-A0BZ-01 | Breast | breast invasive carcinoma | Female | <65 | III/IV | Chemotherapy | doxorubicin | CR | |
| TLE3 | SNV | Missense_Mutation | c.1022N>G | p.Pro341Arg | p.P341R | Q04726 | protein_coding | deleterious(0.03) | benign(0.013) | TCGA-C8-A134-01 | Breast | breast invasive carcinoma | Female | <65 | I/II | Chemotherapy | 5-fluorouracil | CR | |
| TLE3 | SNV | Missense_Mutation | novel | c.1920C>A | p.Asn640Lys | p.N640K | Q04726 | protein_coding | deleterious(0.04) | probably_damaging(0.995) | TCGA-EW-A1J2-01 | Breast | breast invasive carcinoma | Female | <65 | I/II | Chemotherapy | taxotere | SD |
| TLE3 | insertion | Frame_Shift_Ins | novel | c.775_776insTGTATGTGGGGTCTGGGTGGAAG | p.Thr259MetfsTer29 | p.T259Mfs*29 | Q04726 | protein_coding | TCGA-AN-A046-01 | Breast | breast invasive carcinoma | Female | >=65 | I/II | Unknown | Unknown | SD | ||
| TLE3 | insertion | In_Frame_Ins | novel | c.133_134insATA | p.Val45delinsAspMet | p.V45delinsDM | Q04726 | protein_coding | TCGA-AN-A0FX-01 | Breast | breast invasive carcinoma | Female | <65 | I/II | Unknown | Unknown | SD | ||
| TLE3 | insertion | Nonsense_Mutation | novel | c.132_133insCCAGTTTAGCTAGTGTGGTGTCGTTTGATG | p.Lys44_Val45insProValTerLeuValTrpCysArgLeuMet | p.K44_V45insPV*LVWCRLM | Q04726 | protein_coding | TCGA-AN-A0FX-01 | Breast | breast invasive carcinoma | Female | <65 | I/II | Unknown | Unknown | SD | ||
| TLE3 | deletion | In_Frame_Del | c.328_330delNNN | p.Arg110del | p.R110del | Q04726 | protein_coding | TCGA-D8-A1JA-01 | Breast | breast invasive carcinoma | Female | <65 | III/IV | Chemotherapy | adriamycin | PD | |||
| TLE3 | deletion | Frame_Shift_Del | novel | c.1223delN | p.Ala408ValfsTer9 | p.A408Vfs*9 | Q04726 | protein_coding | TCGA-EW-A2FV-01 | Breast | breast invasive carcinoma | Female | <65 | III/IV | Chemotherapy | docetaxel | SD | ||
| TLE3 | SNV | Missense_Mutation | rs771819808 | c.1634N>A | p.Arg545His | p.R545H | Q04726 | protein_coding | deleterious(0.01) | probably_damaging(0.932) | TCGA-2W-A8YY-01 | Cervix | cervical & endocervical cancer | Female | <65 | I/II | Chemotherapy | cisplatin | CR |
| Page: 1 2 3 4 5 6 7 8 |
Top |
Related drugs of malignant transformation related genes |
| Identification of chemicals and drugs interact with genes involved in malignant transfromation |
| (DGIdb 4.0) |
| Entrez ID | Symbol | Category | Interaction Types | Drug Claim Name | Drug Name | PMIDs |
| 7090 | TLE3 | TRANSCRIPTION FACTOR COMPLEX, TRANSCRIPTION FACTOR | DOCETAXEL | DOCETAXEL | ||
| 7090 | TLE3 | TRANSCRIPTION FACTOR COMPLEX, TRANSCRIPTION FACTOR | PACLITAXEL | PACLITAXEL |
| Page: 1 |

Copyright 2023-Present -The University of Texas Health Science Center at Houston |