
|
|||||
|
 | |
| |
| |
| |
| |
| |
|
Gene: TLDC1 |
Gene summary for TLDC1 |
| Gene information | Species | Human | Gene symbol | TLDC1 | Gene ID | 57707 |
| Gene name | MTOR associated protein, eak-7 homolog | |
| Gene Alias | EAK7 | |
| Cytomap | 16q24.1 | |
| Gene Type | protein-coding | GO ID | GO:0001101 | UniProtAcc | A8K5C2 |
Top |
Malignant transformation analysis |
| Identification of the aberrant gene expression in precancerous and cancerous lesions by comparing the gene expression of stem-like cells in diseased tissues with normal stem cells |
| Entrez ID | Symbol | Replicates | Species | Organ | Tissue | Adj P-value | Log2FC | Malignancy |
| 57707 | TLDC1 | P1T-E | Human | Esophagus | ESCC | 2.12e-03 | 1.80e-01 | 0.0875 |
| 57707 | TLDC1 | P2T-E | Human | Esophagus | ESCC | 4.86e-07 | 1.87e-01 | 0.1177 |
| 57707 | TLDC1 | P4T-E | Human | Esophagus | ESCC | 1.88e-08 | 2.50e-01 | 0.1323 |
| 57707 | TLDC1 | P5T-E | Human | Esophagus | ESCC | 3.91e-13 | 2.73e-01 | 0.1327 |
| 57707 | TLDC1 | P8T-E | Human | Esophagus | ESCC | 3.22e-14 | 1.98e-01 | 0.0889 |
| 57707 | TLDC1 | P9T-E | Human | Esophagus | ESCC | 7.37e-04 | 9.14e-02 | 0.1131 |
| 57707 | TLDC1 | P10T-E | Human | Esophagus | ESCC | 5.79e-03 | 5.93e-02 | 0.116 |
| 57707 | TLDC1 | P11T-E | Human | Esophagus | ESCC | 3.22e-06 | 3.12e-01 | 0.1426 |
| 57707 | TLDC1 | P12T-E | Human | Esophagus | ESCC | 1.51e-07 | 1.24e-01 | 0.1122 |
| 57707 | TLDC1 | P15T-E | Human | Esophagus | ESCC | 1.60e-12 | 3.23e-01 | 0.1149 |
| 57707 | TLDC1 | P16T-E | Human | Esophagus | ESCC | 5.93e-03 | 8.85e-02 | 0.1153 |
| 57707 | TLDC1 | P17T-E | Human | Esophagus | ESCC | 8.79e-05 | 3.64e-01 | 0.1278 |
| 57707 | TLDC1 | P20T-E | Human | Esophagus | ESCC | 3.40e-10 | 2.62e-01 | 0.1124 |
| 57707 | TLDC1 | P21T-E | Human | Esophagus | ESCC | 2.32e-24 | 5.29e-01 | 0.1617 |
| 57707 | TLDC1 | P22T-E | Human | Esophagus | ESCC | 5.01e-13 | 2.45e-01 | 0.1236 |
| 57707 | TLDC1 | P23T-E | Human | Esophagus | ESCC | 2.63e-15 | 4.20e-01 | 0.108 |
| 57707 | TLDC1 | P24T-E | Human | Esophagus | ESCC | 3.83e-11 | 2.73e-01 | 0.1287 |
| 57707 | TLDC1 | P26T-E | Human | Esophagus | ESCC | 2.92e-08 | 2.29e-01 | 0.1276 |
| 57707 | TLDC1 | P27T-E | Human | Esophagus | ESCC | 4.37e-08 | 1.39e-01 | 0.1055 |
| 57707 | TLDC1 | P28T-E | Human | Esophagus | ESCC | 1.08e-02 | 1.24e-01 | 0.1149 |
| Page: 1 2 3 4 |
| Tissue | Expression Dynamics | Abbreviation |
| Esophagus | 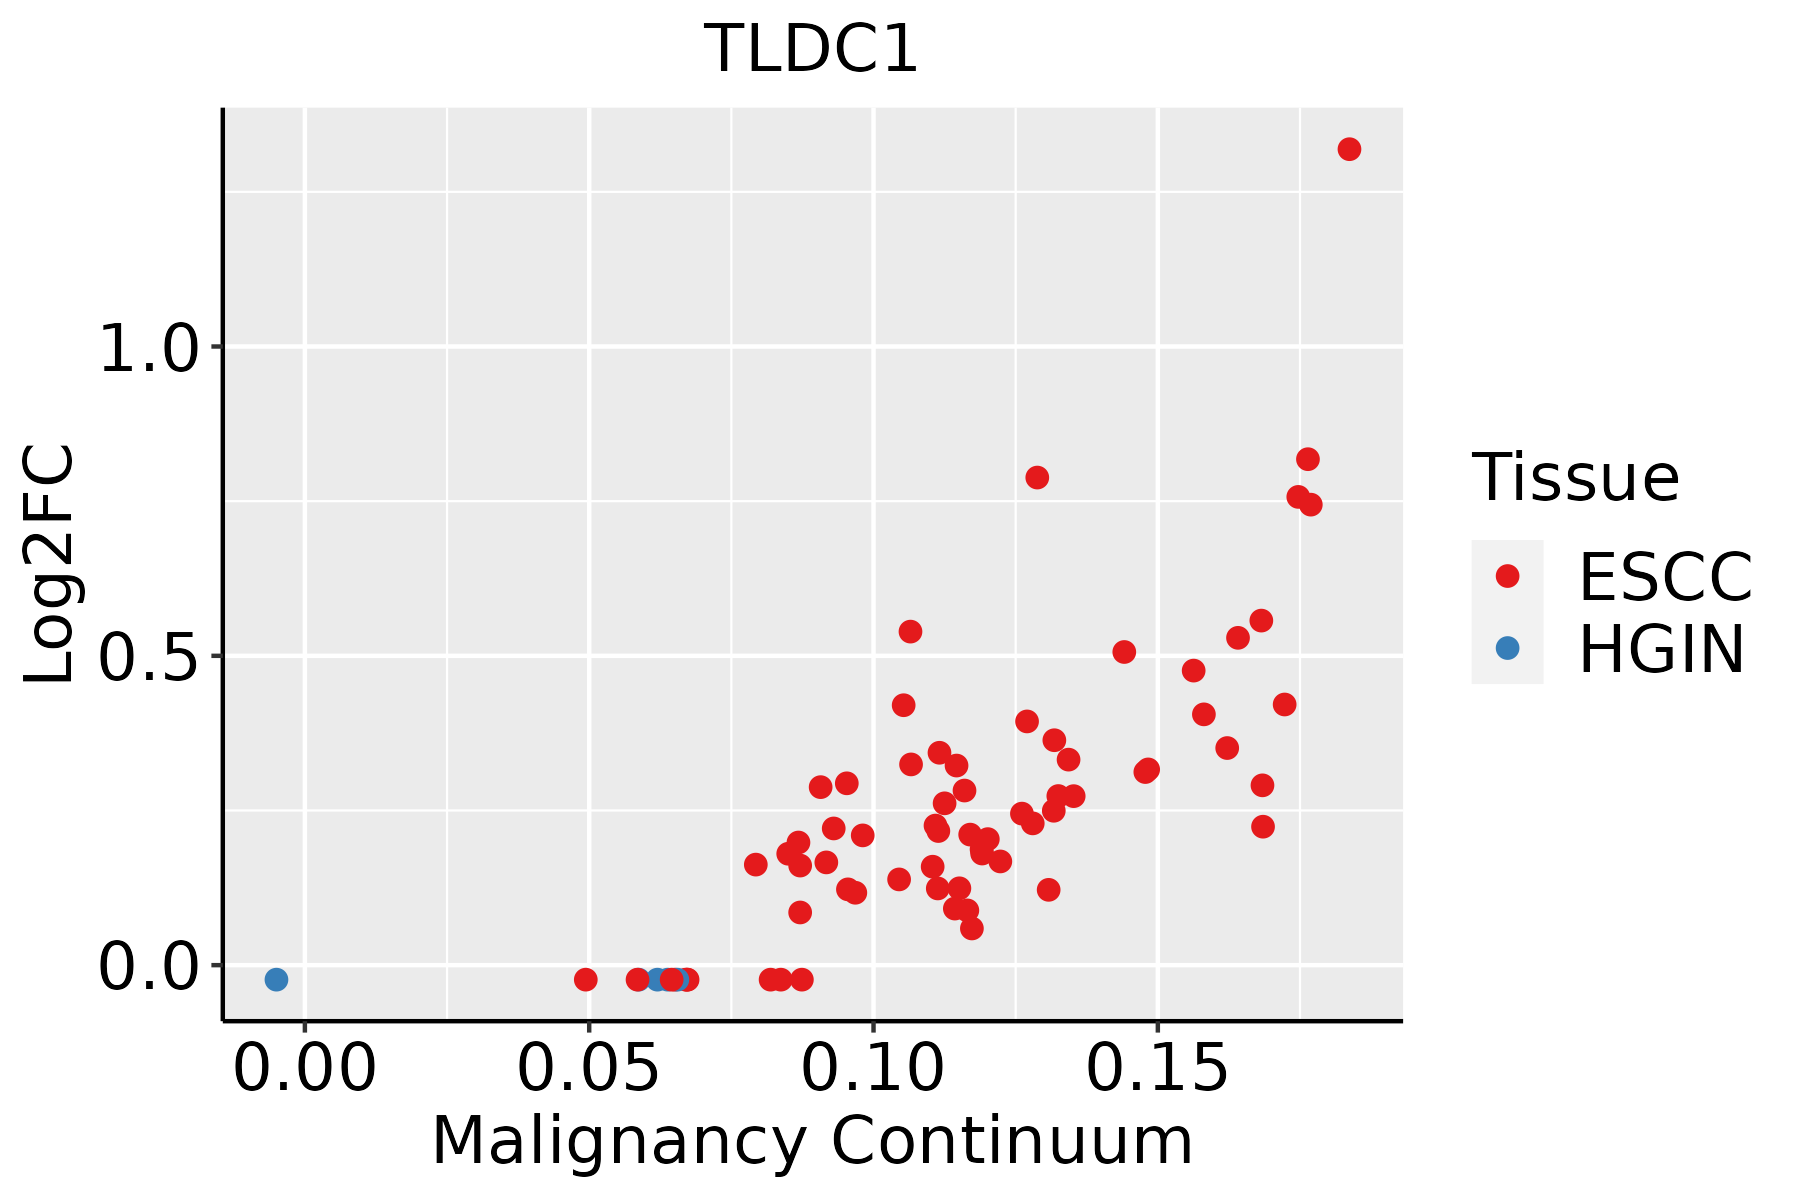 | ESCC: Esophageal squamous cell carcinoma |
| HGIN: High-grade intraepithelial neoplasias | ||
| LGIN: Low-grade intraepithelial neoplasias | ||
| Liver |  | HCC: Hepatocellular carcinoma |
| NAFLD: Non-alcoholic fatty liver disease | ||
| Oral Cavity |  | EOLP: Erosive Oral lichen planus |
| LP: leukoplakia | ||
| NEOLP: Non-erosive oral lichen planus | ||
| OSCC: Oral squamous cell carcinoma | ||
| Skin |  | AK: Actinic keratosis |
| cSCC: Cutaneous squamous cell carcinoma | ||
| SCCIS:squamous cell carcinoma in situ |
| ∗log2FC in expression of this searched gene in stem-like cells from each diseased tissue sample relative to stem-like cells in normal samples in each tissue plotted against the malignancy continuum. Samples are colored based on if they are from different disease stage. |
Top |
Malignant transformation related pathway analysis |
| Find out the enriched GO biological processes and KEGG pathways involved in transition from healthy to precancer to cancer |
| Tissue | Disease Stage | Enriched GO biological Processes |
| Colorectum | AD |  |
| Colorectum | SER |  |
| Colorectum | MSS |  |
| Colorectum | MSI-H |  |
| Colorectum | FAP |  |
| ∗Top 15 enriched GO BP terms are showed in the bar plot of each disease state in each tissue. Each row represents a significant GO biological process which is colored according to the -log10(p.adjust). |
| Page: 1 2 3 4 5 6 7 8 9 |
| GO ID | Tissue | Disease Stage | Description | Gene Ratio | Bg Ratio | pvalue | p.adjust | Count |
| Page: 1 |
| Pathway ID | Tissue | Disease Stage | Description | Gene Ratio | Bg Ratio | pvalue | p.adjust | qvalue | Count |
| Page: 1 |
Top |
Cell-cell communication analysis |
| Identification of potential cell-cell interactions between two cell types and their ligand-receptor pairs for different disease states |
| Ligand | Receptor | LRpair | Pathway | Tissue | Disease Stage |
| Page: 1 |
Top |
Single-cell gene regulatory network inference analysis |
| Find out the significant the regulons (TFs) and the target genes of each regulon across cell types for different disease states |
| TF | Cell Type | Tissue | Disease Stage | Target Gene | RSS | Regulon Activity |
| ∗The dot plots of a searched regulon are shown for all cell subpopulations in each disease state of each tissue based on the regulon specific score inferred using pySCENIC and by calculating the average expression. |
| Page: 1 |
Top |
Somatic mutation of malignant transformation related genes |
| Annotation of somatic variants for genes involved in malignant transformation |
| Hugo Symbol | Variant Class | Variant Classification | dbSNP RS | HGVSc | HGVSp | HGVSp Short | SWISSPROT | BIOTYPE | SIFT | PolyPhen | Tumor Sample Barcode | Tissue | Histology | Sex | Age | Stage | Therapy Types | Drugs | Outcome |
| TLDC1 | SNV | Missense_Mutation | rs777986149 | c.830N>C | p.His277Pro | p.H277P | Q6P9B6 | protein_coding | deleterious(0.03) | benign(0.425) | TCGA-A2-A0ST-01 | Breast | breast invasive carcinoma | Female | <65 | I/II | Chemotherapy | adriamycin | SD |
| TLDC1 | SNV | Missense_Mutation | rs148516272 | c.1157C>T | p.Thr386Met | p.T386M | Q6P9B6 | protein_coding | tolerated(0.06) | benign(0.348) | TCGA-AO-A1KR-01 | Breast | breast invasive carcinoma | Female | <65 | I/II | Chemotherapy | cyclophosphamide | SD |
| TLDC1 | insertion | In_Frame_Ins | novel | c.423_424insCATGGTTTAACTGTAATAGCGTACCGCACGGGTCACAGC | p.Leu141_Ser142insHisGlyLeuThrValIleAlaTyrArgThrGlyHisSer | p.L141_S142insHGLTVIAYRTGHS | Q6P9B6 | protein_coding | TCGA-A8-A07U-01 | Breast | breast invasive carcinoma | Female | >=65 | III/IV | Chemotherapy | 5-fluorouracil | SD | ||
| TLDC1 | SNV | Missense_Mutation | rs200383674 | c.1331N>A | p.Arg444His | p.R444H | Q6P9B6 | protein_coding | tolerated(0.27) | benign(0.015) | TCGA-EA-A3QD-01 | Cervix | cervical & endocervical cancer | Female | <65 | III/IV | Chemotherapy | cisplatin | CR |
| TLDC1 | SNV | Missense_Mutation | c.614N>G | p.His205Arg | p.H205R | Q6P9B6 | protein_coding | tolerated(0.21) | benign(0.003) | TCGA-AA-3492-01 | Colorectum | colon adenocarcinoma | Female | >=65 | I/II | Unknown | Unknown | SD | |
| TLDC1 | SNV | Missense_Mutation | c.34T>C | p.Phe12Leu | p.F12L | Q6P9B6 | protein_coding | tolerated(0.65) | benign(0) | TCGA-AA-3956-01 | Colorectum | colon adenocarcinoma | Male | >=65 | I/II | Unknown | Unknown | SD | |
| TLDC1 | SNV | Missense_Mutation | c.688C>A | p.Leu230Met | p.L230M | Q6P9B6 | protein_coding | deleterious(0) | possibly_damaging(0.89) | TCGA-AA-A01P-01 | Colorectum | colon adenocarcinoma | Female | >=65 | III/IV | Unknown | Unknown | PD | |
| TLDC1 | SNV | Missense_Mutation | c.891N>T | p.Glu297Asp | p.E297D | Q6P9B6 | protein_coding | deleterious(0.01) | possibly_damaging(0.881) | TCGA-AD-6889-01 | Colorectum | colon adenocarcinoma | Male | >=65 | I/II | Chemotherapy | xeloda | PD | |
| TLDC1 | SNV | Missense_Mutation | rs201799248 | c.889G>A | p.Glu297Lys | p.E297K | Q6P9B6 | protein_coding | tolerated(0.89) | benign(0.062) | TCGA-CM-4743-01 | Colorectum | colon adenocarcinoma | Male | >=65 | I/II | Chemotherapy | capecitabine | SD |
| TLDC1 | SNV | Missense_Mutation | c.983N>T | p.Ser328Phe | p.S328F | Q6P9B6 | protein_coding | deleterious(0) | probably_damaging(0.992) | TCGA-G4-6304-01 | Colorectum | colon adenocarcinoma | Female | >=65 | I/II | Chemotherapy | fluorouracil | PD |
| Page: 1 2 3 4 |
Top |
Related drugs of malignant transformation related genes |
| Identification of chemicals and drugs interact with genes involved in malignant transfromation |
| (DGIdb 4.0) |
| Entrez ID | Symbol | Category | Interaction Types | Drug Claim Name | Drug Name | PMIDs |
| Page: 1 |

Copyright 2023-Present -The University of Texas Health Science Center at Houston |