
|
|||||
|
 | |
| |
| |
| |
| |
| |
|
Gene: TLCD2 |
Gene summary for TLCD2 |
| Gene information | Species | Human | Gene symbol | TLCD2 | Gene ID | 727910 |
| Gene name | TLC domain containing 2 | |
| Gene Alias | TLCD2 | |
| Cytomap | 17p13.3 | |
| Gene Type | protein-coding | GO ID | GO:0007009 | UniProtAcc | A6NGC4 |
Top |
Malignant transformation analysis |
| Identification of the aberrant gene expression in precancerous and cancerous lesions by comparing the gene expression of stem-like cells in diseased tissues with normal stem cells |
| Entrez ID | Symbol | Replicates | Species | Organ | Tissue | Adj P-value | Log2FC | Malignancy |
| 727910 | TLCD2 | HTA11_2487_2000001011 | Human | Colorectum | SER | 3.36e-02 | 2.71e-01 | -0.1808 |
| 727910 | TLCD2 | HTA11_347_2000001011 | Human | Colorectum | AD | 1.91e-15 | 5.25e-01 | -0.1954 |
| 727910 | TLCD2 | HTA11_83_2000001011 | Human | Colorectum | SER | 3.59e-03 | 3.30e-01 | -0.1526 |
| 727910 | TLCD2 | HTA11_696_2000001011 | Human | Colorectum | AD | 2.48e-06 | 3.94e-01 | -0.1464 |
| 727910 | TLCD2 | HTA11_5212_2000001011 | Human | Colorectum | AD | 1.91e-02 | 2.91e-01 | -0.2061 |
| 727910 | TLCD2 | A015-C-104 | Human | Colorectum | FAP | 4.36e-02 | -7.59e-02 | -0.1899 |
| 727910 | TLCD2 | A001-C-203 | Human | Colorectum | FAP | 1.57e-03 | -1.42e-01 | -0.0481 |
| 727910 | TLCD2 | A002-C-116 | Human | Colorectum | FAP | 2.61e-02 | -6.24e-02 | -0.0452 |
| 727910 | TLCD2 | F034 | Human | Colorectum | FAP | 1.75e-02 | -1.38e-01 | -0.0665 |
| 727910 | TLCD2 | HCC1_Meng | Human | Liver | HCC | 2.21e-06 | -3.66e-02 | 0.0246 |
| 727910 | TLCD2 | HCC2_Meng | Human | Liver | HCC | 1.13e-29 | 2.81e-01 | 0.0107 |
| 727910 | TLCD2 | cirrhotic1 | Human | Liver | Cirrhotic | 7.45e-03 | 8.49e-02 | 0.0202 |
| 727910 | TLCD2 | HCC1 | Human | Liver | HCC | 4.50e-21 | 2.10e+00 | 0.5336 |
| 727910 | TLCD2 | HCC2 | Human | Liver | HCC | 9.85e-38 | 3.17e+00 | 0.5341 |
| 727910 | TLCD2 | HCC5 | Human | Liver | HCC | 6.43e-38 | 2.40e+00 | 0.4932 |
| 727910 | TLCD2 | C21 | Human | Oral cavity | OSCC | 4.25e-02 | 1.72e-01 | 0.2678 |
| 727910 | TLCD2 | C30 | Human | Oral cavity | OSCC | 6.49e-11 | 5.80e-01 | 0.3055 |
| 727910 | TLCD2 | C38 | Human | Oral cavity | OSCC | 2.80e-02 | 5.37e-01 | 0.172 |
| 727910 | TLCD2 | C08 | Human | Oral cavity | OSCC | 1.27e-12 | 3.11e-01 | 0.1919 |
| 727910 | TLCD2 | LP15 | Human | Oral cavity | LP | 2.70e-02 | 6.64e-01 | 0.2174 |
| Page: 1 2 |
| Tissue | Expression Dynamics | Abbreviation |
| Colorectum (GSE201348) | 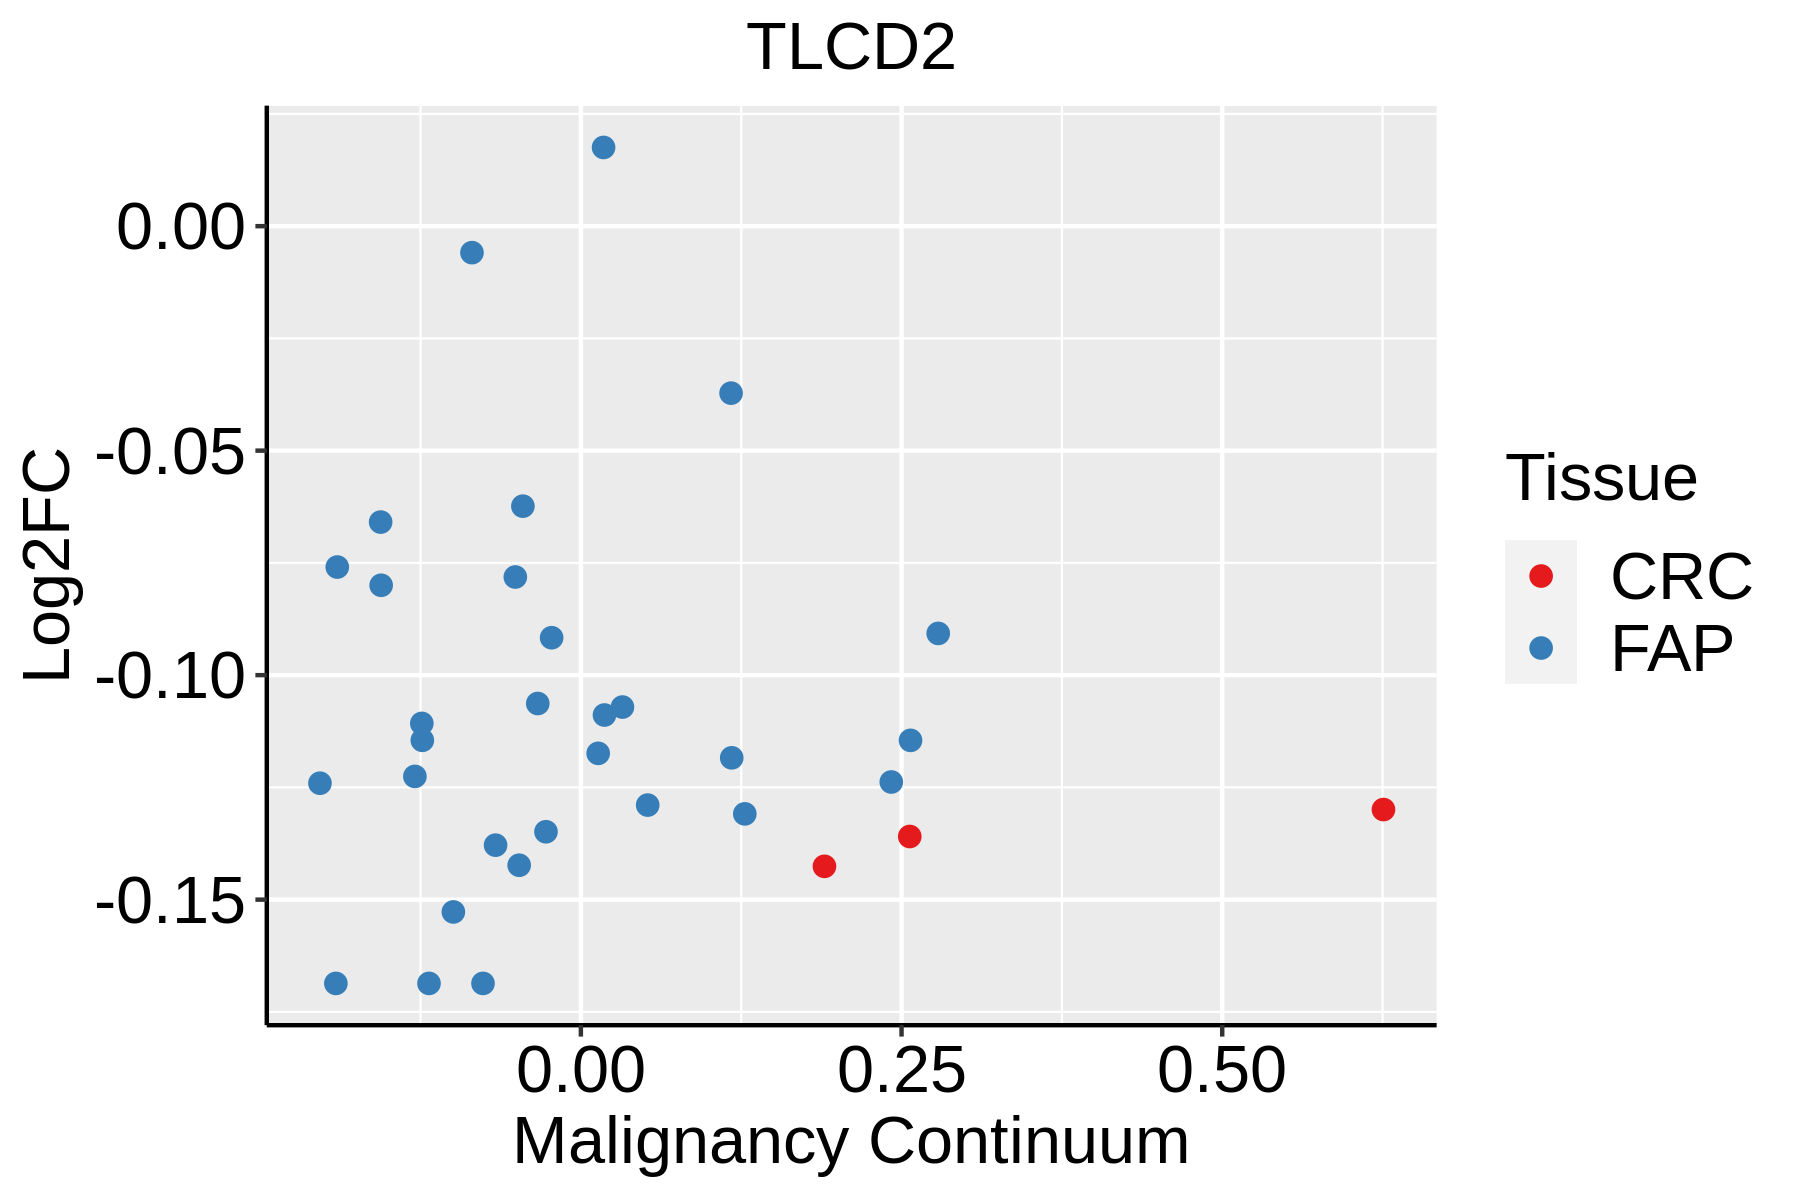 | FAP: Familial adenomatous polyposis |
| CRC: Colorectal cancer | ||
| Colorectum (HTA11) |  | AD: Adenomas |
| SER: Sessile serrated lesions | ||
| MSI-H: Microsatellite-high colorectal cancer | ||
| MSS: Microsatellite stable colorectal cancer | ||
| Liver | 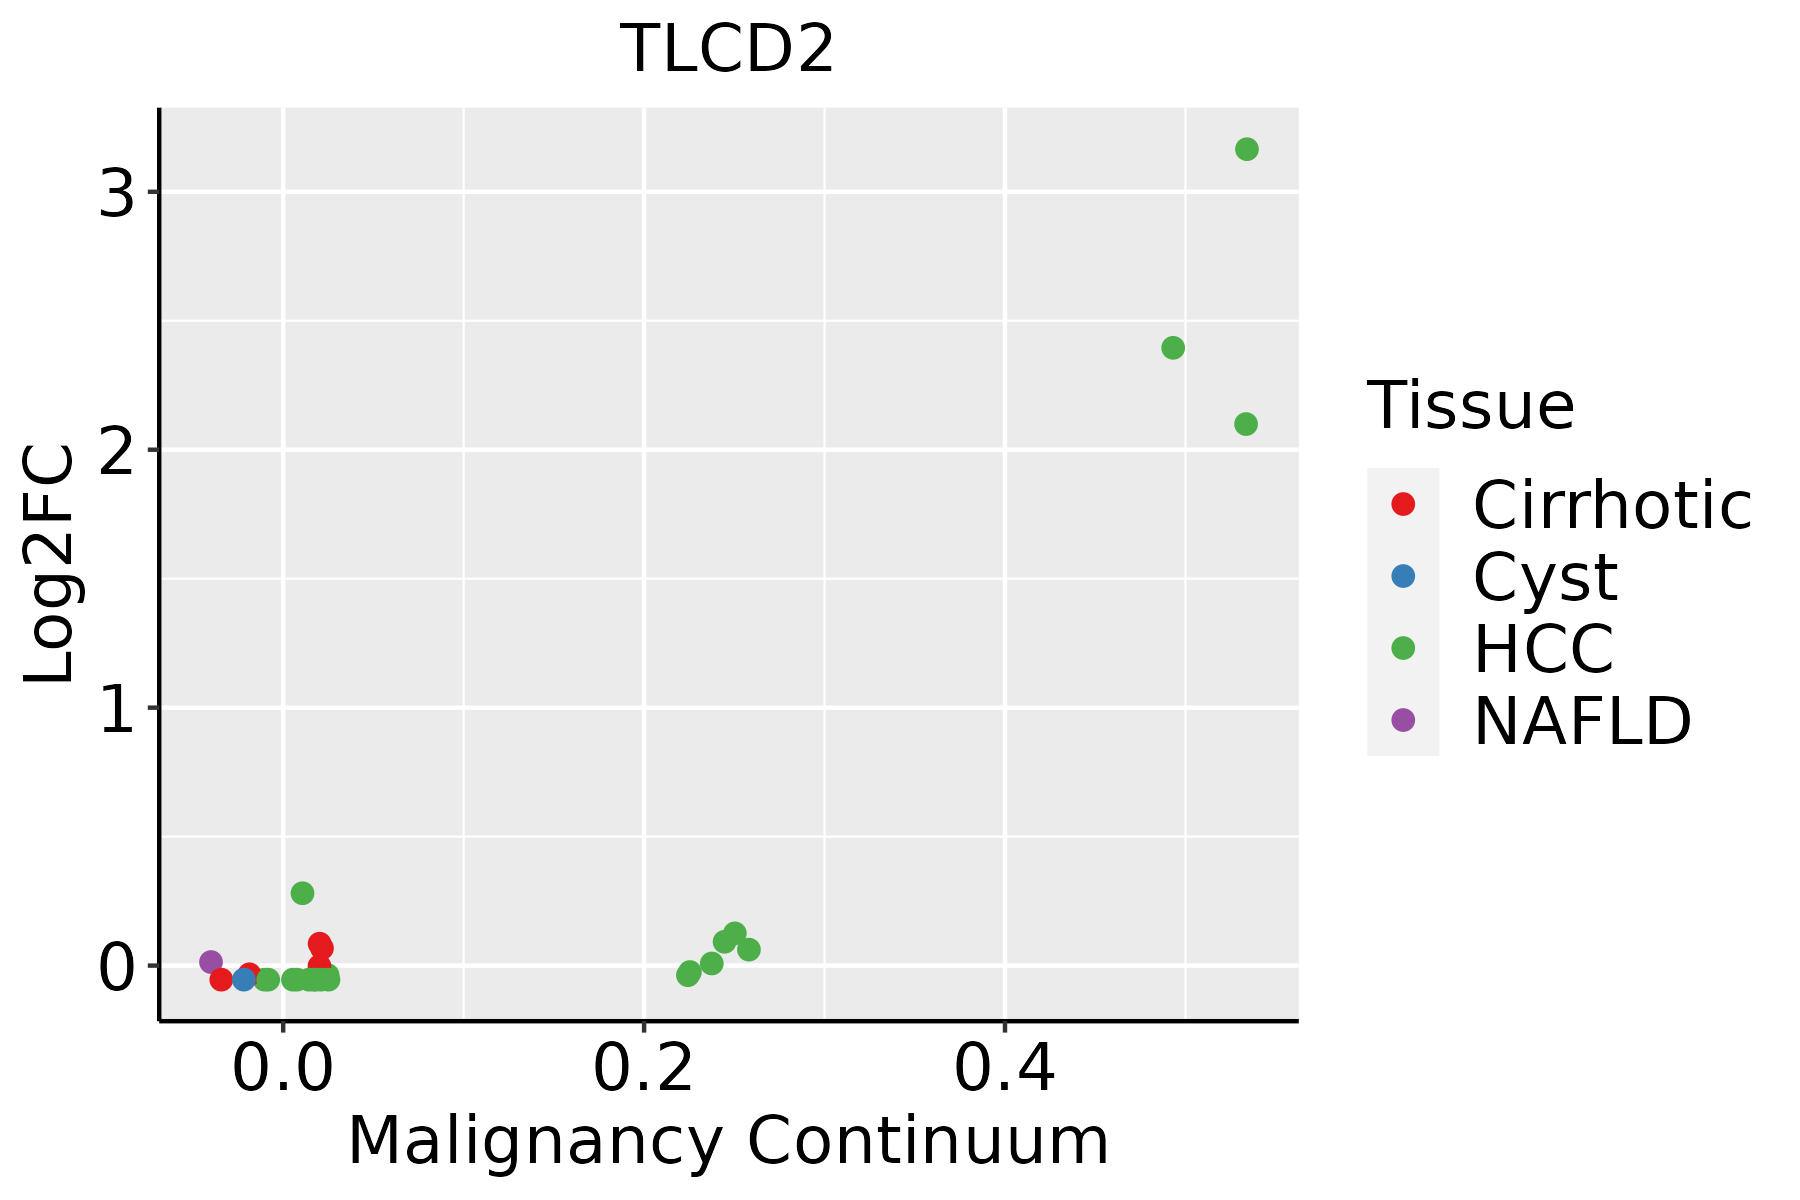 | HCC: Hepatocellular carcinoma |
| NAFLD: Non-alcoholic fatty liver disease | ||
| Oral Cavity |  | EOLP: Erosive Oral lichen planus |
| LP: leukoplakia | ||
| NEOLP: Non-erosive oral lichen planus | ||
| OSCC: Oral squamous cell carcinoma |
| ∗log2FC in expression of this searched gene in stem-like cells from each diseased tissue sample relative to stem-like cells in normal samples in each tissue plotted against the malignancy continuum. Samples are colored based on if they are from different disease stage. |
Top |
Malignant transformation related pathway analysis |
| Find out the enriched GO biological processes and KEGG pathways involved in transition from healthy to precancer to cancer |
| Tissue | Disease Stage | Enriched GO biological Processes |
| Colorectum | AD |  |
| Colorectum | SER |  |
| Colorectum | MSS |  |
| Colorectum | MSI-H |  |
| Colorectum | FAP |  |
| ∗Top 15 enriched GO BP terms are showed in the bar plot of each disease state in each tissue. Each row represents a significant GO biological process which is colored according to the -log10(p.adjust). |
| Page: 1 2 3 4 5 6 7 8 9 |
| GO ID | Tissue | Disease Stage | Description | Gene Ratio | Bg Ratio | pvalue | p.adjust | Count |
| GO:0071709 | Colorectum | AD | membrane assembly | 22/3918 | 50/18723 | 2.00e-04 | 2.66e-03 | 22 |
| GO:0044091 | Colorectum | AD | membrane biogenesis | 22/3918 | 55/18723 | 9.88e-04 | 9.28e-03 | 22 |
| GO:00717091 | Colorectum | SER | membrane assembly | 20/2897 | 50/18723 | 2.45e-05 | 6.84e-04 | 20 |
| GO:00440911 | Colorectum | SER | membrane biogenesis | 20/2897 | 55/18723 | 1.21e-04 | 2.49e-03 | 20 |
| GO:0007009 | Colorectum | SER | plasma membrane organization | 36/2897 | 142/18723 | 1.50e-03 | 1.62e-02 | 36 |
| GO:00717093 | Colorectum | FAP | membrane assembly | 17/2622 | 50/18723 | 2.86e-04 | 3.77e-03 | 17 |
| GO:00440913 | Colorectum | FAP | membrane biogenesis | 17/2622 | 55/18723 | 9.95e-04 | 9.80e-03 | 17 |
| GO:00070091 | Colorectum | FAP | plasma membrane organization | 31/2622 | 142/18723 | 7.20e-03 | 4.38e-02 | 31 |
| GO:005508811 | Liver | Cirrhotic | lipid homeostasis | 74/4634 | 167/18723 | 2.46e-08 | 8.51e-07 | 74 |
| GO:00440914 | Liver | Cirrhotic | membrane biogenesis | 25/4634 | 55/18723 | 6.51e-04 | 4.96e-03 | 25 |
| GO:00717094 | Liver | Cirrhotic | membrane assembly | 23/4634 | 50/18723 | 8.62e-04 | 6.22e-03 | 23 |
| GO:00550882 | Liver | HCC | lipid homeostasis | 103/7958 | 167/18723 | 4.27e-07 | 7.18e-06 | 103 |
| GO:004409111 | Liver | HCC | membrane biogenesis | 37/7958 | 55/18723 | 1.79e-04 | 1.41e-03 | 37 |
| GO:007170911 | Liver | HCC | membrane assembly | 34/7958 | 50/18723 | 2.38e-04 | 1.79e-03 | 34 |
| GO:00440917 | Oral cavity | OSCC | membrane biogenesis | 35/7305 | 55/18723 | 1.88e-04 | 1.27e-03 | 35 |
| GO:00717098 | Oral cavity | OSCC | membrane assembly | 32/7305 | 50/18723 | 3.02e-04 | 1.89e-03 | 32 |
| GO:004409113 | Oral cavity | LP | membrane biogenesis | 25/4623 | 55/18723 | 6.27e-04 | 5.71e-03 | 25 |
| GO:007170913 | Oral cavity | LP | membrane assembly | 23/4623 | 50/18723 | 8.33e-04 | 7.27e-03 | 23 |
| Page: 1 |
| Pathway ID | Tissue | Disease Stage | Description | Gene Ratio | Bg Ratio | pvalue | p.adjust | qvalue | Count |
| Page: 1 |
Top |
Cell-cell communication analysis |
| Identification of potential cell-cell interactions between two cell types and their ligand-receptor pairs for different disease states |
| Ligand | Receptor | LRpair | Pathway | Tissue | Disease Stage |
| Page: 1 |
Top |
Single-cell gene regulatory network inference analysis |
| Find out the significant the regulons (TFs) and the target genes of each regulon across cell types for different disease states |
| TF | Cell Type | Tissue | Disease Stage | Target Gene | RSS | Regulon Activity |
| ∗The dot plots of a searched regulon are shown for all cell subpopulations in each disease state of each tissue based on the regulon specific score inferred using pySCENIC and by calculating the average expression. |
| Page: 1 |
Top |
Somatic mutation of malignant transformation related genes |
| Annotation of somatic variants for genes involved in malignant transformation |
| Hugo Symbol | Variant Class | Variant Classification | dbSNP RS | HGVSc | HGVSp | HGVSp Short | SWISSPROT | BIOTYPE | SIFT | PolyPhen | Tumor Sample Barcode | Tissue | Histology | Sex | Age | Stage | Therapy Types | Drugs | Outcome |
| TLCD2 | insertion | Frame_Shift_Ins | novel | c.729_730insG | p.Thr244AspfsTer6 | p.T244Dfs*6 | A6NGC4 | protein_coding | TCGA-EK-A2PI-01 | Cervix | cervical & endocervical cancer | Female | <65 | III/IV | Unknown | Unknown | SD | ||
| TLCD2 | SNV | Missense_Mutation | novel | c.742N>T | p.Arg248Cys | p.R248C | A6NGC4 | protein_coding | tolerated(0.28) | benign(0) | TCGA-4E-A92E-01 | Endometrium | uterine corpus endometrioid carcinoma | Female | <65 | I/II | Unknown | Unknown | SD |
| TLCD2 | SNV | Missense_Mutation | c.765C>A | p.Ser255Arg | p.S255R | A6NGC4 | protein_coding | tolerated_low_confidence(1) | benign(0) | TCGA-B5-A0JY-01 | Endometrium | uterine corpus endometrioid carcinoma | Female | <65 | III/IV | Chemotherapy | doxorubicin | SD | |
| TLCD2 | SNV | Missense_Mutation | novel | c.626C>T | p.Thr209Ile | p.T209I | A6NGC4 | protein_coding | tolerated(1) | possibly_damaging(0.607) | TCGA-EY-A2OM-01 | Endometrium | uterine corpus endometrioid carcinoma | Female | <65 | I/II | Chemotherapy | taxol | SD |
| TLCD2 | SNV | Missense_Mutation | novel | c.604N>A | p.Leu202Met | p.L202M | A6NGC4 | protein_coding | deleterious(0.03) | probably_damaging(0.909) | TCGA-FI-A2F4-01 | Endometrium | uterine corpus endometrioid carcinoma | Female | <65 | I/II | Unknown | Unknown | SD |
| Page: 1 |
Top |
Related drugs of malignant transformation related genes |
| Identification of chemicals and drugs interact with genes involved in malignant transfromation |
| (DGIdb 4.0) |
| Entrez ID | Symbol | Category | Interaction Types | Drug Claim Name | Drug Name | PMIDs |
| Page: 1 |

Copyright 2023-Present -The University of Texas Health Science Center at Houston |