
|
|||||
|
 | |
| |
| |
| |
| |
| |
|
Gene: TLCD1 |
Gene summary for TLCD1 |
| Gene information | Species | Human | Gene symbol | TLCD1 | Gene ID | 116238 |
| Gene name | TLC domain containing 1 | |
| Gene Alias | TLCD1 | |
| Cytomap | 17q11.2 | |
| Gene Type | protein-coding | GO ID | GO:0007009 | UniProtAcc | Q96CP7 |
Top |
Malignant transformation analysis |
| Identification of the aberrant gene expression in precancerous and cancerous lesions by comparing the gene expression of stem-like cells in diseased tissues with normal stem cells |
| Entrez ID | Symbol | Replicates | Species | Organ | Tissue | Adj P-value | Log2FC | Malignancy |
| 116238 | TLCD1 | LZE24T | Human | Esophagus | ESCC | 3.74e-16 | 4.42e-01 | 0.0596 |
| 116238 | TLCD1 | P1T-E | Human | Esophagus | ESCC | 9.22e-07 | 3.73e-01 | 0.0875 |
| 116238 | TLCD1 | P2T-E | Human | Esophagus | ESCC | 2.64e-17 | 2.04e-01 | 0.1177 |
| 116238 | TLCD1 | P4T-E | Human | Esophagus | ESCC | 1.12e-29 | 6.65e-01 | 0.1323 |
| 116238 | TLCD1 | P5T-E | Human | Esophagus | ESCC | 1.33e-12 | 2.59e-01 | 0.1327 |
| 116238 | TLCD1 | P8T-E | Human | Esophagus | ESCC | 2.67e-03 | 5.51e-02 | 0.0889 |
| 116238 | TLCD1 | P9T-E | Human | Esophagus | ESCC | 4.51e-12 | 3.53e-01 | 0.1131 |
| 116238 | TLCD1 | P10T-E | Human | Esophagus | ESCC | 9.79e-04 | 3.17e-02 | 0.116 |
| 116238 | TLCD1 | P11T-E | Human | Esophagus | ESCC | 1.90e-11 | 4.40e-01 | 0.1426 |
| 116238 | TLCD1 | P12T-E | Human | Esophagus | ESCC | 5.71e-07 | 2.52e-01 | 0.1122 |
| 116238 | TLCD1 | P15T-E | Human | Esophagus | ESCC | 5.25e-11 | 2.74e-01 | 0.1149 |
| 116238 | TLCD1 | P16T-E | Human | Esophagus | ESCC | 1.10e-07 | 1.21e-01 | 0.1153 |
| 116238 | TLCD1 | P17T-E | Human | Esophagus | ESCC | 1.03e-02 | 1.32e-01 | 0.1278 |
| 116238 | TLCD1 | P20T-E | Human | Esophagus | ESCC | 5.66e-06 | 1.40e-01 | 0.1124 |
| 116238 | TLCD1 | P21T-E | Human | Esophagus | ESCC | 1.78e-25 | 5.42e-01 | 0.1617 |
| 116238 | TLCD1 | P22T-E | Human | Esophagus | ESCC | 6.92e-14 | 2.92e-01 | 0.1236 |
| 116238 | TLCD1 | P23T-E | Human | Esophagus | ESCC | 5.19e-21 | 5.51e-01 | 0.108 |
| 116238 | TLCD1 | P24T-E | Human | Esophagus | ESCC | 2.70e-10 | 3.86e-01 | 0.1287 |
| 116238 | TLCD1 | P26T-E | Human | Esophagus | ESCC | 5.81e-10 | 1.31e-01 | 0.1276 |
| 116238 | TLCD1 | P27T-E | Human | Esophagus | ESCC | 5.04e-06 | 8.48e-02 | 0.1055 |
| Page: 1 2 3 4 5 |
| Tissue | Expression Dynamics | Abbreviation |
| Esophagus |  | ESCC: Esophageal squamous cell carcinoma |
| HGIN: High-grade intraepithelial neoplasias | ||
| LGIN: Low-grade intraepithelial neoplasias | ||
| Liver |  | HCC: Hepatocellular carcinoma |
| NAFLD: Non-alcoholic fatty liver disease | ||
| Oral Cavity | 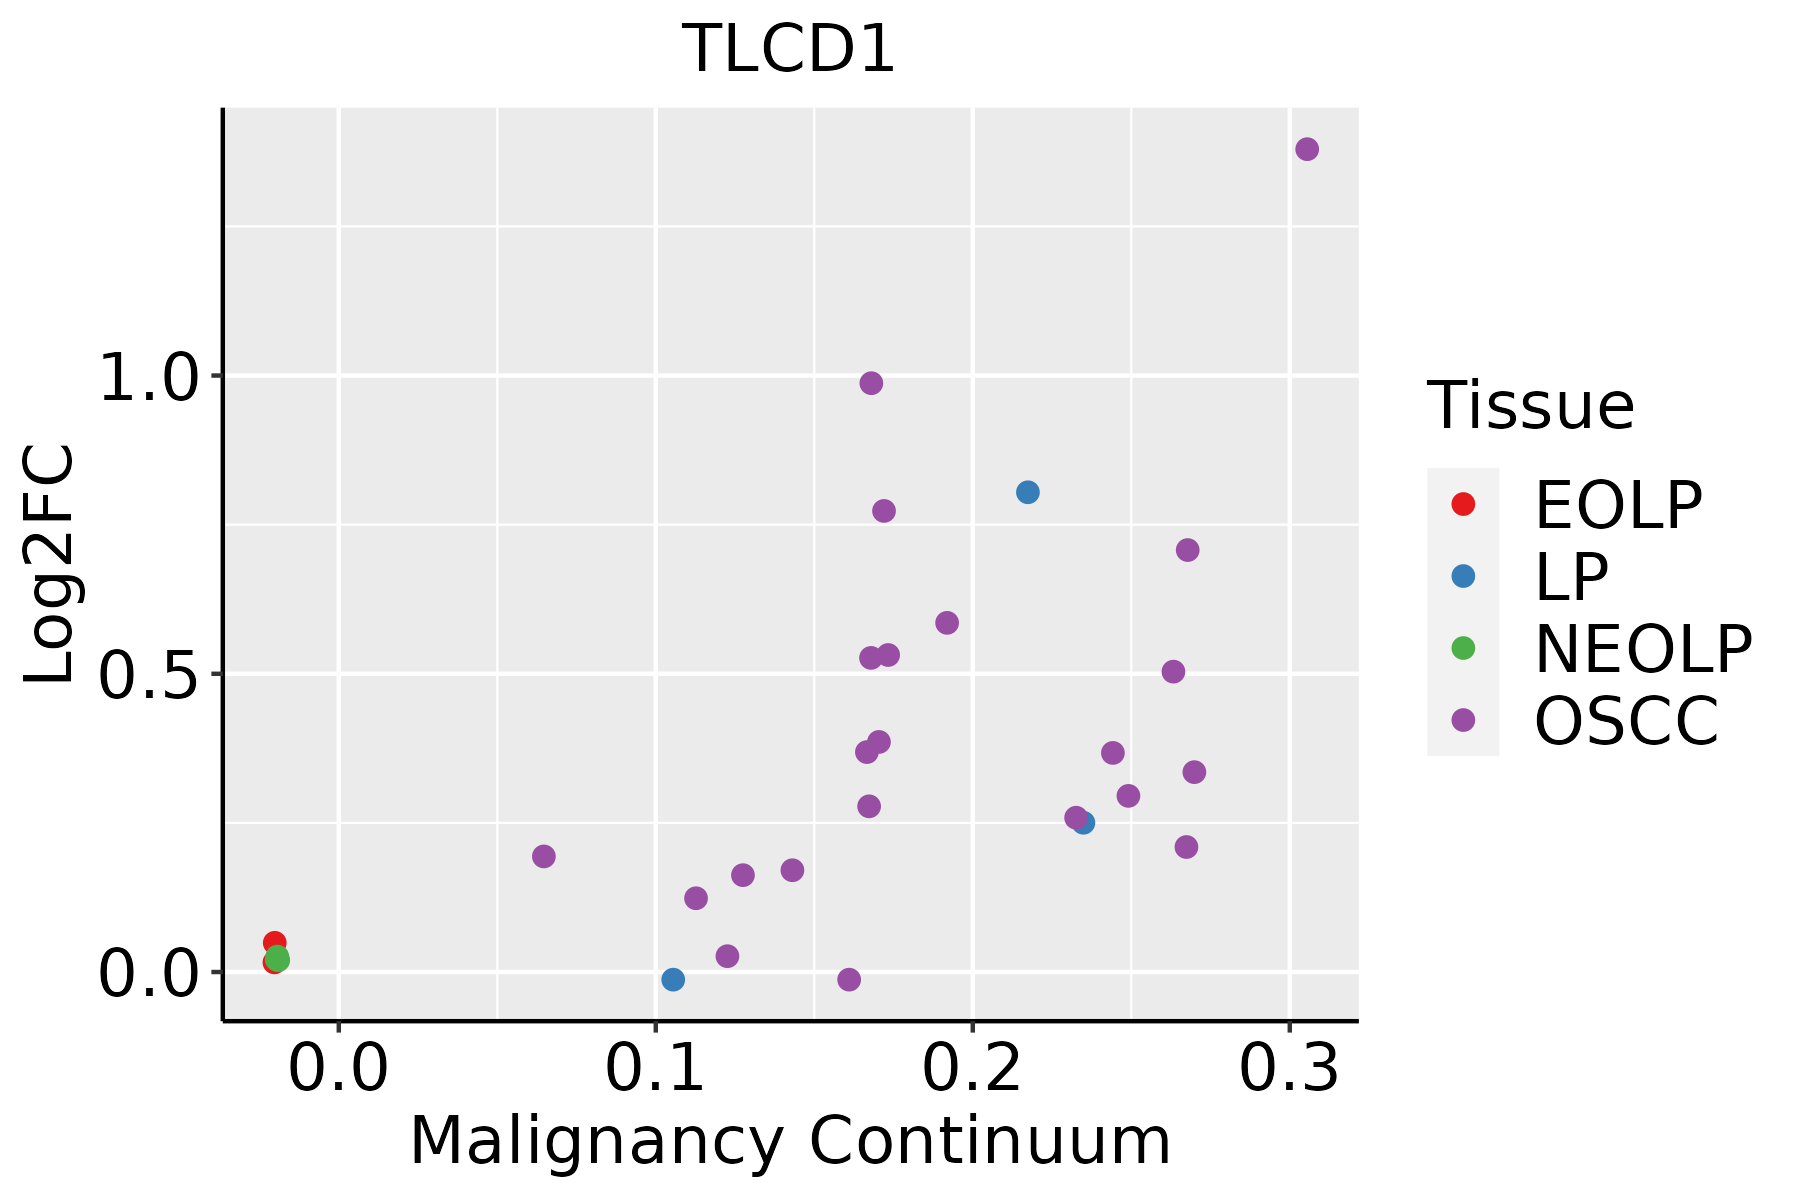 | EOLP: Erosive Oral lichen planus |
| LP: leukoplakia | ||
| NEOLP: Non-erosive oral lichen planus | ||
| OSCC: Oral squamous cell carcinoma |
| ∗log2FC in expression of this searched gene in stem-like cells from each diseased tissue sample relative to stem-like cells in normal samples in each tissue plotted against the malignancy continuum. Samples are colored based on if they are from different disease stage. |
Top |
Malignant transformation related pathway analysis |
| Find out the enriched GO biological processes and KEGG pathways involved in transition from healthy to precancer to cancer |
| Tissue | Disease Stage | Enriched GO biological Processes |
| Colorectum | AD |  |
| Colorectum | SER |  |
| Colorectum | MSS |  |
| Colorectum | MSI-H |  |
| Colorectum | FAP |  |
| ∗Top 15 enriched GO BP terms are showed in the bar plot of each disease state in each tissue. Each row represents a significant GO biological process which is colored according to the -log10(p.adjust). |
| Page: 1 2 3 4 5 6 7 8 9 |
| GO ID | Tissue | Disease Stage | Description | Gene Ratio | Bg Ratio | pvalue | p.adjust | Count |
| GO:00440918 | Esophagus | ESCC | membrane biogenesis | 38/8552 | 55/18723 | 3.78e-04 | 2.19e-03 | 38 |
| GO:00717099 | Esophagus | ESCC | membrane assembly | 35/8552 | 50/18723 | 4.33e-04 | 2.44e-03 | 35 |
| GO:00550882 | Liver | HCC | lipid homeostasis | 103/7958 | 167/18723 | 4.27e-07 | 7.18e-06 | 103 |
| GO:004409111 | Liver | HCC | membrane biogenesis | 37/7958 | 55/18723 | 1.79e-04 | 1.41e-03 | 37 |
| GO:007170911 | Liver | HCC | membrane assembly | 34/7958 | 50/18723 | 2.38e-04 | 1.79e-03 | 34 |
| GO:00440917 | Oral cavity | OSCC | membrane biogenesis | 35/7305 | 55/18723 | 1.88e-04 | 1.27e-03 | 35 |
| GO:00717098 | Oral cavity | OSCC | membrane assembly | 32/7305 | 50/18723 | 3.02e-04 | 1.89e-03 | 32 |
| GO:004409113 | Oral cavity | LP | membrane biogenesis | 25/4623 | 55/18723 | 6.27e-04 | 5.71e-03 | 25 |
| GO:007170913 | Oral cavity | LP | membrane assembly | 23/4623 | 50/18723 | 8.33e-04 | 7.27e-03 | 23 |
| Page: 1 |
| Pathway ID | Tissue | Disease Stage | Description | Gene Ratio | Bg Ratio | pvalue | p.adjust | qvalue | Count |
| Page: 1 |
Top |
Cell-cell communication analysis |
| Identification of potential cell-cell interactions between two cell types and their ligand-receptor pairs for different disease states |
| Ligand | Receptor | LRpair | Pathway | Tissue | Disease Stage |
| Page: 1 |
Top |
Single-cell gene regulatory network inference analysis |
| Find out the significant the regulons (TFs) and the target genes of each regulon across cell types for different disease states |
| TF | Cell Type | Tissue | Disease Stage | Target Gene | RSS | Regulon Activity |
| ∗The dot plots of a searched regulon are shown for all cell subpopulations in each disease state of each tissue based on the regulon specific score inferred using pySCENIC and by calculating the average expression. |
| Page: 1 |
Top |
Somatic mutation of malignant transformation related genes |
| Annotation of somatic variants for genes involved in malignant transformation |
| Hugo Symbol | Variant Class | Variant Classification | dbSNP RS | HGVSc | HGVSp | HGVSp Short | SWISSPROT | BIOTYPE | SIFT | PolyPhen | Tumor Sample Barcode | Tissue | Histology | Sex | Age | Stage | Therapy Types | Drugs | Outcome |
| TLCD1 | SNV | Missense_Mutation | novel | c.208C>G | p.Pro70Ala | p.P70A | Q96CP7 | protein_coding | deleterious(0) | probably_damaging(0.999) | TCGA-GM-A2DH-01 | Breast | breast invasive carcinoma | Female | <65 | I/II | Chemotherapy | taxol | CR |
| TLCD1 | SNV | Missense_Mutation | novel | c.326N>A | p.Arg109Gln | p.R109Q | Q96CP7 | protein_coding | tolerated(0.08) | benign(0.127) | TCGA-C5-A7X5-01 | Cervix | cervical & endocervical cancer | Female | >=65 | I/II | Chemotherapy | carboplatin | PD |
| TLCD1 | SNV | Missense_Mutation | novel | c.651N>C | p.Met217Ile | p.M217I | Q96CP7 | protein_coding | deleterious(0) | benign(0.372) | TCGA-VS-A8QF-01 | Cervix | cervical & endocervical cancer | Female | <65 | I/II | Chemotherapy | cisplatin | CR |
| TLCD1 | SNV | Missense_Mutation | rs148558266 | c.679C>T | p.Arg227Cys | p.R227C | Q96CP7 | protein_coding | deleterious(0) | probably_damaging(0.987) | TCGA-CK-4951-01 | Colorectum | colon adenocarcinoma | Female | >=65 | I/II | Unknown | Unknown | PD |
| TLCD1 | SNV | Missense_Mutation | novel | c.468N>T | p.Met156Ile | p.M156I | Q96CP7 | protein_coding | tolerated(0.14) | benign(0.021) | TCGA-F5-6814-01 | Colorectum | rectum adenocarcinoma | Male | <65 | I/II | Unknown | Unknown | SD |
| TLCD1 | SNV | Missense_Mutation | rs748842622 | c.670N>T | p.Arg224Cys | p.R224C | Q96CP7 | protein_coding | deleterious(0) | probably_damaging(0.998) | TCGA-A5-A0VP-01 | Endometrium | uterine corpus endometrioid carcinoma | Female | >=65 | I/II | Unknown | Unknown | SD |
| TLCD1 | SNV | Missense_Mutation | c.485N>T | p.Ala162Val | p.A162V | Q96CP7 | protein_coding | tolerated(0.83) | benign(0.006) | TCGA-AP-A059-01 | Endometrium | uterine corpus endometrioid carcinoma | Female | >=65 | I/II | Unknown | Unknown | SD | |
| TLCD1 | SNV | Missense_Mutation | novel | c.467N>C | p.Met156Thr | p.M156T | Q96CP7 | protein_coding | deleterious(0) | possibly_damaging(0.564) | TCGA-AX-A2HA-01 | Endometrium | uterine corpus endometrioid carcinoma | Female | <65 | I/II | Unknown | Unknown | SD |
| TLCD1 | SNV | Missense_Mutation | rs868373791 | c.359N>C | p.Met120Thr | p.M120T | Q96CP7 | protein_coding | deleterious(0.01) | benign(0.059) | TCGA-B5-A0K9-01 | Endometrium | uterine corpus endometrioid carcinoma | Female | >=65 | I/II | Unknown | Unknown | SD |
| TLCD1 | SNV | Missense_Mutation | rs780204233 | c.460N>T | p.Arg154Cys | p.R154C | Q96CP7 | protein_coding | deleterious(0) | probably_damaging(1) | TCGA-B5-A11E-01 | Endometrium | uterine corpus endometrioid carcinoma | Female | <65 | I/II | Unknown | Unknown | SD |
| Page: 1 2 3 |
Top |
Related drugs of malignant transformation related genes |
| Identification of chemicals and drugs interact with genes involved in malignant transfromation |
| (DGIdb 4.0) |
| Entrez ID | Symbol | Category | Interaction Types | Drug Claim Name | Drug Name | PMIDs |
| Page: 1 |

Copyright 2023-Present -The University of Texas Health Science Center at Houston |