
|
|||||
|
 | |
| |
| |
| |
| |
| |
|
Gene: TKTL1 |
Gene summary for TKTL1 |
| Gene information | Species | Human | Gene symbol | TKTL1 | Gene ID | 8277 |
| Gene name | transketolase like 1 | |
| Gene Alias | TKR | |
| Cytomap | Xq28 | |
| Gene Type | protein-coding | GO ID | GO:0005975 | UniProtAcc | B7Z7I0 |
Top |
Malignant transformation analysis |
| Identification of the aberrant gene expression in precancerous and cancerous lesions by comparing the gene expression of stem-like cells in diseased tissues with normal stem cells |
| Entrez ID | Symbol | Replicates | Species | Organ | Tissue | Adj P-value | Log2FC | Malignancy |
| 8277 | TKTL1 | Tumor | Human | Cervix | CC | 4.67e-35 | 5.83e-01 | 0.1241 |
| 8277 | TKTL1 | sample3 | Human | Cervix | CC | 1.14e-39 | 5.62e-01 | 0.1387 |
| 8277 | TKTL1 | T3 | Human | Cervix | CC | 1.49e-37 | 4.99e-01 | 0.1389 |
| 8277 | TKTL1 | HCC2 | Human | Liver | HCC | 6.78e-79 | 6.86e+00 | 0.5341 |
| 8277 | TKTL1 | S014 | Human | Liver | HCC | 1.47e-02 | 6.25e-01 | 0.2254 |
| 8277 | TKTL1 | ATC13 | Human | Thyroid | ATC | 1.39e-92 | 2.49e+00 | 0.34 |
| 8277 | TKTL1 | ATC5 | Human | Thyroid | ATC | 1.23e-94 | 2.62e+00 | 0.34 |
| Page: 1 |
| Tissue | Expression Dynamics | Abbreviation |
| Cervix | 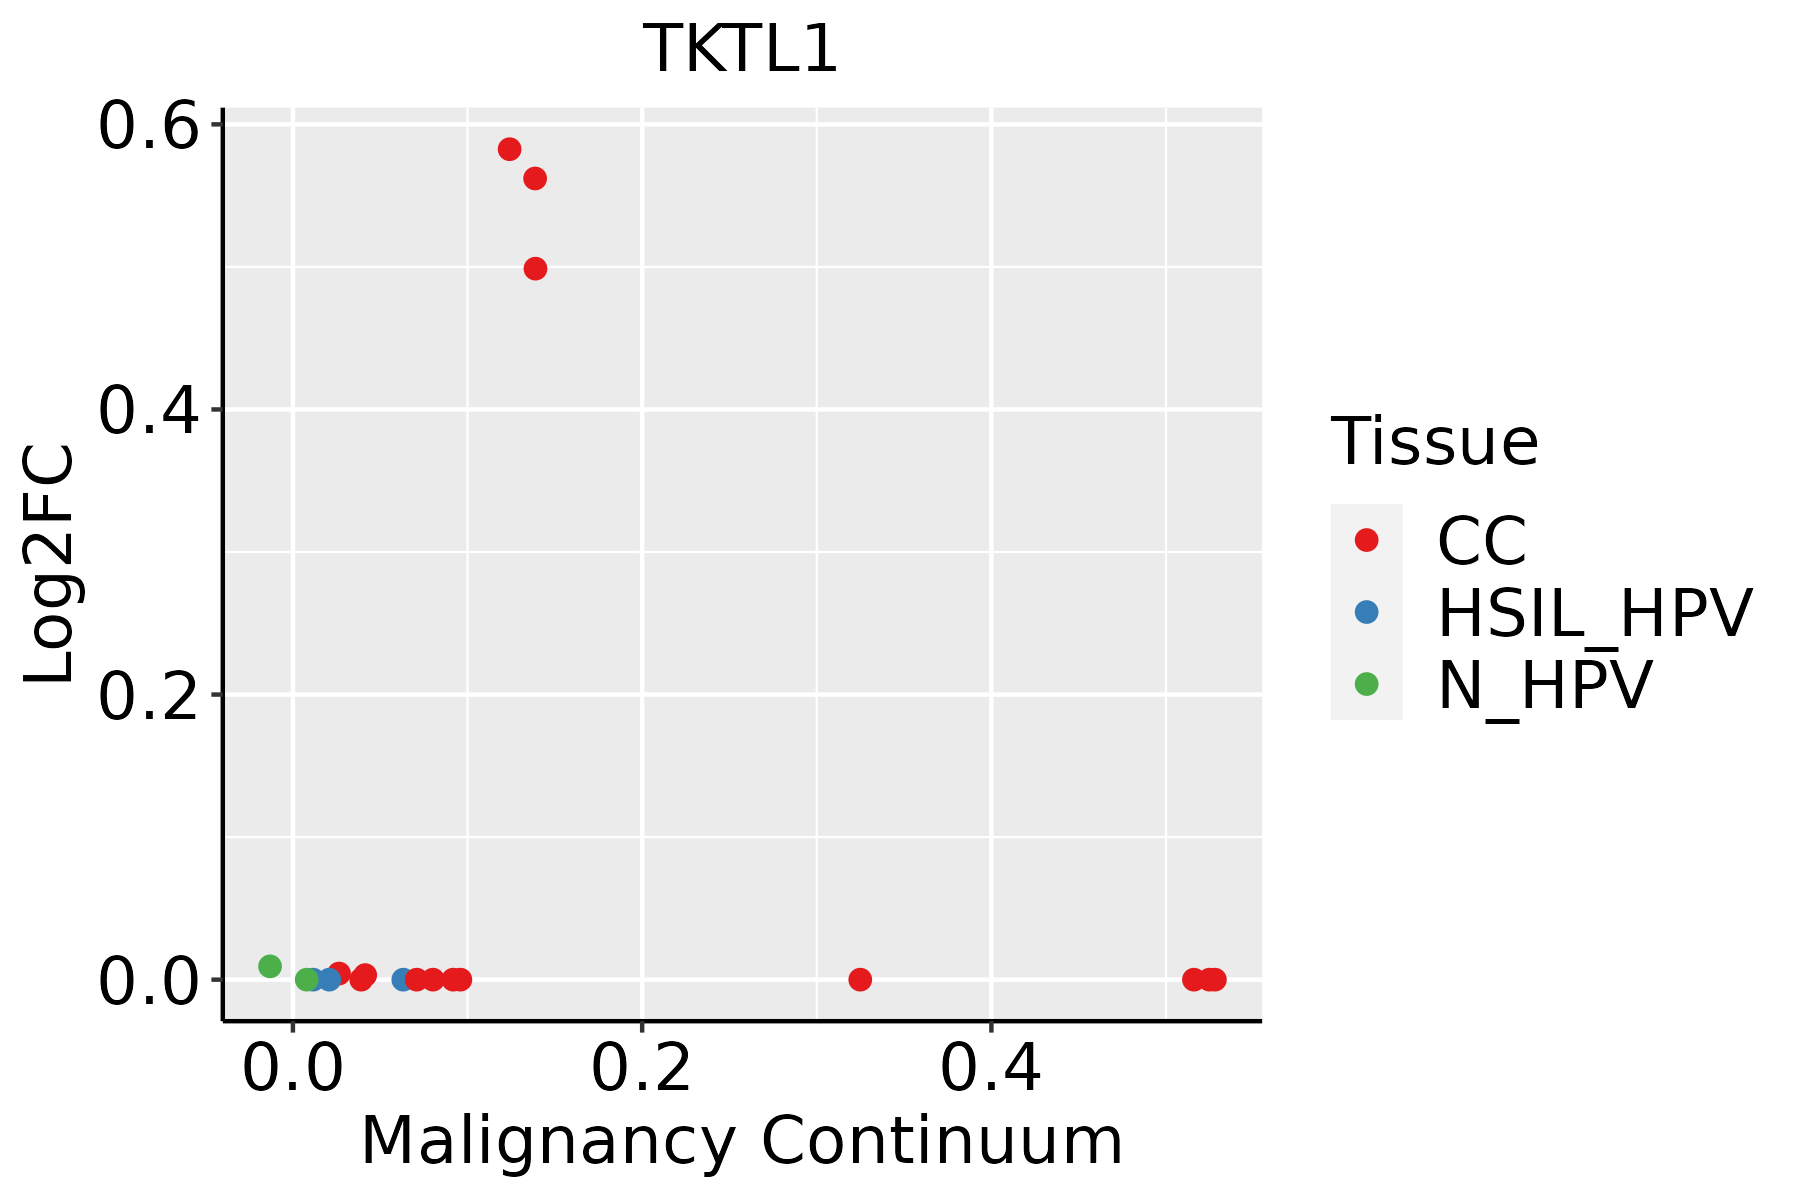 | CC: Cervix cancer |
| HSIL_HPV: HPV-infected high-grade squamous intraepithelial lesions | ||
| N_HPV: HPV-infected normal cervix | ||
| Liver | 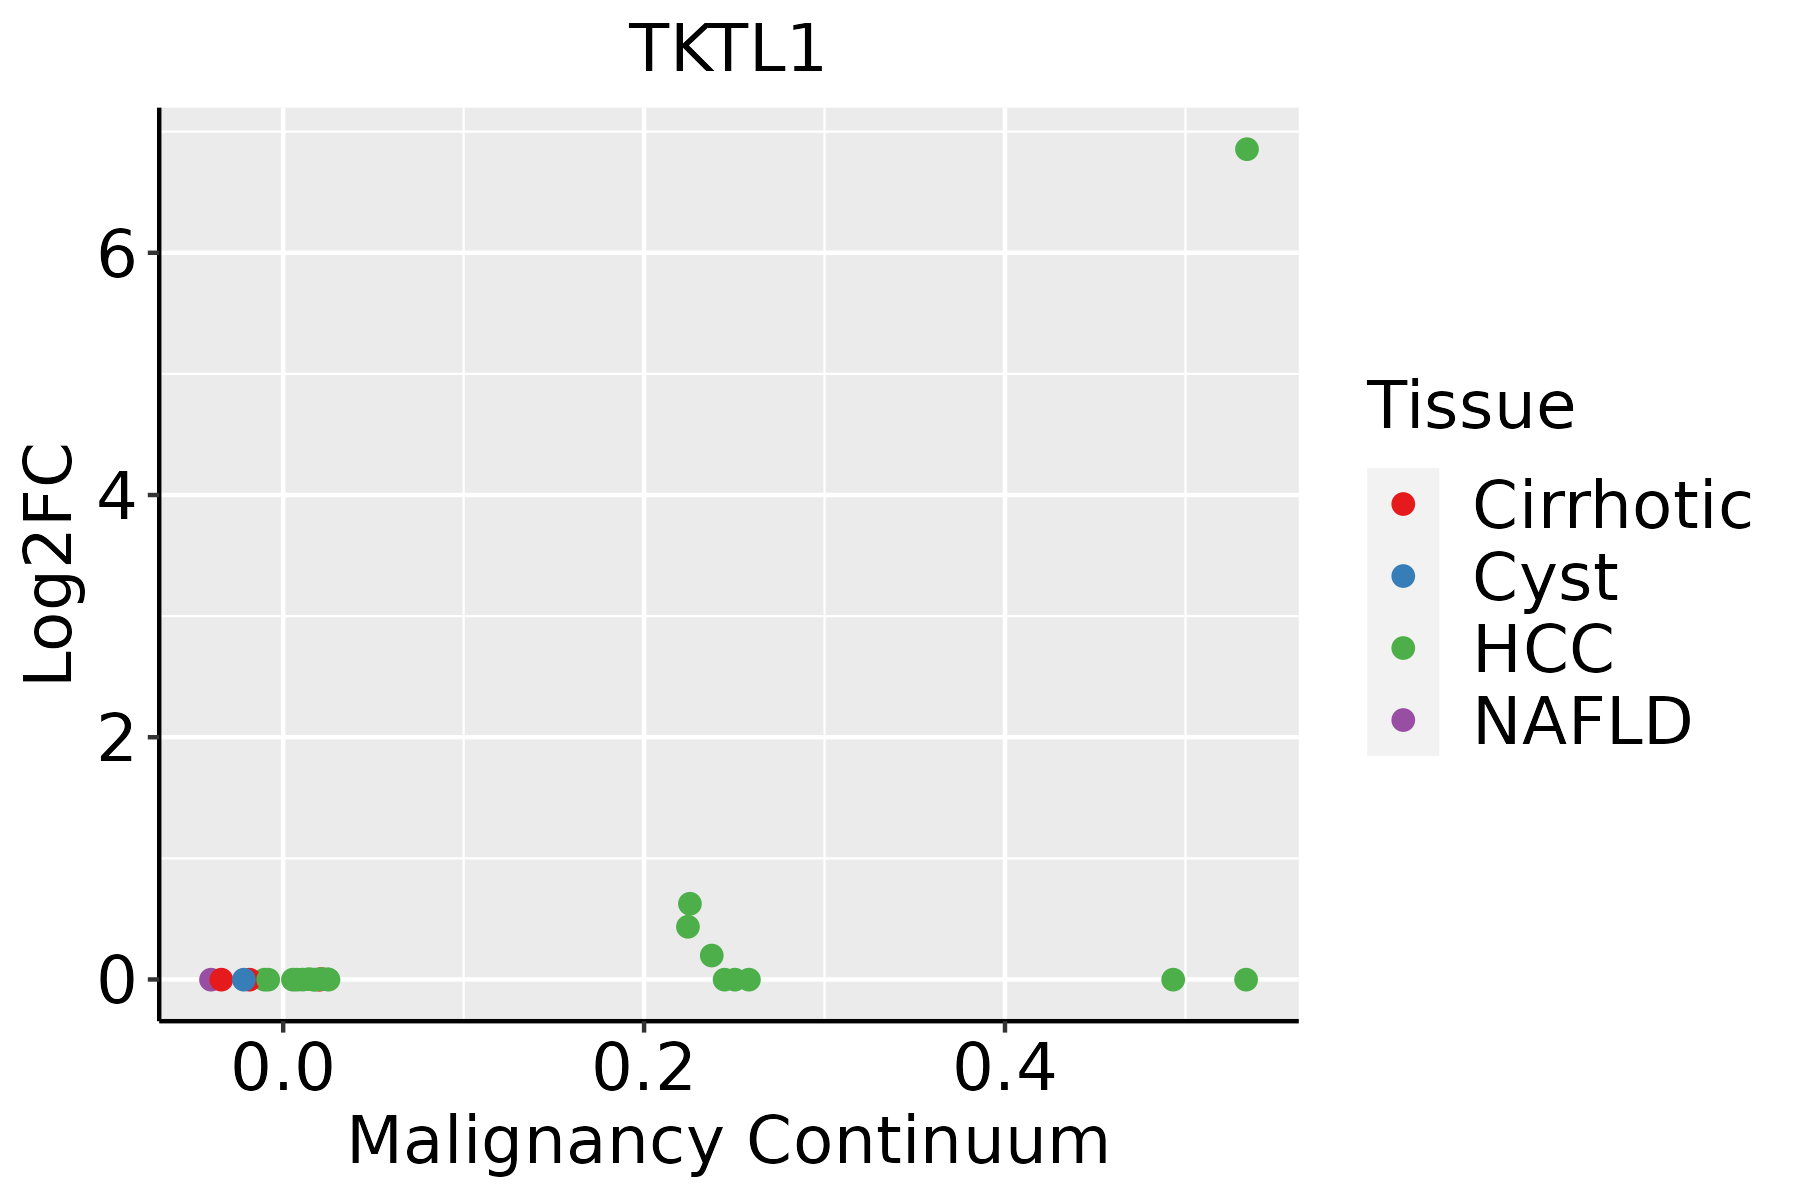 | HCC: Hepatocellular carcinoma |
| NAFLD: Non-alcoholic fatty liver disease | ||
| Thyroid |  | ATC: Anaplastic thyroid cancer |
| HT: Hashimoto's thyroiditis | ||
| PTC: Papillary thyroid cancer |
| ∗log2FC in expression of this searched gene in stem-like cells from each diseased tissue sample relative to stem-like cells in normal samples in each tissue plotted against the malignancy continuum. Samples are colored based on if they are from different disease stage. |
Top |
Malignant transformation related pathway analysis |
| Find out the enriched GO biological processes and KEGG pathways involved in transition from healthy to precancer to cancer |
| Tissue | Disease Stage | Enriched GO biological Processes |
| Colorectum | AD |  |
| Colorectum | SER |  |
| Colorectum | MSS |  |
| Colorectum | MSI-H |  |
| Colorectum | FAP |  |
| ∗Top 15 enriched GO BP terms are showed in the bar plot of each disease state in each tissue. Each row represents a significant GO biological process which is colored according to the -log10(p.adjust). |
| Page: 1 2 3 4 5 6 7 8 9 |
| GO ID | Tissue | Disease Stage | Description | Gene Ratio | Bg Ratio | pvalue | p.adjust | Count |
| GO:000679021 | Liver | HCC | sulfur compound metabolic process | 212/7958 | 339/18723 | 5.60e-14 | 3.39e-12 | 212 |
| GO:000599621 | Liver | HCC | monosaccharide metabolic process | 167/7958 | 257/18723 | 2.31e-13 | 1.25e-11 | 167 |
| GO:001931821 | Liver | HCC | hexose metabolic process | 155/7958 | 237/18723 | 7.63e-13 | 3.90e-11 | 155 |
| GO:004428221 | Liver | HCC | small molecule catabolic process | 225/7958 | 376/18723 | 6.50e-12 | 2.80e-10 | 225 |
| GO:000600621 | Liver | HCC | glucose metabolic process | 128/7958 | 196/18723 | 8.60e-11 | 3.06e-09 | 128 |
| GO:000606621 | Liver | HCC | alcohol metabolic process | 208/7958 | 353/18723 | 2.80e-10 | 9.50e-09 | 208 |
| GO:001605222 | Liver | HCC | carbohydrate catabolic process | 99/7958 | 154/18723 | 3.79e-08 | 8.30e-07 | 99 |
| GO:0006767 | Liver | HCC | water-soluble vitamin metabolic process | 39/7958 | 59/18723 | 2.14e-04 | 1.63e-03 | 39 |
| GO:00725271 | Liver | HCC | pyrimidine-containing compound metabolic process | 49/7958 | 82/18723 | 1.20e-03 | 6.68e-03 | 49 |
| GO:0006766 | Liver | HCC | vitamin metabolic process | 57/7958 | 106/18723 | 1.25e-02 | 4.53e-02 | 57 |
| GO:003430812 | Liver | HCC | primary alcohol metabolic process | 55/7958 | 102/18723 | 1.30e-02 | 4.67e-02 | 55 |
| GO:001931814 | Thyroid | ATC | hexose metabolic process | 111/6293 | 237/18723 | 1.51e-05 | 1.41e-04 | 111 |
| GO:000599615 | Thyroid | ATC | monosaccharide metabolic process | 118/6293 | 257/18723 | 2.56e-05 | 2.20e-04 | 118 |
| GO:000600616 | Thyroid | ATC | glucose metabolic process | 93/6293 | 196/18723 | 3.85e-05 | 3.14e-04 | 93 |
| GO:001605224 | Thyroid | ATC | carbohydrate catabolic process | 71/6293 | 154/18723 | 8.33e-04 | 4.57e-03 | 71 |
| Page: 1 |
| Pathway ID | Tissue | Disease Stage | Description | Gene Ratio | Bg Ratio | pvalue | p.adjust | qvalue | Count |
| hsa0123021 | Liver | HCC | Biosynthesis of amino acids | 53/4020 | 75/8465 | 3.79e-05 | 2.11e-04 | 1.18e-04 | 53 |
| hsa0123031 | Liver | HCC | Biosynthesis of amino acids | 53/4020 | 75/8465 | 3.79e-05 | 2.11e-04 | 1.18e-04 | 53 |
| Page: 1 |
Top |
Cell-cell communication analysis |
| Identification of potential cell-cell interactions between two cell types and their ligand-receptor pairs for different disease states |
| Ligand | Receptor | LRpair | Pathway | Tissue | Disease Stage |
| Page: 1 |
Top |
Single-cell gene regulatory network inference analysis |
| Find out the significant the regulons (TFs) and the target genes of each regulon across cell types for different disease states |
| TF | Cell Type | Tissue | Disease Stage | Target Gene | RSS | Regulon Activity |
| ∗The dot plots of a searched regulon are shown for all cell subpopulations in each disease state of each tissue based on the regulon specific score inferred using pySCENIC and by calculating the average expression. |
| Page: 1 |
Top |
Somatic mutation of malignant transformation related genes |
| Annotation of somatic variants for genes involved in malignant transformation |
| Hugo Symbol | Variant Class | Variant Classification | dbSNP RS | HGVSc | HGVSp | HGVSp Short | SWISSPROT | BIOTYPE | SIFT | PolyPhen | Tumor Sample Barcode | Tissue | Histology | Sex | Age | Stage | Therapy Types | Drugs | Outcome |
| TKTL1 | SNV | Missense_Mutation | c.158N>A | p.Ser53Tyr | p.S53Y | P51854 | protein_coding | deleterious(0.02) | possibly_damaging(0.74) | TCGA-A8-A09E-01 | Breast | breast invasive carcinoma | Female | >=65 | III/IV | Hormone Therapy | anastrozole | SD | |
| TKTL1 | SNV | Missense_Mutation | c.719N>A | p.Arg240Lys | p.R240K | P51854 | protein_coding | tolerated(0.68) | benign(0.034) | TCGA-AC-A23H-01 | Breast | breast invasive carcinoma | Female | >=65 | I/II | Unknown | Unknown | PD | |
| TKTL1 | SNV | Missense_Mutation | c.1367N>A | p.Thr456Asn | p.T456N | P51854 | protein_coding | tolerated(0.59) | benign(0.005) | TCGA-BH-A18G-01 | Breast | breast invasive carcinoma | Female | >=65 | I/II | Unknown | Unknown | SD | |
| TKTL1 | SNV | Missense_Mutation | novel | c.49N>A | p.Asp17Asn | p.D17N | P51854 | protein_coding | deleterious(0.04) | benign(0.018) | TCGA-JW-A5VL-01 | Cervix | cervical & endocervical cancer | Female | <65 | I/II | Unknown | Unknown | SD |
| TKTL1 | SNV | Missense_Mutation | c.13G>A | p.Glu5Lys | p.E5K | P51854 | protein_coding | tolerated_low_confidence(0.06) | benign(0.003) | TCGA-UC-A7PF-01 | Cervix | cervical & endocervical cancer | Female | <65 | I/II | Unknown | Unknown | SD | |
| TKTL1 | SNV | Missense_Mutation | novel | c.226N>A | p.Asp76Asn | p.D76N | P51854 | protein_coding | tolerated(0.99) | benign(0.013) | TCGA-VS-A8EC-01 | Cervix | cervical & endocervical cancer | Female | <65 | III/IV | Chemotherapy | carboplatin | CR |
| TKTL1 | SNV | Missense_Mutation | novel | c.975N>G | p.Phe325Leu | p.F325L | P51854 | protein_coding | tolerated(0.12) | benign(0.4) | TCGA-VS-A8QA-01 | Cervix | cervical & endocervical cancer | Female | <65 | I/II | Unknown | Unknown | SD |
| TKTL1 | SNV | Missense_Mutation | novel | c.361N>G | p.Phe121Val | p.F121V | P51854 | protein_coding | deleterious(0) | possibly_damaging(0.889) | TCGA-AA-3984-01 | Colorectum | colon adenocarcinoma | Female | <65 | I/II | Unknown | Unknown | SD |
| TKTL1 | SNV | Missense_Mutation | c.526C>T | p.Arg176Cys | p.R176C | P51854 | protein_coding | deleterious(0.01) | possibly_damaging(0.537) | TCGA-AZ-4315-01 | Colorectum | colon adenocarcinoma | Male | <65 | I/II | Unknown | Unknown | SD | |
| TKTL1 | SNV | Missense_Mutation | novel | c.772C>A | p.Leu258Ile | p.L258I | P51854 | protein_coding | tolerated(0.16) | benign(0.014) | TCGA-CA-6717-01 | Colorectum | colon adenocarcinoma | Male | <65 | I/II | Chemotherapy | oxaliplatin | CR |
| Page: 1 2 3 4 5 6 7 8 |
Top |
Related drugs of malignant transformation related genes |
| Identification of chemicals and drugs interact with genes involved in malignant transfromation |
| (DGIdb 4.0) |
| Entrez ID | Symbol | Category | Interaction Types | Drug Claim Name | Drug Name | PMIDs |
| Page: 1 |

Copyright 2023-Present -The University of Texas Health Science Center at Houston |