
|
|||||
|
 | |
| |
| |
| |
| |
| |
|
Gene: TKT |
Gene summary for TKT |
| Gene information | Species | Human | Gene symbol | TKT | Gene ID | 7086 |
| Gene name | transketolase | |
| Gene Alias | HEL-S-48 | |
| Cytomap | 3p21.1 | |
| Gene Type | protein-coding | GO ID | GO:0006081 | UniProtAcc | P29401 |
Top |
Malignant transformation analysis |
| Identification of the aberrant gene expression in precancerous and cancerous lesions by comparing the gene expression of stem-like cells in diseased tissues with normal stem cells |
| Entrez ID | Symbol | Replicates | Species | Organ | Tissue | Adj P-value | Log2FC | Malignancy |
| 7086 | TKT | GSM4909280 | Human | Breast | Precancer | 1.49e-03 | -7.20e-01 | 0.0305 |
| 7086 | TKT | GSM4909281 | Human | Breast | IDC | 1.18e-02 | -1.33e-01 | 0.21 |
| 7086 | TKT | GSM4909282 | Human | Breast | IDC | 1.35e-09 | -4.16e-01 | -0.0288 |
| 7086 | TKT | GSM4909285 | Human | Breast | IDC | 2.66e-10 | -2.86e-01 | 0.21 |
| 7086 | TKT | GSM4909286 | Human | Breast | IDC | 4.09e-15 | -4.10e-01 | 0.1081 |
| 7086 | TKT | GSM4909290 | Human | Breast | IDC | 4.60e-06 | -3.79e-01 | 0.2096 |
| 7086 | TKT | GSM4909291 | Human | Breast | IDC | 3.43e-06 | -5.02e-01 | 0.1753 |
| 7086 | TKT | GSM4909293 | Human | Breast | IDC | 9.90e-15 | -5.10e-01 | 0.1581 |
| 7086 | TKT | GSM4909294 | Human | Breast | IDC | 2.22e-07 | -4.75e-01 | 0.2022 |
| 7086 | TKT | GSM4909296 | Human | Breast | IDC | 4.72e-18 | -5.98e-01 | 0.1524 |
| 7086 | TKT | GSM4909297 | Human | Breast | IDC | 3.61e-11 | -4.18e-01 | 0.1517 |
| 7086 | TKT | GSM4909298 | Human | Breast | IDC | 6.47e-18 | -5.55e-01 | 0.1551 |
| 7086 | TKT | GSM4909299 | Human | Breast | IDC | 3.19e-10 | -5.20e-01 | 0.035 |
| 7086 | TKT | GSM4909300 | Human | Breast | IDC | 1.90e-04 | -4.84e-01 | 0.0334 |
| 7086 | TKT | GSM4909301 | Human | Breast | IDC | 3.86e-20 | -6.58e-01 | 0.1577 |
| 7086 | TKT | GSM4909302 | Human | Breast | IDC | 2.39e-16 | -5.90e-01 | 0.1545 |
| 7086 | TKT | GSM4909303 | Human | Breast | IDC | 1.48e-02 | -5.22e-01 | 0.0438 |
| 7086 | TKT | GSM4909304 | Human | Breast | IDC | 2.16e-02 | -4.19e-02 | 0.1636 |
| 7086 | TKT | GSM4909305 | Human | Breast | IDC | 1.35e-03 | -2.42e-01 | 0.0436 |
| 7086 | TKT | GSM4909306 | Human | Breast | IDC | 9.89e-10 | -4.82e-01 | 0.1564 |
| Page: 1 2 3 4 5 6 7 8 9 10 11 12 13 14 |
| Tissue | Expression Dynamics | Abbreviation |
| Breast | 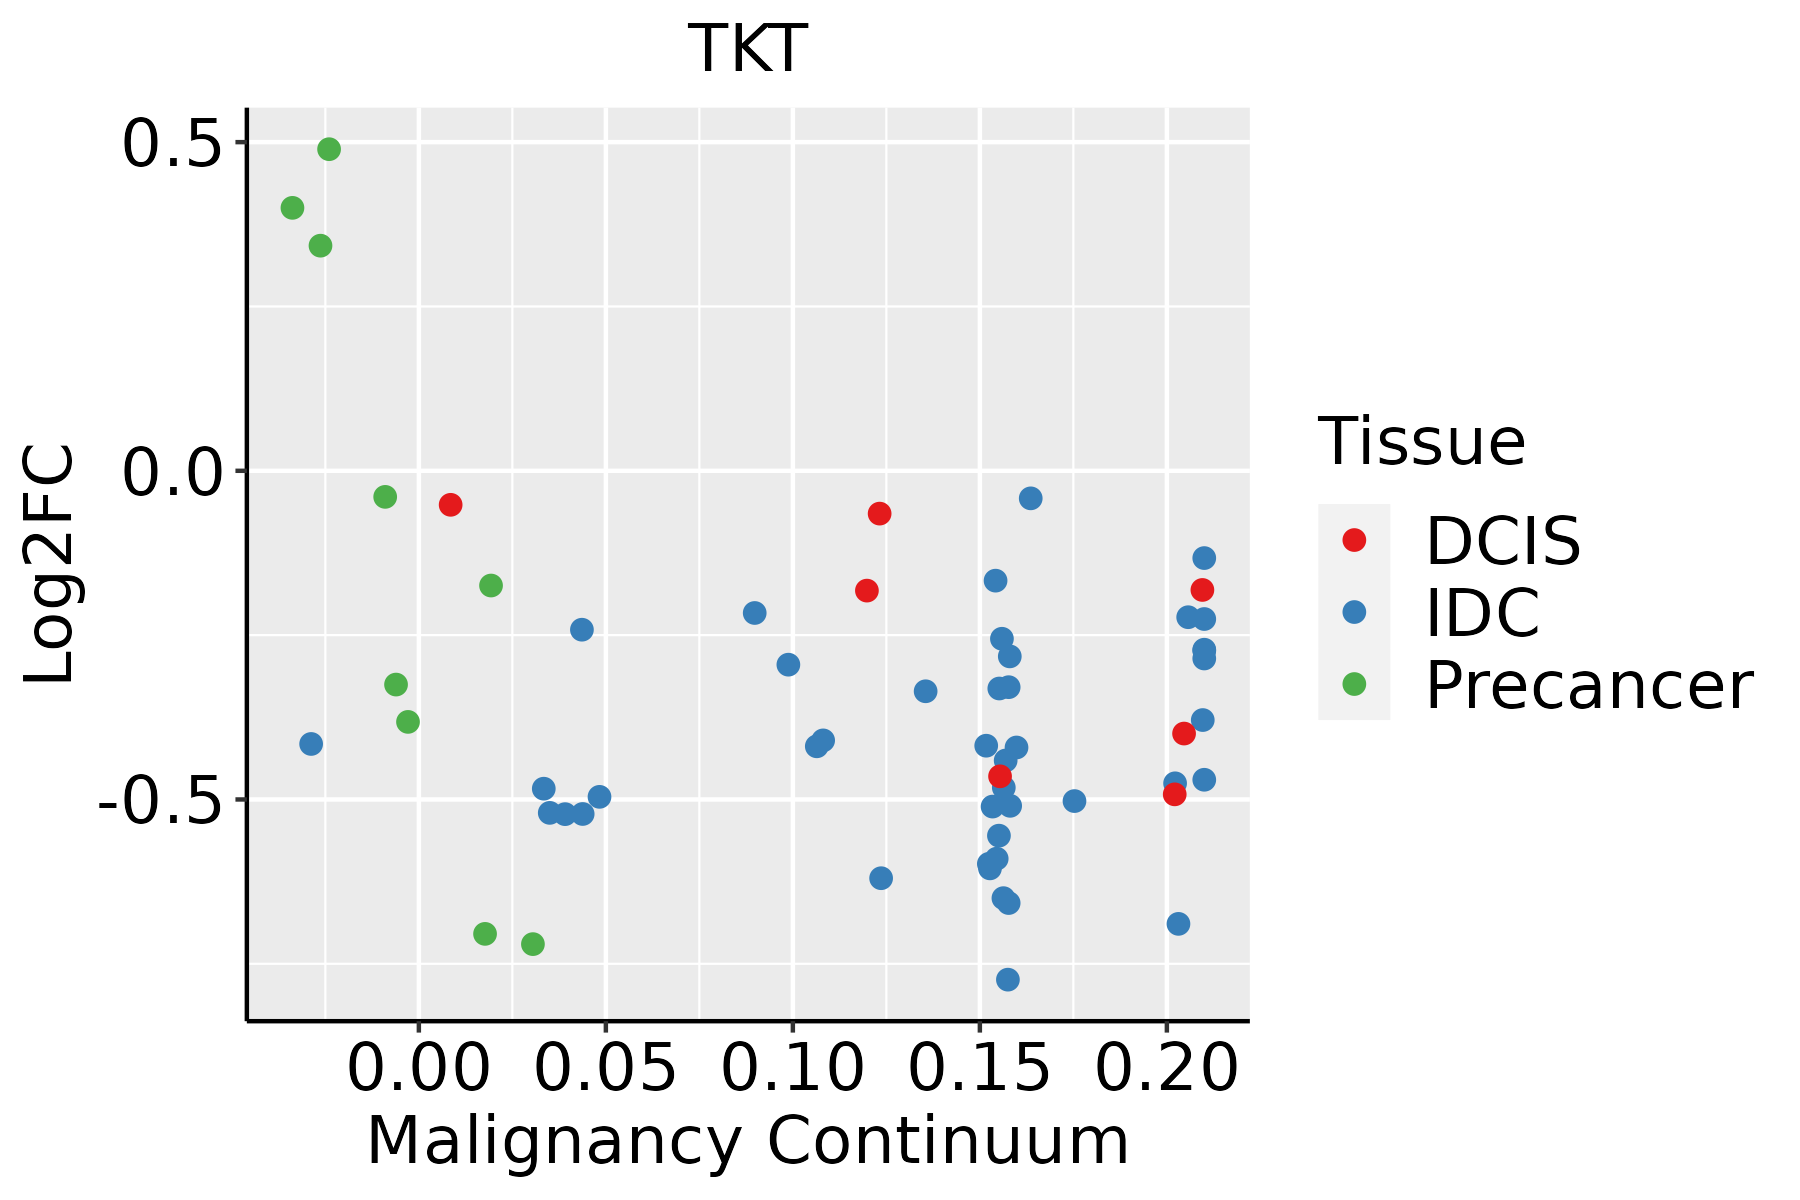 | IDC: Invasive ductal carcinoma |
| DCIS: Ductal carcinoma in situ | ||
| Precancer(BRCA1-mut): Precancerous lesion from BRCA1 mutation carriers | ||
| Cervix | 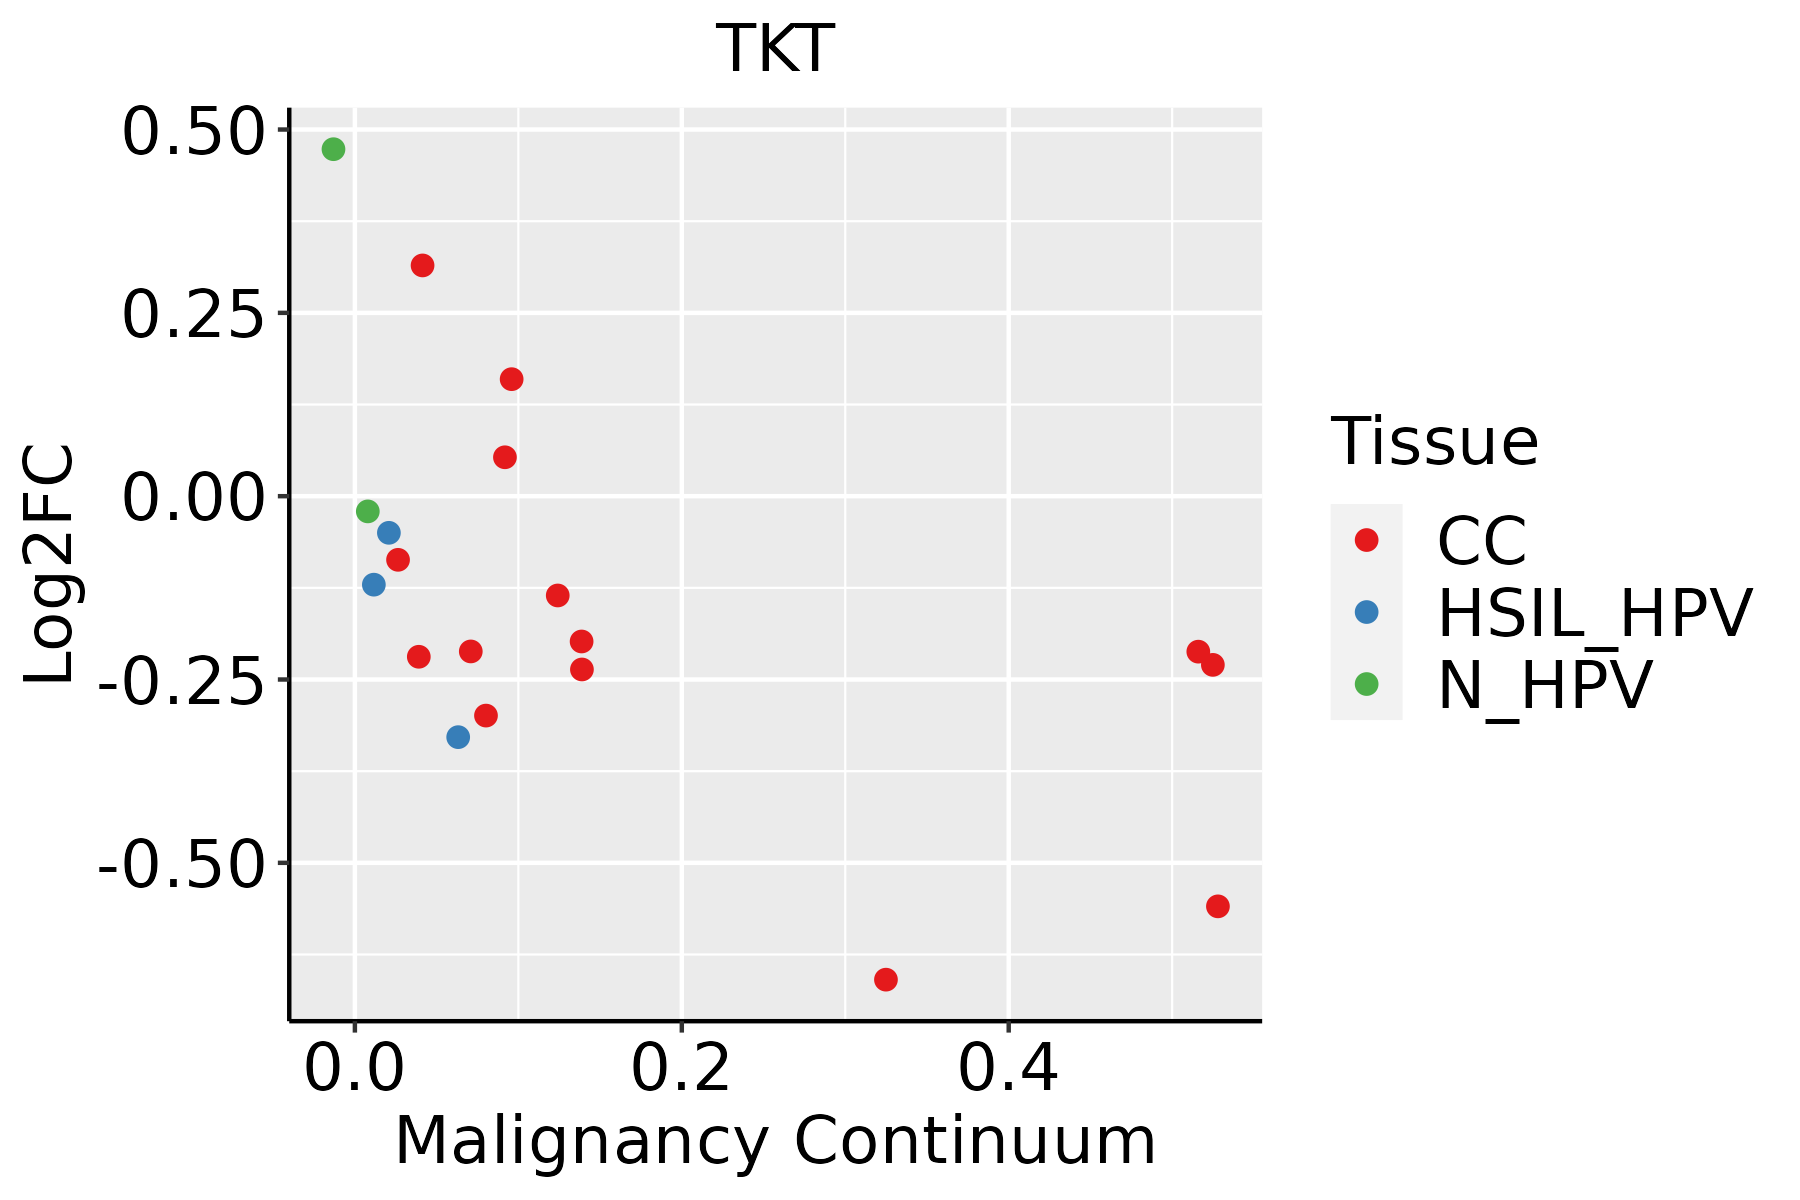 | CC: Cervix cancer |
| HSIL_HPV: HPV-infected high-grade squamous intraepithelial lesions | ||
| N_HPV: HPV-infected normal cervix | ||
| Colorectum (GSE201348) |  | FAP: Familial adenomatous polyposis |
| CRC: Colorectal cancer | ||
| Colorectum (HTA11) |  | AD: Adenomas |
| SER: Sessile serrated lesions | ||
| MSI-H: Microsatellite-high colorectal cancer | ||
| MSS: Microsatellite stable colorectal cancer | ||
| Endometrium |  | AEH: Atypical endometrial hyperplasia |
| EEC: Endometrioid Cancer | ||
| Esophagus |  | ESCC: Esophageal squamous cell carcinoma |
| HGIN: High-grade intraepithelial neoplasias | ||
| LGIN: Low-grade intraepithelial neoplasias | ||
| Liver |  | HCC: Hepatocellular carcinoma |
| NAFLD: Non-alcoholic fatty liver disease | ||
| Oral Cavity | 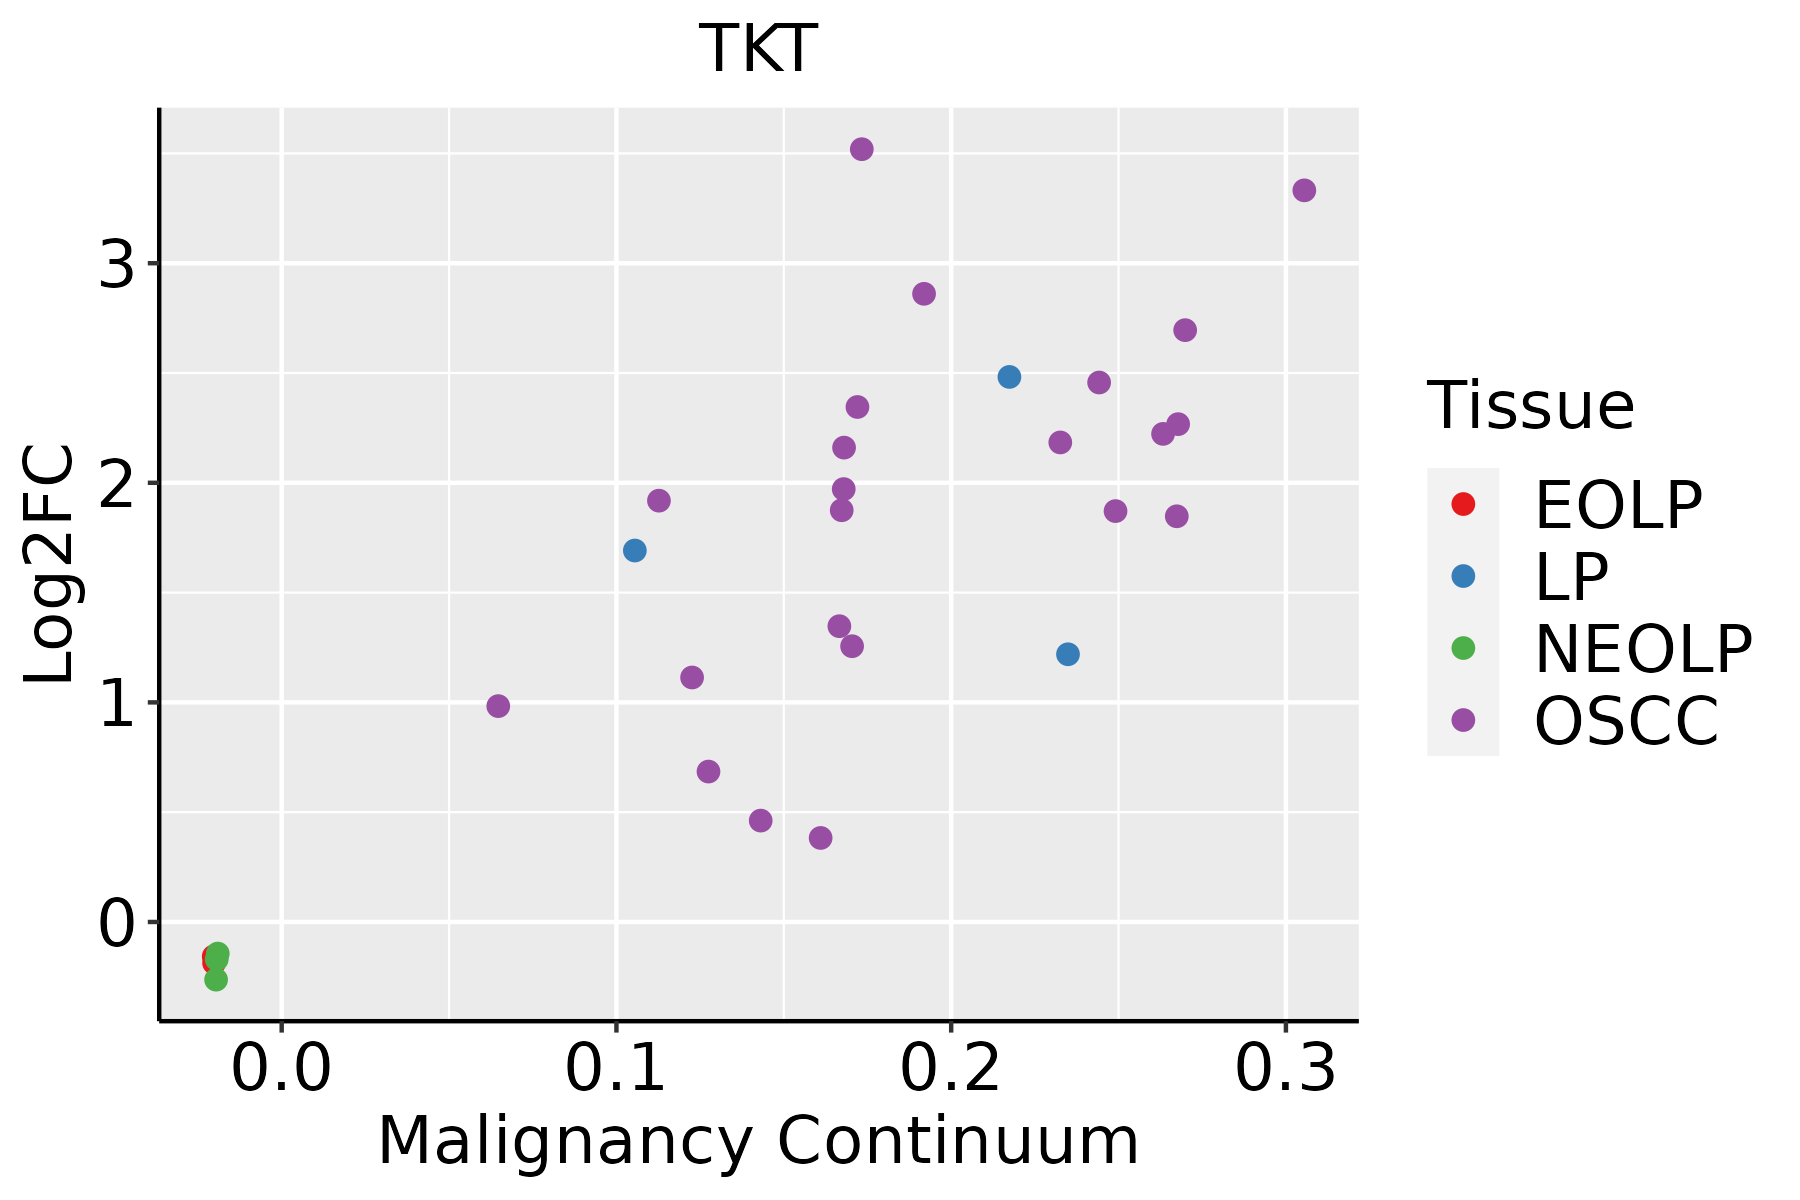 | EOLP: Erosive Oral lichen planus |
| LP: leukoplakia | ||
| NEOLP: Non-erosive oral lichen planus | ||
| OSCC: Oral squamous cell carcinoma | ||
| Prostate |  | BPH: Benign Prostatic Hyperplasia |
| Skin | 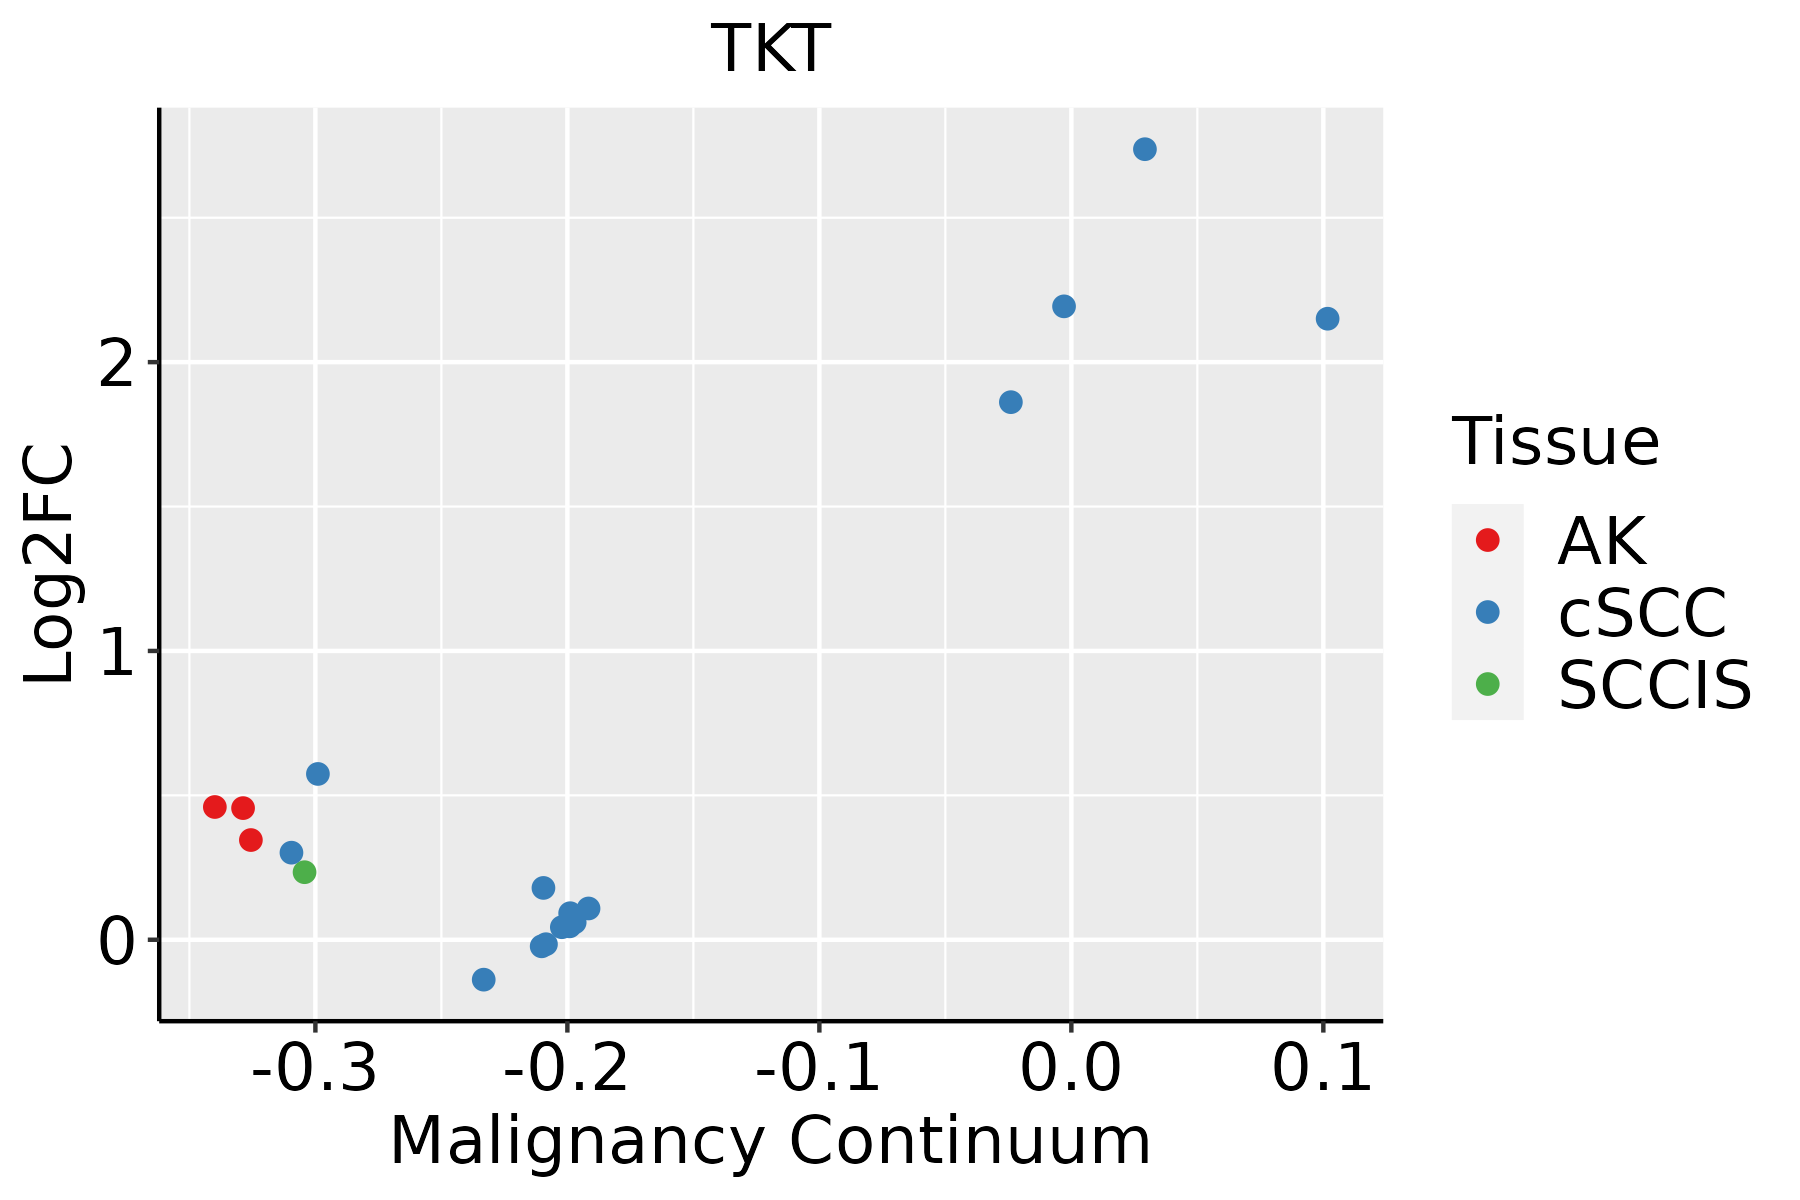 | AK: Actinic keratosis |
| cSCC: Cutaneous squamous cell carcinoma | ||
| SCCIS:squamous cell carcinoma in situ | ||
| Thyroid | 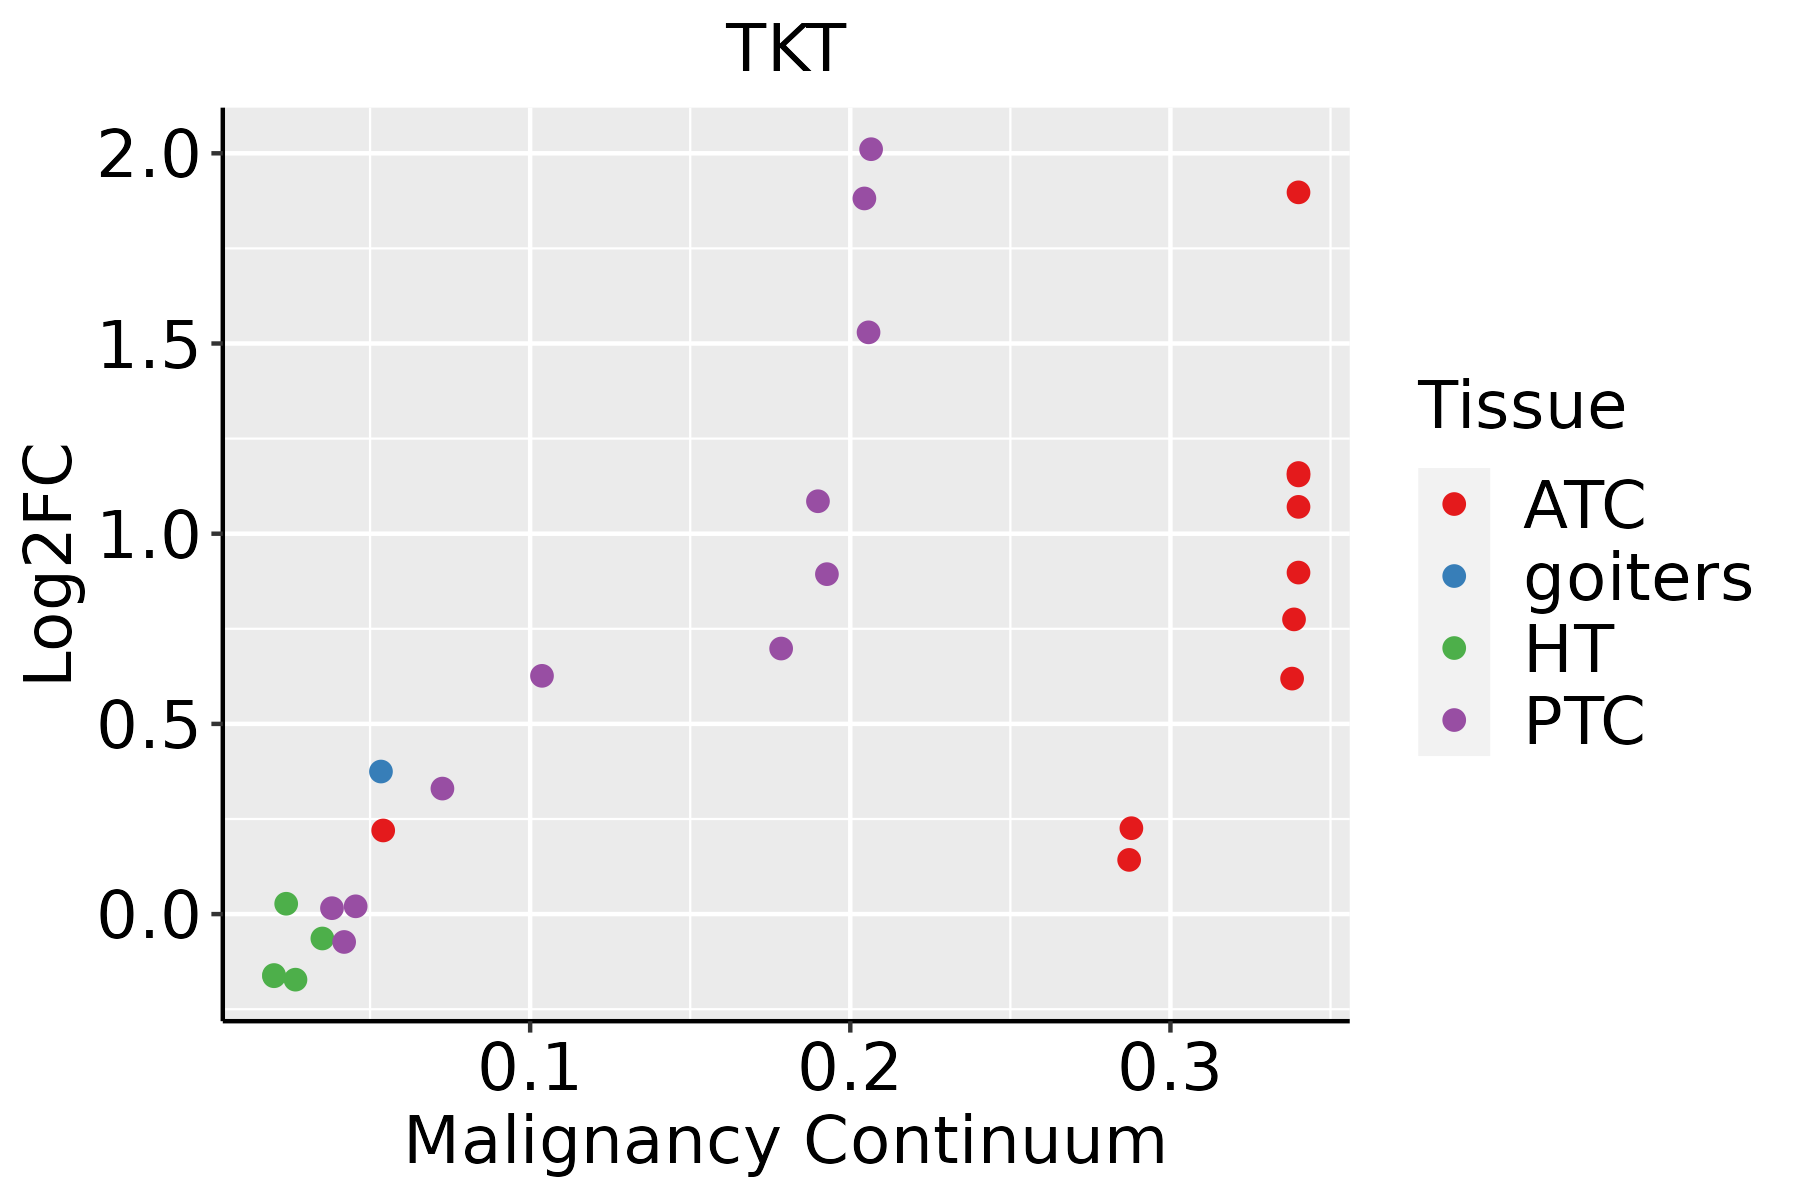 | ATC: Anaplastic thyroid cancer |
| HT: Hashimoto's thyroiditis | ||
| PTC: Papillary thyroid cancer |
| ∗log2FC in expression of this searched gene in stem-like cells from each diseased tissue sample relative to stem-like cells in normal samples in each tissue plotted against the malignancy continuum. Samples are colored based on if they are from different disease stage. |
Top |
Malignant transformation related pathway analysis |
| Find out the enriched GO biological processes and KEGG pathways involved in transition from healthy to precancer to cancer |
| Tissue | Disease Stage | Enriched GO biological Processes |
| Colorectum | AD |  |
| Colorectum | SER |  |
| Colorectum | MSS |  |
| Colorectum | MSI-H |  |
| Colorectum | FAP |  |
| ∗Top 15 enriched GO BP terms are showed in the bar plot of each disease state in each tissue. Each row represents a significant GO biological process which is colored according to the -log10(p.adjust). |
| Page: 1 2 3 4 5 6 7 8 9 |
| GO ID | Tissue | Disease Stage | Description | Gene Ratio | Bg Ratio | pvalue | p.adjust | Count |
| GO:00060918 | Breast | Precancer | generation of precursor metabolites and energy | 94/1080 | 490/18723 | 1.54e-25 | 1.64e-22 | 94 |
| GO:00196938 | Breast | Precancer | ribose phosphate metabolic process | 49/1080 | 396/18723 | 3.81e-07 | 1.78e-05 | 49 |
| GO:00463907 | Breast | Precancer | ribose phosphate biosynthetic process | 30/1080 | 190/18723 | 4.75e-07 | 2.11e-05 | 30 |
| GO:000609113 | Breast | IDC | generation of precursor metabolites and energy | 103/1434 | 490/18723 | 1.53e-21 | 1.74e-18 | 103 |
| GO:004639013 | Breast | IDC | ribose phosphate biosynthetic process | 36/1434 | 190/18723 | 3.40e-07 | 1.73e-05 | 36 |
| GO:001969314 | Breast | IDC | ribose phosphate metabolic process | 58/1434 | 396/18723 | 1.31e-06 | 5.73e-05 | 58 |
| GO:000609123 | Breast | DCIS | generation of precursor metabolites and energy | 103/1390 | 490/18723 | 1.46e-22 | 1.65e-19 | 103 |
| GO:004639022 | Breast | DCIS | ribose phosphate biosynthetic process | 36/1390 | 190/18723 | 1.59e-07 | 8.19e-06 | 36 |
| GO:001969324 | Breast | DCIS | ribose phosphate metabolic process | 58/1390 | 396/18723 | 4.80e-07 | 2.11e-05 | 58 |
| GO:00060919 | Cervix | CC | generation of precursor metabolites and energy | 105/2311 | 490/18723 | 7.40e-09 | 6.61e-07 | 105 |
| GO:00196939 | Cervix | CC | ribose phosphate metabolic process | 72/2311 | 396/18723 | 4.49e-04 | 4.48e-03 | 72 |
| GO:00463908 | Cervix | CC | ribose phosphate biosynthetic process | 39/2311 | 190/18723 | 9.02e-04 | 7.77e-03 | 39 |
| GO:004639014 | Cervix | HSIL_HPV | ribose phosphate biosynthetic process | 16/737 | 190/18723 | 3.53e-03 | 3.16e-02 | 16 |
| GO:000609114 | Cervix | HSIL_HPV | generation of precursor metabolites and energy | 32/737 | 490/18723 | 3.69e-03 | 3.27e-02 | 32 |
| GO:000609124 | Cervix | N_HPV | generation of precursor metabolites and energy | 40/534 | 490/18723 | 2.59e-09 | 7.88e-07 | 40 |
| GO:001969315 | Cervix | N_HPV | ribose phosphate metabolic process | 25/534 | 396/18723 | 1.91e-04 | 3.25e-03 | 25 |
| GO:004639023 | Cervix | N_HPV | ribose phosphate biosynthetic process | 13/534 | 190/18723 | 3.23e-03 | 2.65e-02 | 13 |
| GO:0006091 | Colorectum | AD | generation of precursor metabolites and energy | 209/3918 | 490/18723 | 3.17e-28 | 6.61e-25 | 209 |
| GO:0019693 | Colorectum | AD | ribose phosphate metabolic process | 145/3918 | 396/18723 | 3.01e-13 | 5.71e-11 | 145 |
| GO:0046390 | Colorectum | AD | ribose phosphate biosynthetic process | 67/3918 | 190/18723 | 3.21e-06 | 9.05e-05 | 67 |
| Page: 1 2 3 4 5 6 7 |
| Pathway ID | Tissue | Disease Stage | Description | Gene Ratio | Bg Ratio | pvalue | p.adjust | qvalue | Count |
| hsa0120012 | Breast | Precancer | Carbon metabolism | 18/684 | 115/8465 | 4.79e-03 | 2.75e-02 | 2.11e-02 | 18 |
| hsa0120013 | Breast | Precancer | Carbon metabolism | 18/684 | 115/8465 | 4.79e-03 | 2.75e-02 | 2.11e-02 | 18 |
| hsa01200 | Colorectum | AD | Carbon metabolism | 55/2092 | 115/8465 | 5.53e-08 | 8.42e-07 | 5.37e-07 | 55 |
| hsa01230 | Colorectum | AD | Biosynthesis of amino acids | 28/2092 | 75/8465 | 9.99e-03 | 3.89e-02 | 2.48e-02 | 28 |
| hsa012001 | Colorectum | AD | Carbon metabolism | 55/2092 | 115/8465 | 5.53e-08 | 8.42e-07 | 5.37e-07 | 55 |
| hsa012301 | Colorectum | AD | Biosynthesis of amino acids | 28/2092 | 75/8465 | 9.99e-03 | 3.89e-02 | 2.48e-02 | 28 |
| hsa012002 | Colorectum | SER | Carbon metabolism | 40/1580 | 115/8465 | 2.77e-05 | 3.41e-04 | 2.47e-04 | 40 |
| hsa012302 | Colorectum | SER | Biosynthesis of amino acids | 23/1580 | 75/8465 | 8.11e-03 | 4.14e-02 | 3.01e-02 | 23 |
| hsa012003 | Colorectum | SER | Carbon metabolism | 40/1580 | 115/8465 | 2.77e-05 | 3.41e-04 | 2.47e-04 | 40 |
| hsa012303 | Colorectum | SER | Biosynthesis of amino acids | 23/1580 | 75/8465 | 8.11e-03 | 4.14e-02 | 3.01e-02 | 23 |
| hsa012004 | Colorectum | MSS | Carbon metabolism | 43/1875 | 115/8465 | 1.37e-04 | 1.17e-03 | 7.19e-04 | 43 |
| hsa012005 | Colorectum | MSS | Carbon metabolism | 43/1875 | 115/8465 | 1.37e-04 | 1.17e-03 | 7.19e-04 | 43 |
| hsa0120016 | Esophagus | HGIN | Carbon metabolism | 31/1383 | 115/8465 | 2.51e-03 | 2.10e-02 | 1.67e-02 | 31 |
| hsa012306 | Esophagus | HGIN | Biosynthesis of amino acids | 21/1383 | 75/8465 | 7.38e-03 | 4.63e-02 | 3.68e-02 | 21 |
| hsa0120017 | Esophagus | HGIN | Carbon metabolism | 31/1383 | 115/8465 | 2.51e-03 | 2.10e-02 | 1.67e-02 | 31 |
| hsa0123013 | Esophagus | HGIN | Biosynthesis of amino acids | 21/1383 | 75/8465 | 7.38e-03 | 4.63e-02 | 3.68e-02 | 21 |
| hsa0120023 | Esophagus | ESCC | Carbon metabolism | 79/4205 | 115/8465 | 2.50e-05 | 1.21e-04 | 6.22e-05 | 79 |
| hsa0123023 | Esophagus | ESCC | Biosynthesis of amino acids | 49/4205 | 75/8465 | 4.35e-03 | 1.12e-02 | 5.74e-03 | 49 |
| hsa0120033 | Esophagus | ESCC | Carbon metabolism | 79/4205 | 115/8465 | 2.50e-05 | 1.21e-04 | 6.22e-05 | 79 |
| hsa0123033 | Esophagus | ESCC | Biosynthesis of amino acids | 49/4205 | 75/8465 | 4.35e-03 | 1.12e-02 | 5.74e-03 | 49 |
| Page: 1 2 |
Top |
Cell-cell communication analysis |
| Identification of potential cell-cell interactions between two cell types and their ligand-receptor pairs for different disease states |
| Ligand | Receptor | LRpair | Pathway | Tissue | Disease Stage |
| Page: 1 |
Top |
Single-cell gene regulatory network inference analysis |
| Find out the significant the regulons (TFs) and the target genes of each regulon across cell types for different disease states |
| TF | Cell Type | Tissue | Disease Stage | Target Gene | RSS | Regulon Activity |
| ∗The dot plots of a searched regulon are shown for all cell subpopulations in each disease state of each tissue based on the regulon specific score inferred using pySCENIC and by calculating the average expression. |
| Page: 1 |
Top |
Somatic mutation of malignant transformation related genes |
| Annotation of somatic variants for genes involved in malignant transformation |
| Hugo Symbol | Variant Class | Variant Classification | dbSNP RS | HGVSc | HGVSp | HGVSp Short | SWISSPROT | BIOTYPE | SIFT | PolyPhen | Tumor Sample Barcode | Tissue | Histology | Sex | Age | Stage | Therapy Types | Drugs | Outcome |
| TKT | SNV | Missense_Mutation | c.1226N>A | p.Arg409His | p.R409H | P29401 | protein_coding | deleterious(0.01) | probably_damaging(0.996) | TCGA-AO-A128-01 | Breast | breast invasive carcinoma | Female | <65 | I/II | Chemotherapy | doxorubicin | SD | |
| TKT | SNV | Missense_Mutation | c.1625N>T | p.Pro542Leu | p.P542L | P29401 | protein_coding | tolerated(0.85) | benign(0.413) | TCGA-D8-A1JI-01 | Breast | breast invasive carcinoma | Female | <65 | I/II | Chemotherapy | doxorubicine | SD | |
| TKT | SNV | Missense_Mutation | c.569N>A | p.Leu190Gln | p.L190Q | P29401 | protein_coding | deleterious(0) | probably_damaging(0.971) | TCGA-D8-A1X9-01 | Breast | breast invasive carcinoma | Female | >=65 | I/II | Chemotherapy | adriamycin+cyclophosphamide | SD | |
| TKT | SNV | Missense_Mutation | novel | c.434N>A | p.Ala145Asp | p.A145D | P29401 | protein_coding | deleterious(0.02) | possibly_damaging(0.734) | TCGA-S3-AA15-01 | Breast | breast invasive carcinoma | Female | <65 | I/II | Chemotherapy | adriamycin | CR |
| TKT | deletion | Frame_Shift_Del | novel | c.1645delN | p.Asp549ThrfsTer36 | p.D549Tfs*36 | P29401 | protein_coding | TCGA-D8-A27V-01 | Breast | breast invasive carcinoma | Female | <65 | I/II | Hormone Therapy | tamoxiphen | SD | ||
| TKT | SNV | Missense_Mutation | rs782597207 | c.133N>A | p.Ala45Thr | p.A45T | P29401 | protein_coding | deleterious(0.02) | possibly_damaging(0.675) | TCGA-C5-A3HE-01 | Cervix | cervical & endocervical cancer | Female | <65 | I/II | Unknown | Unknown | PD |
| TKT | SNV | Missense_Mutation | novel | c.306N>T | p.Lys102Asn | p.K102N | P29401 | protein_coding | deleterious(0.02) | possibly_damaging(0.576) | TCGA-VS-A8QF-01 | Cervix | cervical & endocervical cancer | Female | <65 | I/II | Chemotherapy | cisplatin | CR |
| TKT | SNV | Missense_Mutation | c.406G>A | p.Ala136Thr | p.A136T | P29401 | protein_coding | deleterious(0) | probably_damaging(0.997) | TCGA-AA-3511-01 | Colorectum | colon adenocarcinoma | Male | <65 | I/II | Unknown | Unknown | PD | |
| TKT | SNV | Missense_Mutation | c.250N>A | p.Ala84Thr | p.A84T | P29401 | protein_coding | deleterious(0.01) | possibly_damaging(0.626) | TCGA-AA-3864-01 | Colorectum | colon adenocarcinoma | Male | >=65 | I/II | Unknown | Unknown | SD | |
| TKT | SNV | Missense_Mutation | novel | c.1667N>A | p.Ser556Asn | p.S556N | P29401 | protein_coding | tolerated(0.88) | benign(0) | TCGA-AA-A00N-01 | Colorectum | colon adenocarcinoma | Male | >=65 | I/II | Unknown | Unknown | PD |
| Page: 1 2 3 4 5 |
Top |
Related drugs of malignant transformation related genes |
| Identification of chemicals and drugs interact with genes involved in malignant transfromation |
| (DGIdb 4.0) |
| Entrez ID | Symbol | Category | Interaction Types | Drug Claim Name | Drug Name | PMIDs |
| Page: 1 |

Copyright 2023-Present -The University of Texas Health Science Center at Houston |