
|
|||||
|
 | |
| |
| |
| |
| |
| |
|
Gene: TKFC |
Gene summary for TKFC |
| Gene information | Species | Human | Gene symbol | TKFC | Gene ID | 26007 |
| Gene name | triokinase and FMN cyclase | |
| Gene Alias | DAK | |
| Cytomap | 11q12.2 | |
| Gene Type | protein-coding | GO ID | GO:0002221 | UniProtAcc | A0A140VJH7 |
Top |
Malignant transformation analysis |
| Identification of the aberrant gene expression in precancerous and cancerous lesions by comparing the gene expression of stem-like cells in diseased tissues with normal stem cells |
| Entrez ID | Symbol | Replicates | Species | Organ | Tissue | Adj P-value | Log2FC | Malignancy |
| 26007 | TKFC | LZE4T | Human | Esophagus | ESCC | 1.50e-08 | 9.89e-02 | 0.0811 |
| 26007 | TKFC | LZE7T | Human | Esophagus | ESCC | 1.67e-02 | 2.61e-01 | 0.0667 |
| 26007 | TKFC | LZE8T | Human | Esophagus | ESCC | 8.47e-07 | 1.27e-01 | 0.067 |
| 26007 | TKFC | LZE24T | Human | Esophagus | ESCC | 1.81e-15 | 5.03e-01 | 0.0596 |
| 26007 | TKFC | P1T-E | Human | Esophagus | ESCC | 4.66e-04 | 1.49e-01 | 0.0875 |
| 26007 | TKFC | P2T-E | Human | Esophagus | ESCC | 9.00e-19 | 2.09e-01 | 0.1177 |
| 26007 | TKFC | P4T-E | Human | Esophagus | ESCC | 6.90e-19 | 4.76e-01 | 0.1323 |
| 26007 | TKFC | P5T-E | Human | Esophagus | ESCC | 4.04e-12 | 1.39e-01 | 0.1327 |
| 26007 | TKFC | P8T-E | Human | Esophagus | ESCC | 4.52e-16 | 3.66e-01 | 0.0889 |
| 26007 | TKFC | P9T-E | Human | Esophagus | ESCC | 2.05e-10 | 1.35e-01 | 0.1131 |
| 26007 | TKFC | P10T-E | Human | Esophagus | ESCC | 1.34e-13 | 2.43e-01 | 0.116 |
| 26007 | TKFC | P11T-E | Human | Esophagus | ESCC | 7.50e-06 | 2.89e-01 | 0.1426 |
| 26007 | TKFC | P12T-E | Human | Esophagus | ESCC | 2.69e-23 | 4.38e-01 | 0.1122 |
| 26007 | TKFC | P15T-E | Human | Esophagus | ESCC | 1.65e-17 | 1.95e-01 | 0.1149 |
| 26007 | TKFC | P16T-E | Human | Esophagus | ESCC | 3.73e-37 | 6.21e-01 | 0.1153 |
| 26007 | TKFC | P17T-E | Human | Esophagus | ESCC | 1.93e-03 | 1.49e-01 | 0.1278 |
| 26007 | TKFC | P19T-E | Human | Esophagus | ESCC | 2.02e-08 | 4.72e-01 | 0.1662 |
| 26007 | TKFC | P20T-E | Human | Esophagus | ESCC | 6.53e-19 | 2.95e-01 | 0.1124 |
| 26007 | TKFC | P21T-E | Human | Esophagus | ESCC | 8.73e-19 | 3.31e-01 | 0.1617 |
| 26007 | TKFC | P22T-E | Human | Esophagus | ESCC | 1.90e-21 | 9.58e-02 | 0.1236 |
| Page: 1 2 3 4 5 |
| Tissue | Expression Dynamics | Abbreviation |
| Esophagus | 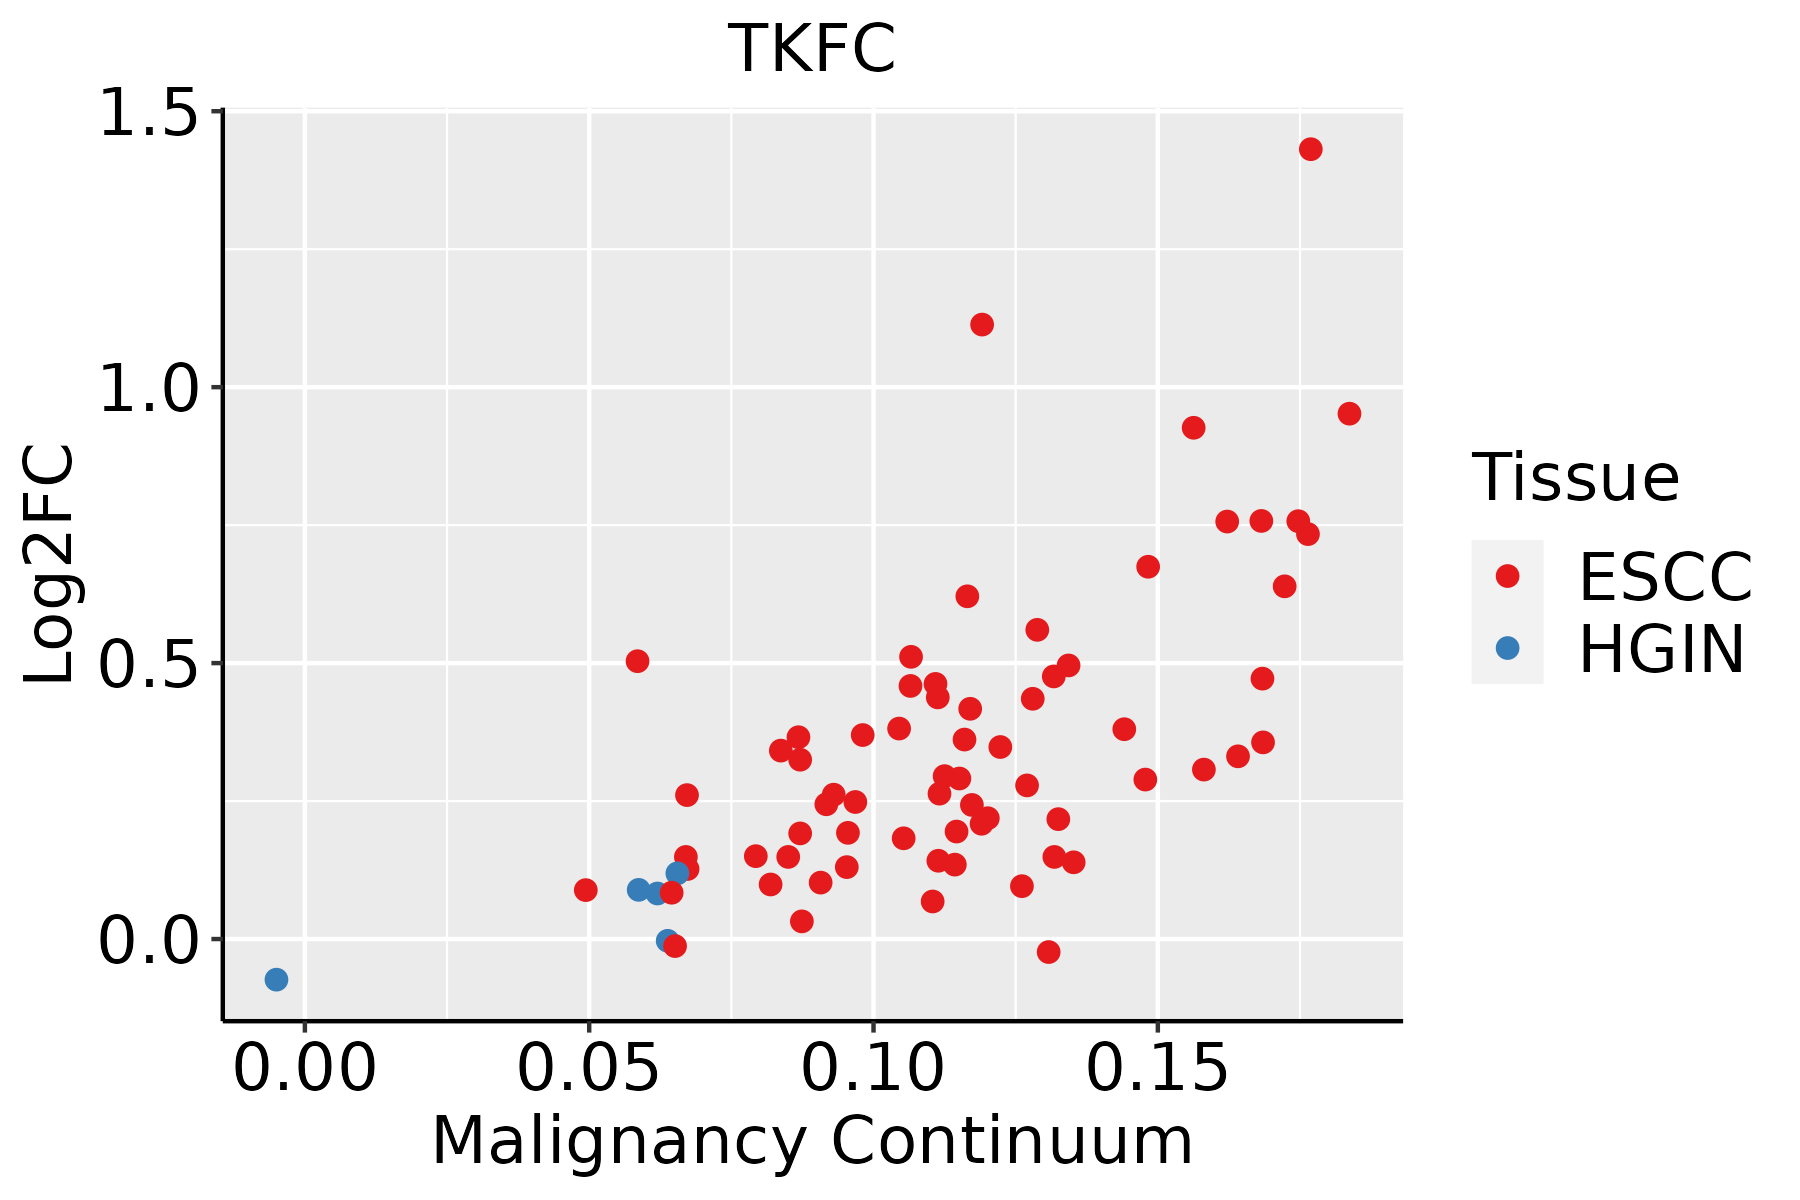 | ESCC: Esophageal squamous cell carcinoma |
| HGIN: High-grade intraepithelial neoplasias | ||
| LGIN: Low-grade intraepithelial neoplasias | ||
| Liver | 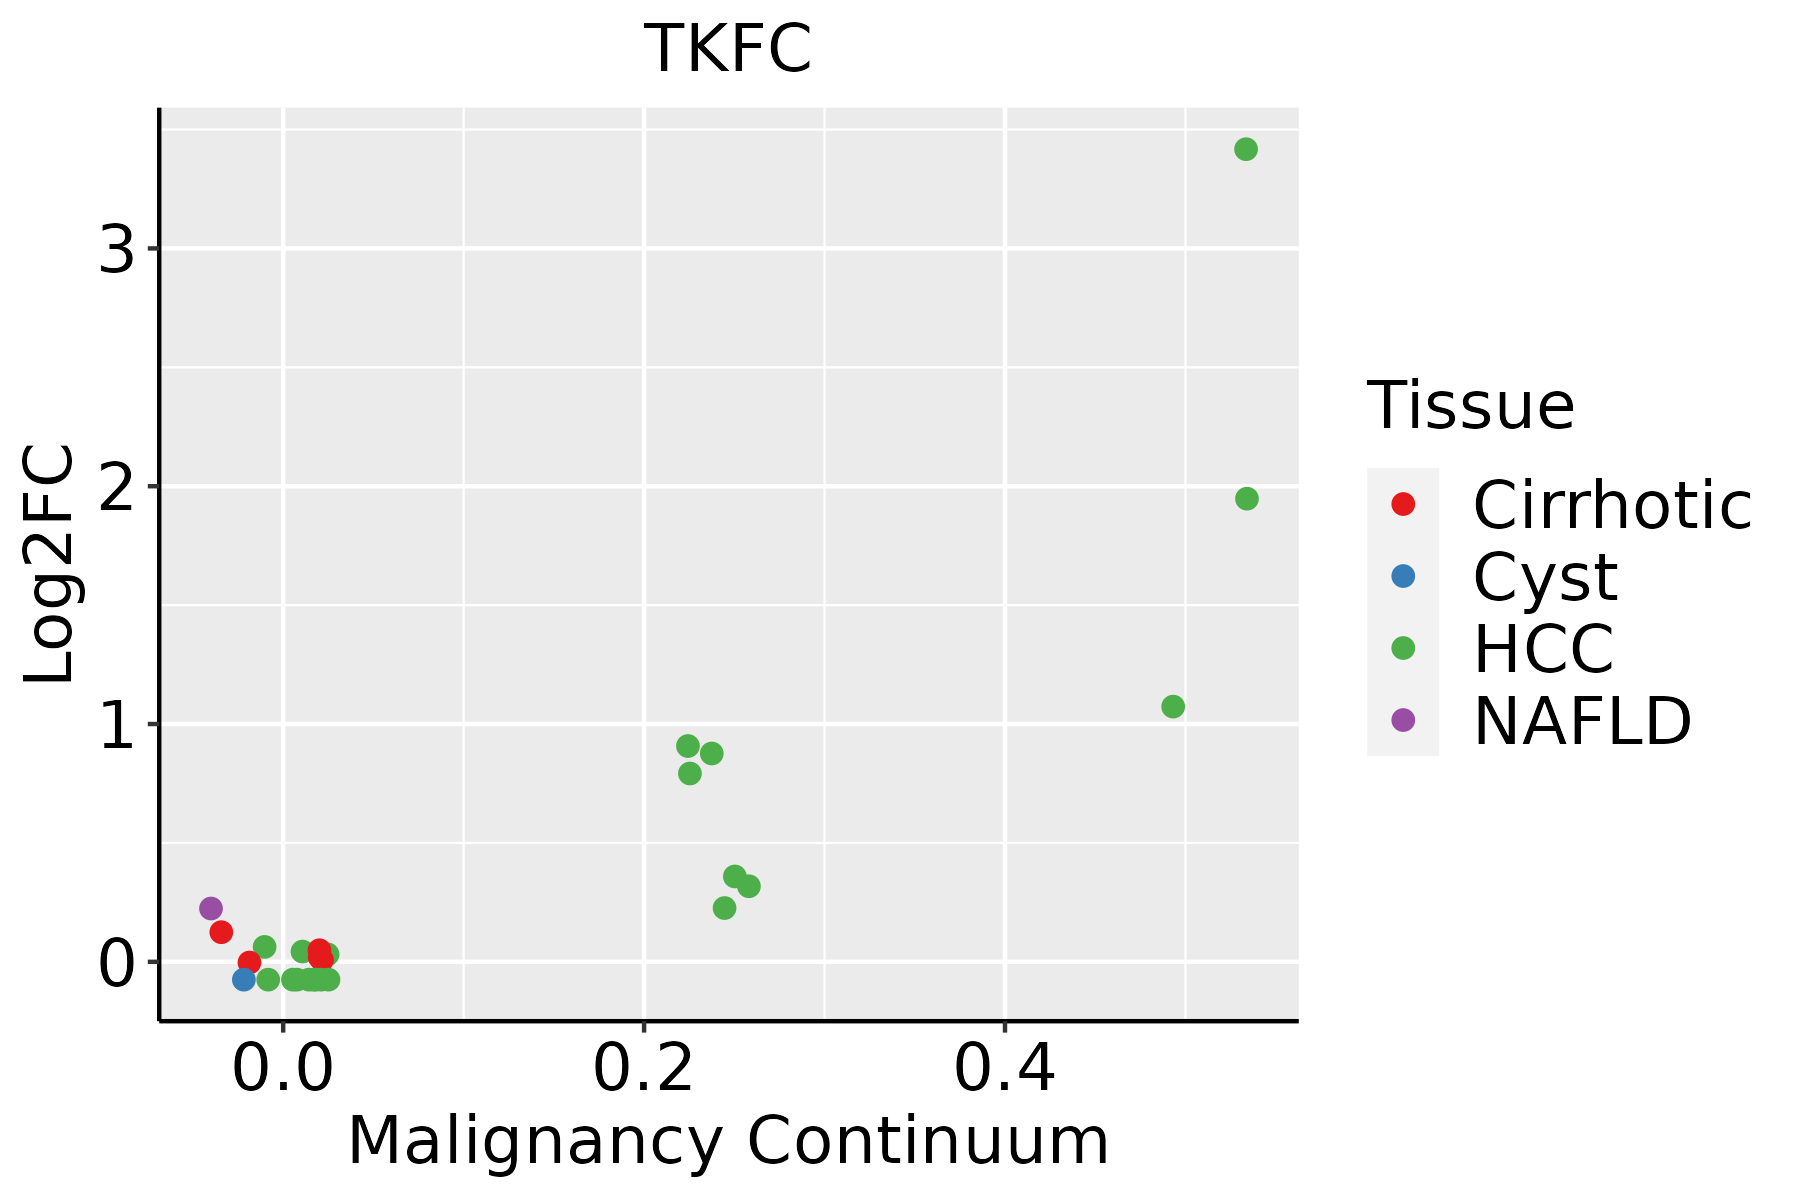 | HCC: Hepatocellular carcinoma |
| NAFLD: Non-alcoholic fatty liver disease | ||
| Oral Cavity |  | EOLP: Erosive Oral lichen planus |
| LP: leukoplakia | ||
| NEOLP: Non-erosive oral lichen planus | ||
| OSCC: Oral squamous cell carcinoma |
| ∗log2FC in expression of this searched gene in stem-like cells from each diseased tissue sample relative to stem-like cells in normal samples in each tissue plotted against the malignancy continuum. Samples are colored based on if they are from different disease stage. |
Top |
Malignant transformation related pathway analysis |
| Find out the enriched GO biological processes and KEGG pathways involved in transition from healthy to precancer to cancer |
| Tissue | Disease Stage | Enriched GO biological Processes |
| Colorectum | AD |  |
| Colorectum | SER |  |
| Colorectum | MSS |  |
| Colorectum | MSI-H |  |
| Colorectum | FAP |  |
| ∗Top 15 enriched GO BP terms are showed in the bar plot of each disease state in each tissue. Each row represents a significant GO biological process which is colored according to the -log10(p.adjust). |
| Page: 1 2 3 4 5 6 7 8 9 |
| GO ID | Tissue | Disease Stage | Description | Gene Ratio | Bg Ratio | pvalue | p.adjust | Count |
| GO:000961518 | Esophagus | ESCC | response to virus | 238/8552 | 367/18723 | 6.65e-14 | 3.32e-12 | 238 |
| GO:00516075 | Esophagus | ESCC | defense response to virus | 171/8552 | 265/18723 | 3.91e-10 | 1.05e-08 | 171 |
| GO:01405465 | Esophagus | ESCC | defense response to symbiont | 171/8552 | 265/18723 | 3.91e-10 | 1.05e-08 | 171 |
| GO:0030522110 | Esophagus | ESCC | intracellular receptor signaling pathway | 170/8552 | 265/18723 | 8.58e-10 | 2.09e-08 | 170 |
| GO:00028318 | Esophagus | ESCC | regulation of response to biotic stimulus | 191/8552 | 327/18723 | 2.12e-06 | 2.45e-05 | 191 |
| GO:00060668 | Esophagus | ESCC | alcohol metabolic process | 202/8552 | 353/18723 | 7.32e-06 | 7.26e-05 | 202 |
| GO:000283212 | Esophagus | ESCC | negative regulation of response to biotic stimulus | 72/8552 | 108/18723 | 8.36e-06 | 8.11e-05 | 72 |
| GO:003952813 | Esophagus | ESCC | cytoplasmic pattern recognition receptor signaling pathway in response to virus | 28/8552 | 34/18723 | 1.21e-05 | 1.12e-04 | 28 |
| GO:009858613 | Esophagus | ESCC | cellular response to virus | 56/8552 | 84/18723 | 8.20e-05 | 6.01e-04 | 56 |
| GO:00442626 | Esophagus | ESCC | cellular carbohydrate metabolic process | 160/8552 | 283/18723 | 1.43e-04 | 9.66e-04 | 160 |
| GO:000275313 | Esophagus | ESCC | cytoplasmic pattern recognition receptor signaling pathway | 41/8552 | 60/18723 | 3.25e-04 | 1.91e-03 | 41 |
| GO:00450885 | Esophagus | ESCC | regulation of innate immune response | 125/8552 | 218/18723 | 3.34e-04 | 1.96e-03 | 125 |
| GO:00507775 | Esophagus | ESCC | negative regulation of immune response | 112/8552 | 194/18723 | 4.67e-04 | 2.62e-03 | 112 |
| GO:001605216 | Esophagus | ESCC | carbohydrate catabolic process | 91/8552 | 154/18723 | 5.39e-04 | 2.97e-03 | 91 |
| GO:00506884 | Esophagus | ESCC | regulation of defense response to virus | 45/8552 | 69/18723 | 8.26e-04 | 4.27e-03 | 45 |
| GO:000268316 | Esophagus | ESCC | negative regulation of immune system process | 231/8552 | 434/18723 | 8.48e-04 | 4.36e-03 | 231 |
| GO:00442827 | Esophagus | ESCC | small molecule catabolic process | 201/8552 | 376/18723 | 1.35e-03 | 6.41e-03 | 201 |
| GO:00395313 | Esophagus | ESCC | regulation of viral-induced cytoplasmic pattern recognition receptor signaling pathway | 18/8552 | 24/18723 | 3.43e-03 | 1.41e-02 | 18 |
| GO:00506871 | Esophagus | ESCC | negative regulation of defense response to virus | 18/8552 | 24/18723 | 3.43e-03 | 1.41e-02 | 18 |
| GO:00442751 | Esophagus | ESCC | cellular carbohydrate catabolic process | 27/8552 | 40/18723 | 4.39e-03 | 1.73e-02 | 27 |
| Page: 1 2 3 4 |
| Pathway ID | Tissue | Disease Stage | Description | Gene Ratio | Bg Ratio | pvalue | p.adjust | qvalue | Count |
| hsa0120023 | Esophagus | ESCC | Carbon metabolism | 79/4205 | 115/8465 | 2.50e-05 | 1.21e-04 | 6.22e-05 | 79 |
| hsa000512 | Esophagus | ESCC | Fructose and mannose metabolism | 24/4205 | 34/8465 | 1.09e-02 | 2.51e-02 | 1.29e-02 | 24 |
| hsa0120033 | Esophagus | ESCC | Carbon metabolism | 79/4205 | 115/8465 | 2.50e-05 | 1.21e-04 | 6.22e-05 | 79 |
| hsa0005111 | Esophagus | ESCC | Fructose and mannose metabolism | 24/4205 | 34/8465 | 1.09e-02 | 2.51e-02 | 1.29e-02 | 24 |
| hsa0120041 | Liver | HCC | Carbon metabolism | 89/4020 | 115/8465 | 3.92e-11 | 6.56e-10 | 3.65e-10 | 89 |
| hsa005615 | Liver | HCC | Glycerolipid metabolism | 41/4020 | 63/8465 | 3.59e-03 | 1.12e-02 | 6.22e-03 | 41 |
| hsa0120051 | Liver | HCC | Carbon metabolism | 89/4020 | 115/8465 | 3.92e-11 | 6.56e-10 | 3.65e-10 | 89 |
| hsa0056112 | Liver | HCC | Glycerolipid metabolism | 41/4020 | 63/8465 | 3.59e-03 | 1.12e-02 | 6.22e-03 | 41 |
| hsa0120014 | Oral cavity | OSCC | Carbon metabolism | 74/3704 | 115/8465 | 6.10e-06 | 3.05e-05 | 1.55e-05 | 74 |
| hsa04622 | Oral cavity | OSCC | RIG-I-like receptor signaling pathway | 41/3704 | 71/8465 | 1.20e-02 | 2.63e-02 | 1.34e-02 | 41 |
| hsa0120015 | Oral cavity | OSCC | Carbon metabolism | 74/3704 | 115/8465 | 6.10e-06 | 3.05e-05 | 1.55e-05 | 74 |
| hsa046221 | Oral cavity | OSCC | RIG-I-like receptor signaling pathway | 41/3704 | 71/8465 | 1.20e-02 | 2.63e-02 | 1.34e-02 | 41 |
| hsa0120022 | Oral cavity | LP | Carbon metabolism | 62/2418 | 115/8465 | 8.38e-09 | 1.39e-07 | 8.99e-08 | 62 |
| hsa046222 | Oral cavity | LP | RIG-I-like receptor signaling pathway | 30/2418 | 71/8465 | 9.09e-03 | 3.33e-02 | 2.14e-02 | 30 |
| hsa0120032 | Oral cavity | LP | Carbon metabolism | 62/2418 | 115/8465 | 8.38e-09 | 1.39e-07 | 8.99e-08 | 62 |
| hsa046223 | Oral cavity | LP | RIG-I-like receptor signaling pathway | 30/2418 | 71/8465 | 9.09e-03 | 3.33e-02 | 2.14e-02 | 30 |
| Page: 1 |
Top |
Cell-cell communication analysis |
| Identification of potential cell-cell interactions between two cell types and their ligand-receptor pairs for different disease states |
| Ligand | Receptor | LRpair | Pathway | Tissue | Disease Stage |
| Page: 1 |
Top |
Single-cell gene regulatory network inference analysis |
| Find out the significant the regulons (TFs) and the target genes of each regulon across cell types for different disease states |
| TF | Cell Type | Tissue | Disease Stage | Target Gene | RSS | Regulon Activity |
| ∗The dot plots of a searched regulon are shown for all cell subpopulations in each disease state of each tissue based on the regulon specific score inferred using pySCENIC and by calculating the average expression. |
| Page: 1 |
Top |
Somatic mutation of malignant transformation related genes |
| Annotation of somatic variants for genes involved in malignant transformation |
| Hugo Symbol | Variant Class | Variant Classification | dbSNP RS | HGVSc | HGVSp | HGVSp Short | SWISSPROT | BIOTYPE | SIFT | PolyPhen | Tumor Sample Barcode | Tissue | Histology | Sex | Age | Stage | Therapy Types | Drugs | Outcome |
| TKFC | SNV | Missense_Mutation | novel | c.697A>C | p.Thr233Pro | p.T233P | Q3LXA3 | protein_coding | tolerated(0.37) | benign(0.001) | TCGA-A7-A26G-01 | Breast | breast invasive carcinoma | Female | <65 | I/II | Chemotherapy | taxotere | SD |
| TKFC | SNV | Missense_Mutation | rs774912795 | c.1135G>C | p.Glu379Gln | p.E379Q | Q3LXA3 | protein_coding | tolerated(0.29) | benign(0.006) | TCGA-A8-A06Q-01 | Breast | breast invasive carcinoma | Female | <65 | III/IV | Unknown | Unknown | SD |
| TKFC | SNV | Missense_Mutation | c.1530G>C | p.Lys510Asn | p.K510N | Q3LXA3 | protein_coding | tolerated(0.22) | benign(0.21) | TCGA-AC-A23H-01 | Breast | breast invasive carcinoma | Female | >=65 | I/II | Unknown | Unknown | PD | |
| TKFC | SNV | Missense_Mutation | novel | c.1413N>C | p.Trp471Cys | p.W471C | Q3LXA3 | protein_coding | deleterious(0) | possibly_damaging(0.713) | TCGA-D8-A13Z-01 | Breast | breast invasive carcinoma | Female | <65 | I/II | Chemotherapy | doxorubicine | SD |
| TKFC | SNV | Missense_Mutation | c.7N>A | p.Ser3Thr | p.S3T | Q3LXA3 | protein_coding | tolerated(0.31) | benign(0.036) | TCGA-E2-A156-01 | Breast | breast invasive carcinoma | Female | <65 | I/II | Hormone Therapy | arimidex | SD | |
| TKFC | insertion | Frame_Shift_Ins | novel | c.394_395insGATACCAGACAGGCAAGGTCCC | p.Val132GlyfsTer45 | p.V132Gfs*45 | Q3LXA3 | protein_coding | TCGA-BH-A0B8-01 | Breast | breast invasive carcinoma | Female | <65 | I/II | Hormone Therapy | arimidex | SD | ||
| TKFC | deletion | In_Frame_Del | novel | c.709_720delNNNNNNNNNNNN | p.Ile237_Leu240del | p.I237_L240del | Q3LXA3 | protein_coding | TCGA-LL-A6FP-01 | Breast | breast invasive carcinoma | Female | >=65 | I/II | Hormone Therapy | arimidex | SD | ||
| TKFC | deletion | Frame_Shift_Del | novel | c.935delN | p.Ser313LeufsTer12 | p.S313Lfs*12 | Q3LXA3 | protein_coding | TCGA-JW-A5VK-01 | Cervix | cervical & endocervical cancer | Female | <65 | I/II | Unknown | Unknown | SD | ||
| TKFC | SNV | Missense_Mutation | rs779771365 | c.1190N>A | p.Arg397Gln | p.R397Q | Q3LXA3 | protein_coding | deleterious(0.01) | benign(0.056) | TCGA-A6-5665-01 | Colorectum | colon adenocarcinoma | Female | >=65 | I/II | Unknown | Unknown | PD |
| TKFC | SNV | Missense_Mutation | rs754625426 | c.1207N>A | p.Asp403Asn | p.D403N | Q3LXA3 | protein_coding | deleterious(0) | probably_damaging(0.999) | TCGA-AA-3492-01 | Colorectum | colon adenocarcinoma | Female | >=65 | I/II | Unknown | Unknown | SD |
| Page: 1 2 3 4 5 6 |
Top |
Related drugs of malignant transformation related genes |
| Identification of chemicals and drugs interact with genes involved in malignant transfromation |
| (DGIdb 4.0) |
| Entrez ID | Symbol | Category | Interaction Types | Drug Claim Name | Drug Name | PMIDs |
| Page: 1 |

Copyright 2023-Present -The University of Texas Health Science Center at Houston |