| Tissue | Expression Dynamics | Abbreviation |
| Colorectum (GSE201348) |  | FAP: Familial adenomatous polyposis |
| CRC: Colorectal cancer |
| Colorectum (HTA11) |  | AD: Adenomas |
| SER: Sessile serrated lesions |
| MSI-H: Microsatellite-high colorectal cancer |
| MSS: Microsatellite stable colorectal cancer |
| Esophagus | 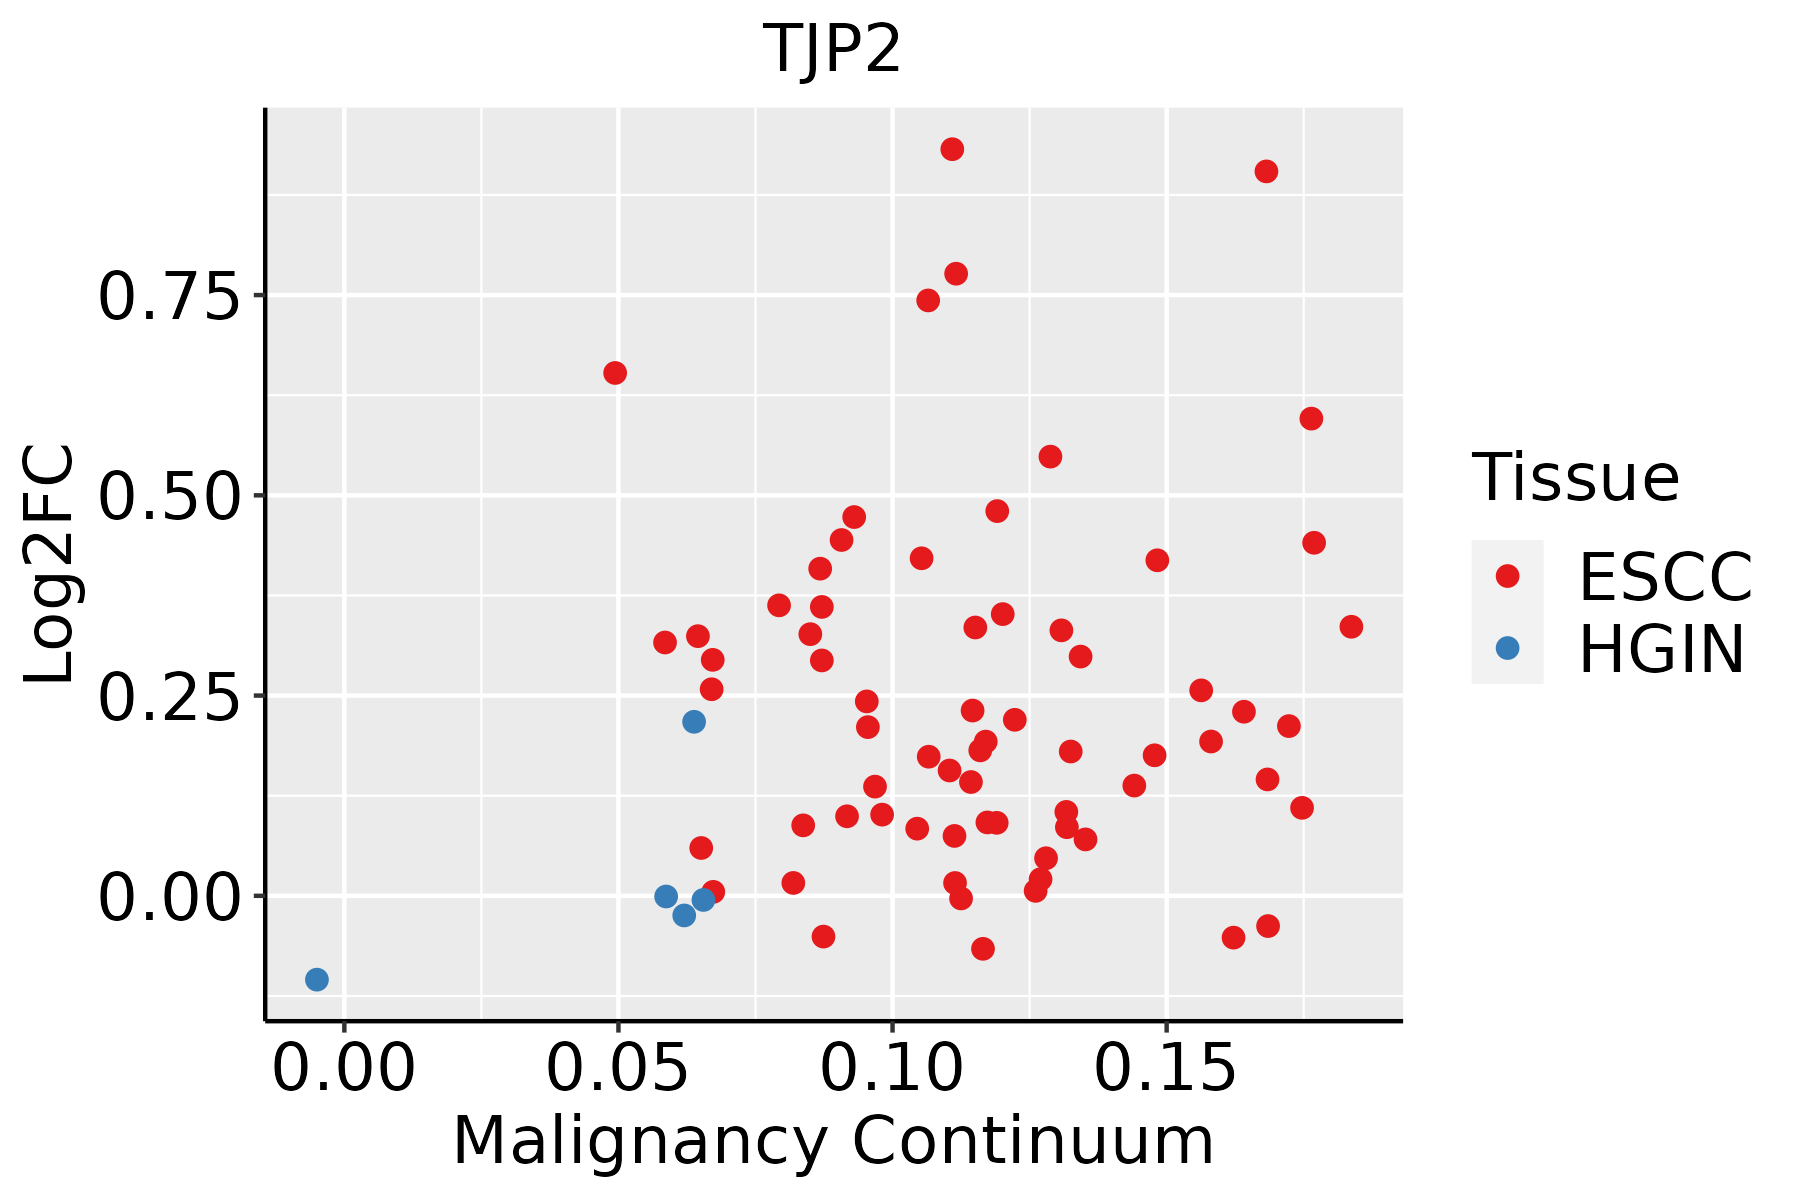 | ESCC: Esophageal squamous cell carcinoma |
| HGIN: High-grade intraepithelial neoplasias |
| LGIN: Low-grade intraepithelial neoplasias |
| Oral Cavity | 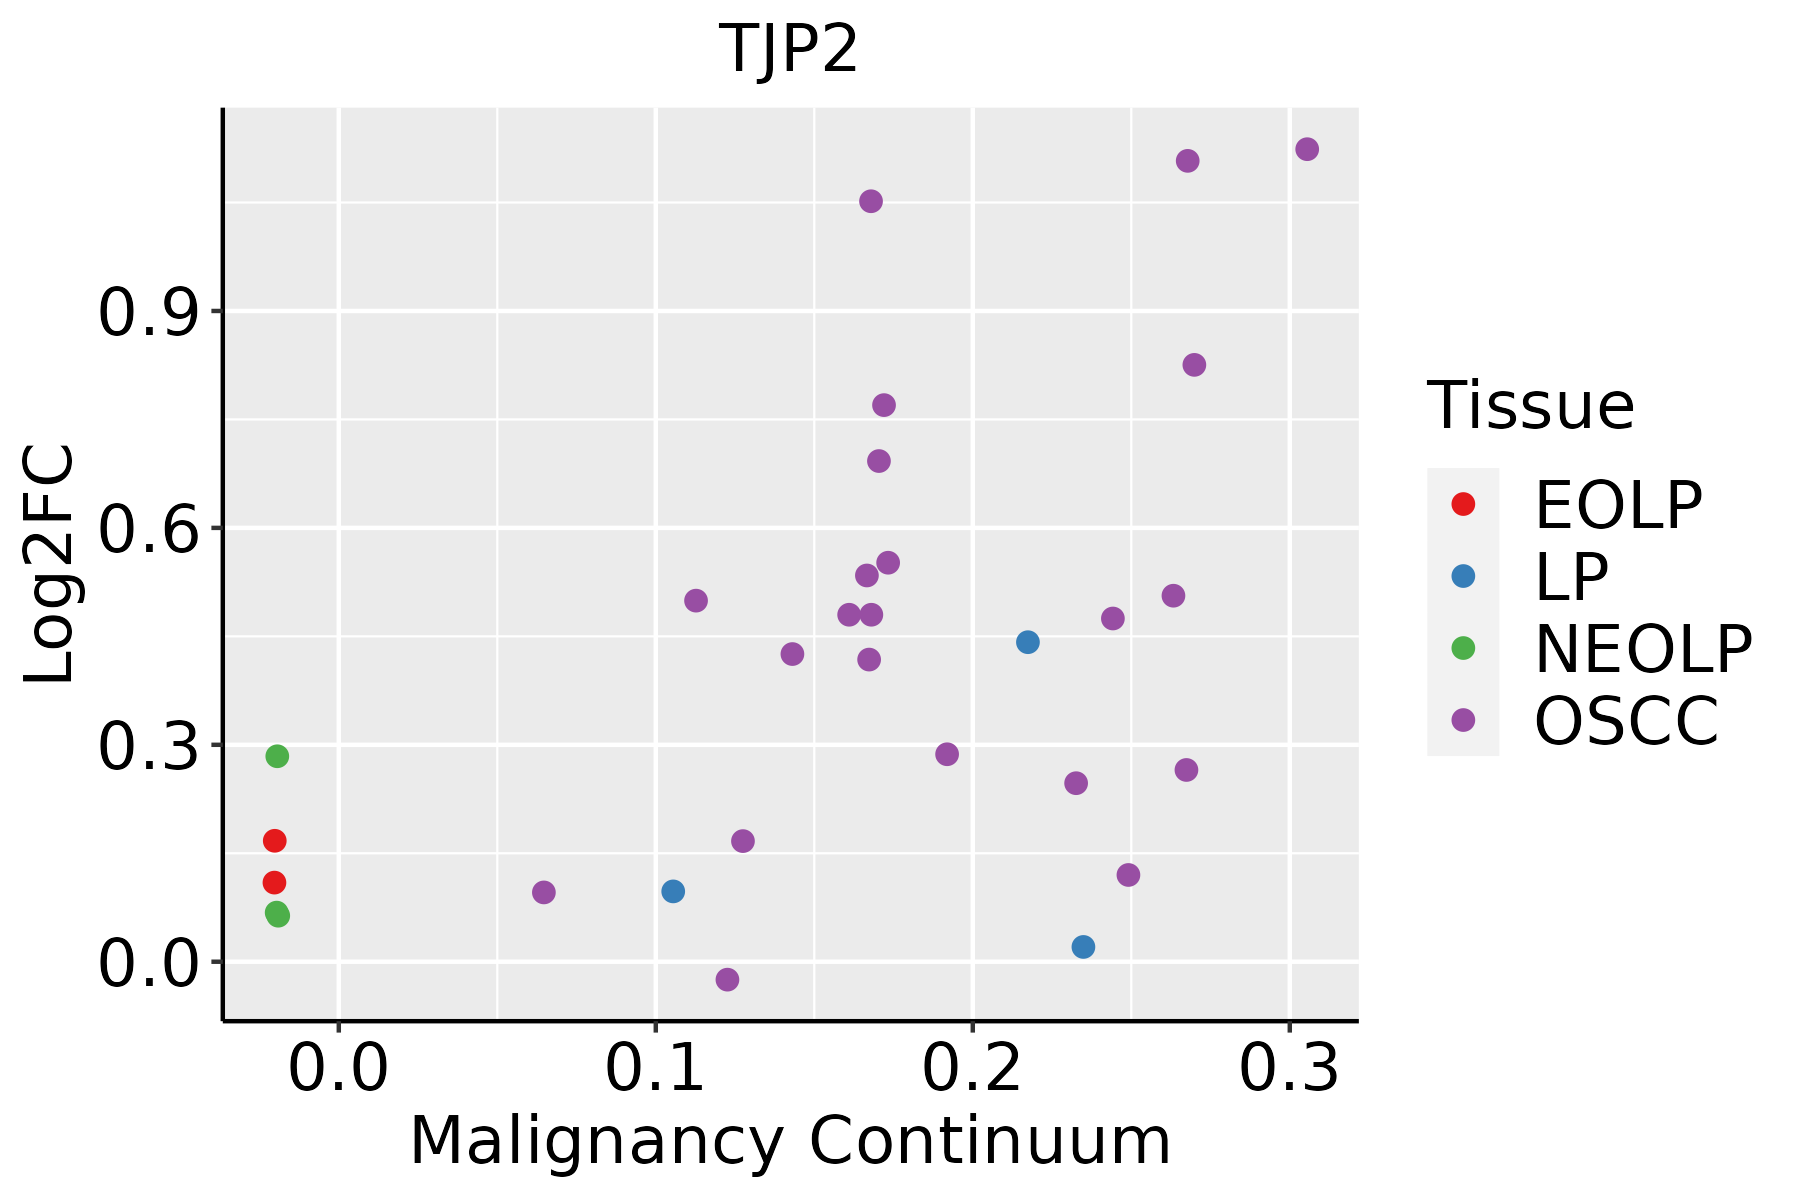 | EOLP: Erosive Oral lichen planus |
| LP: leukoplakia |
| NEOLP: Non-erosive oral lichen planus |
| OSCC: Oral squamous cell carcinoma |
| Prostate | 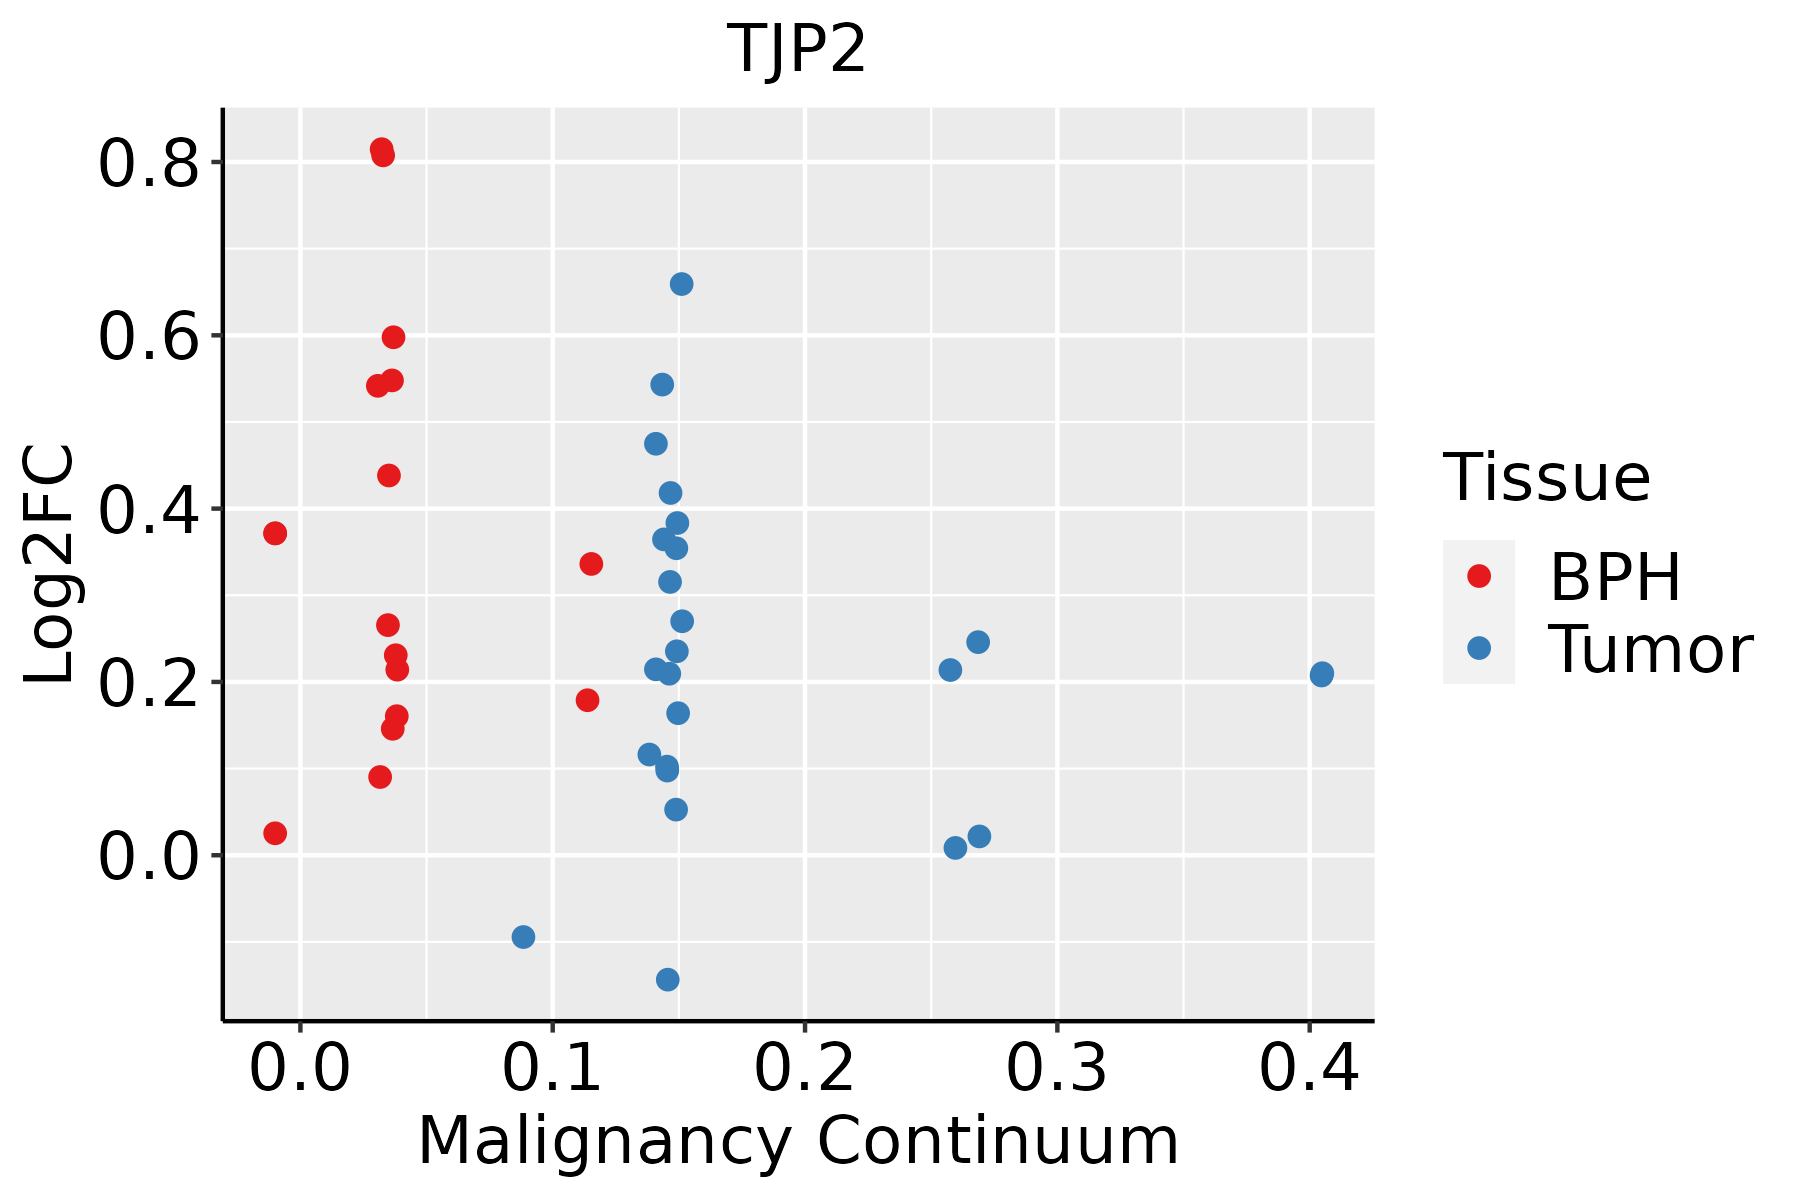 | BPH: Benign Prostatic Hyperplasia |
| Skin | 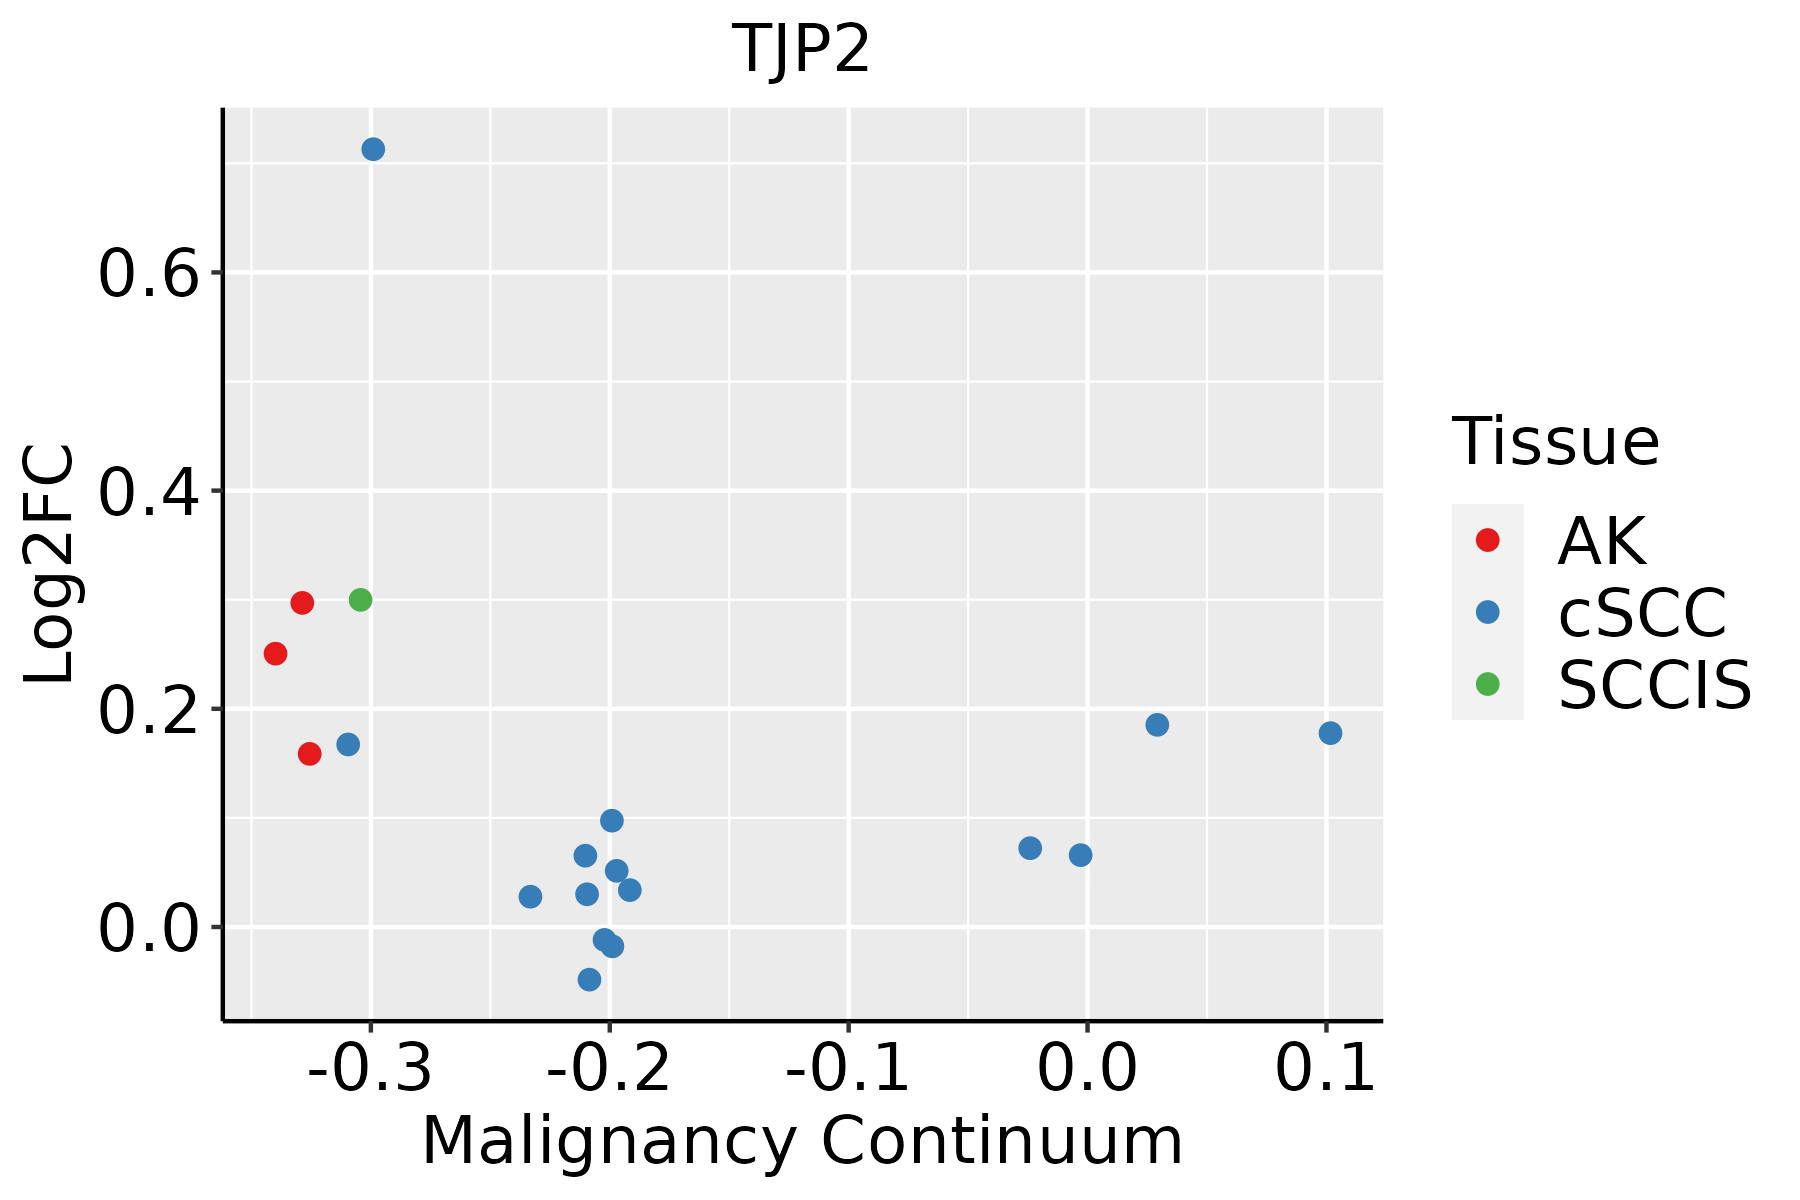 | AK: Actinic keratosis |
| cSCC: Cutaneous squamous cell carcinoma |
| SCCIS:squamous cell carcinoma in situ |
| GO ID | Tissue | Disease Stage | Description | Gene Ratio | Bg Ratio | pvalue | p.adjust | Count |
| GO:0009150 | Colorectum | AD | purine ribonucleotide metabolic process | 142/3918 | 368/18723 | 4.29e-15 | 1.17e-12 | 142 |
| GO:0006163 | Colorectum | AD | purine nucleotide metabolic process | 149/3918 | 396/18723 | 1.08e-14 | 2.80e-12 | 149 |
| GO:0072521 | Colorectum | AD | purine-containing compound metabolic process | 153/3918 | 416/18723 | 4.34e-14 | 1.01e-11 | 153 |
| GO:0009259 | Colorectum | AD | ribonucleotide metabolic process | 144/3918 | 385/18723 | 5.25e-14 | 1.13e-11 | 144 |
| GO:0019693 | Colorectum | AD | ribose phosphate metabolic process | 145/3918 | 396/18723 | 3.01e-13 | 5.71e-11 | 145 |
| GO:0009117 | Colorectum | AD | nucleotide metabolic process | 168/3918 | 489/18723 | 2.20e-12 | 3.36e-10 | 168 |
| GO:0006753 | Colorectum | AD | nucleoside phosphate metabolic process | 169/3918 | 497/18723 | 4.99e-12 | 6.98e-10 | 169 |
| GO:0002064 | Colorectum | AD | epithelial cell development | 89/3918 | 220/18723 | 2.98e-11 | 3.52e-09 | 89 |
| GO:0045216 | Colorectum | AD | cell-cell junction organization | 80/3918 | 200/18723 | 5.57e-10 | 4.58e-08 | 80 |
| GO:0009135 | Colorectum | AD | purine nucleoside diphosphate metabolic process | 47/3918 | 103/18723 | 1.61e-08 | 9.22e-07 | 47 |
| GO:0009179 | Colorectum | AD | purine ribonucleoside diphosphate metabolic process | 47/3918 | 103/18723 | 1.61e-08 | 9.22e-07 | 47 |
| GO:0009185 | Colorectum | AD | ribonucleoside diphosphate metabolic process | 47/3918 | 106/18723 | 4.85e-08 | 2.55e-06 | 47 |
| GO:0034109 | Colorectum | AD | homotypic cell-cell adhesion | 40/3918 | 90/18723 | 4.37e-07 | 1.67e-05 | 40 |
| GO:0009132 | Colorectum | AD | nucleoside diphosphate metabolic process | 49/3918 | 124/18723 | 1.75e-06 | 5.31e-05 | 49 |
| GO:0061028 | Colorectum | AD | establishment of endothelial barrier | 23/3918 | 46/18723 | 1.14e-05 | 2.57e-04 | 23 |
| GO:0060249 | Colorectum | AD | anatomical structure homeostasis | 94/3918 | 314/18723 | 9.37e-05 | 1.42e-03 | 94 |
| GO:0090559 | Colorectum | AD | regulation of membrane permeability | 31/3918 | 78/18723 | 1.16e-04 | 1.72e-03 | 31 |
| GO:0001894 | Colorectum | AD | tissue homeostasis | 81/3918 | 268/18723 | 1.96e-04 | 2.62e-03 | 81 |
| GO:0001885 | Colorectum | AD | endothelial cell development | 26/3918 | 64/18723 | 2.67e-04 | 3.29e-03 | 26 |
| GO:0009126 | Colorectum | AD | purine nucleoside monophosphate metabolic process | 19/3918 | 44/18723 | 7.13e-04 | 7.21e-03 | 19 |
| Pathway ID | Tissue | Disease Stage | Description | Gene Ratio | Bg Ratio | pvalue | p.adjust | qvalue | Count |
| hsa04530 | Colorectum | AD | Tight junction | 76/2092 | 169/8465 | 5.49e-09 | 9.69e-08 | 6.18e-08 | 76 |
| hsa05110 | Colorectum | AD | Vibrio cholerae infection | 29/2092 | 50/8465 | 5.10e-07 | 7.12e-06 | 4.54e-06 | 29 |
| hsa045301 | Colorectum | AD | Tight junction | 76/2092 | 169/8465 | 5.49e-09 | 9.69e-08 | 6.18e-08 | 76 |
| hsa051101 | Colorectum | AD | Vibrio cholerae infection | 29/2092 | 50/8465 | 5.10e-07 | 7.12e-06 | 4.54e-06 | 29 |
| hsa045302 | Colorectum | SER | Tight junction | 59/1580 | 169/8465 | 3.24e-07 | 5.98e-06 | 4.34e-06 | 59 |
| hsa051102 | Colorectum | SER | Vibrio cholerae infection | 24/1580 | 50/8465 | 2.17e-06 | 3.13e-05 | 2.28e-05 | 24 |
| hsa045303 | Colorectum | SER | Tight junction | 59/1580 | 169/8465 | 3.24e-07 | 5.98e-06 | 4.34e-06 | 59 |
| hsa051103 | Colorectum | SER | Vibrio cholerae infection | 24/1580 | 50/8465 | 2.17e-06 | 3.13e-05 | 2.28e-05 | 24 |
| hsa045304 | Colorectum | MSS | Tight junction | 66/1875 | 169/8465 | 4.10e-07 | 6.25e-06 | 3.83e-06 | 66 |
| hsa051104 | Colorectum | MSS | Vibrio cholerae infection | 27/1875 | 50/8465 | 8.58e-07 | 1.20e-05 | 7.34e-06 | 27 |
| hsa045305 | Colorectum | MSS | Tight junction | 66/1875 | 169/8465 | 4.10e-07 | 6.25e-06 | 3.83e-06 | 66 |
| hsa051105 | Colorectum | MSS | Vibrio cholerae infection | 27/1875 | 50/8465 | 8.58e-07 | 1.20e-05 | 7.34e-06 | 27 |
| hsa045306 | Colorectum | MSI-H | Tight junction | 31/797 | 169/8465 | 2.08e-04 | 2.80e-03 | 2.35e-03 | 31 |
| hsa045307 | Colorectum | MSI-H | Tight junction | 31/797 | 169/8465 | 2.08e-04 | 2.80e-03 | 2.35e-03 | 31 |
| hsa04530211 | Esophagus | ESCC | Tight junction | 105/4205 | 169/8465 | 6.73e-04 | 2.23e-03 | 1.14e-03 | 105 |
| hsa0511028 | Esophagus | ESCC | Vibrio cholerae infection | 34/4205 | 50/8465 | 6.62e-03 | 1.62e-02 | 8.30e-03 | 34 |
| hsa04530310 | Esophagus | ESCC | Tight junction | 105/4205 | 169/8465 | 6.73e-04 | 2.23e-03 | 1.14e-03 | 105 |
| hsa05110112 | Esophagus | ESCC | Vibrio cholerae infection | 34/4205 | 50/8465 | 6.62e-03 | 1.62e-02 | 8.30e-03 | 34 |
| hsa0453030 | Oral cavity | OSCC | Tight junction | 102/3704 | 169/8465 | 8.68e-06 | 3.93e-05 | 2.00e-05 | 102 |
| hsa0511026 | Oral cavity | OSCC | Vibrio cholerae infection | 32/3704 | 50/8465 | 3.05e-03 | 7.74e-03 | 3.94e-03 | 32 |
| Hugo Symbol | Variant Class | Variant Classification | dbSNP RS | HGVSc | HGVSp | HGVSp Short | SWISSPROT | BIOTYPE | SIFT | PolyPhen | Tumor Sample Barcode | Tissue | Histology | Sex | Age | Stage | Therapy Types | Drugs | Outcome |
| TJP2 | SNV | Missense_Mutation | novel | c.2350N>T | p.Asp784Tyr | p.D784Y | Q9UDY2 | protein_coding | deleterious(0) | benign(0.428) | TCGA-5L-AAT1-01 | Breast | breast invasive carcinoma | Female | <65 | III/IV | Hormone Therapy | letrozol | SD |
| TJP2 | SNV | Missense_Mutation | rs748504603 | c.2930T>G | p.Val977Gly | p.V977G | Q9UDY2 | protein_coding | tolerated(0.08) | benign(0.012) | TCGA-A2-A04Q-01 | Breast | breast invasive carcinoma | Female | <65 | I/II | Chemotherapy | adriamycin | SD |
| TJP2 | SNV | Missense_Mutation | rs748504603 | c.2930T>G | p.Val977Gly | p.V977G | Q9UDY2 | protein_coding | tolerated(0.08) | benign(0.012) | TCGA-A2-A1G0-01 | Breast | breast invasive carcinoma | Female | <65 | I/II | Chemotherapy | taxotere | SD |
| TJP2 | SNV | Missense_Mutation | rs73450853 | c.43N>C | p.Val15Leu | p.V15L | Q9UDY2 | protein_coding | tolerated_low_confidence(0.58) | benign(0.009) | TCGA-AC-A3EH-01 | Breast | breast invasive carcinoma | Female | >=65 | III/IV | Unknown | Unknown | SD |
| TJP2 | SNV | Missense_Mutation | rs748504603 | c.2930N>G | p.Val977Gly | p.V977G | Q9UDY2 | protein_coding | tolerated(0.08) | benign(0.012) | TCGA-B6-A1KN-01 | Breast | breast invasive carcinoma | Female | <65 | III/IV | Unknown | Unknown | SD |
| TJP2 | SNV | Missense_Mutation | rs748504603 | c.2930N>G | p.Val977Gly | p.V977G | Q9UDY2 | protein_coding | tolerated(0.08) | benign(0.012) | TCGA-BH-A0HU-01 | Breast | breast invasive carcinoma | Female | <65 | I/II | Chemotherapy | docetaxel | SD |
| TJP2 | SNV | Missense_Mutation | rs748504603 | c.2930N>G | p.Val977Gly | p.V977G | Q9UDY2 | protein_coding | tolerated(0.08) | benign(0.012) | TCGA-BH-A1F5-01 | Breast | breast invasive carcinoma | Female | <65 | I/II | Unknown | Unknown | SD |
| TJP2 | SNV | Missense_Mutation | rs748504603 | c.2930N>G | p.Val977Gly | p.V977G | Q9UDY2 | protein_coding | tolerated(0.08) | benign(0.012) | TCGA-BH-A1FH-01 | Breast | breast invasive carcinoma | Female | <65 | III/IV | Unknown | Unknown | PD |
| TJP2 | SNV | Missense_Mutation | rs748504603 | c.2930T>G | p.Val977Gly | p.V977G | Q9UDY2 | protein_coding | tolerated(0.08) | benign(0.012) | TCGA-C8-A1HO-01 | Breast | breast invasive carcinoma | Female | <65 | III/IV | Chemotherapy | 5-fluorouracil | CR |
| TJP2 | SNV | Missense_Mutation | | c.2617N>G | p.Gln873Glu | p.Q873E | Q9UDY2 | protein_coding | deleterious(0) | probably_damaging(0.979) | TCGA-C8-A275-01 | Breast | breast invasive carcinoma | Female | <65 | I/II | Unknown | Unknown | SD |


