
|
|||||
|
 | |
| |
| |
| |
| |
| |
|
Gene: TJAP1 |
Gene summary for TJAP1 |
| Gene information | Species | Human | Gene symbol | TJAP1 | Gene ID | 93643 |
| Gene name | tight junction associated protein 1 | |
| Gene Alias | PILT | |
| Cytomap | 6p21.1 | |
| Gene Type | protein-coding | GO ID | GO:0006996 | UniProtAcc | Q5JTD0 |
Top |
Malignant transformation analysis |
| Identification of the aberrant gene expression in precancerous and cancerous lesions by comparing the gene expression of stem-like cells in diseased tissues with normal stem cells |
| Entrez ID | Symbol | Replicates | Species | Organ | Tissue | Adj P-value | Log2FC | Malignancy |
| 93643 | TJAP1 | LZE2T | Human | Esophagus | ESCC | 2.19e-05 | 7.66e-01 | 0.082 |
| 93643 | TJAP1 | LZE4T | Human | Esophagus | ESCC | 6.79e-05 | 1.72e-01 | 0.0811 |
| 93643 | TJAP1 | LZE7T | Human | Esophagus | ESCC | 1.40e-04 | 2.33e-01 | 0.0667 |
| 93643 | TJAP1 | LZE8T | Human | Esophagus | ESCC | 6.68e-06 | 1.82e-01 | 0.067 |
| 93643 | TJAP1 | LZE22T | Human | Esophagus | ESCC | 2.93e-05 | 2.57e-01 | 0.068 |
| 93643 | TJAP1 | LZE24T | Human | Esophagus | ESCC | 5.69e-17 | 2.73e-01 | 0.0596 |
| 93643 | TJAP1 | P1T-E | Human | Esophagus | ESCC | 1.35e-06 | 3.31e-01 | 0.0875 |
| 93643 | TJAP1 | P2T-E | Human | Esophagus | ESCC | 4.13e-20 | 3.05e-01 | 0.1177 |
| 93643 | TJAP1 | P4T-E | Human | Esophagus | ESCC | 6.73e-09 | 2.16e-01 | 0.1323 |
| 93643 | TJAP1 | P5T-E | Human | Esophagus | ESCC | 8.44e-12 | 1.95e-01 | 0.1327 |
| 93643 | TJAP1 | P8T-E | Human | Esophagus | ESCC | 7.28e-16 | 1.83e-01 | 0.0889 |
| 93643 | TJAP1 | P9T-E | Human | Esophagus | ESCC | 1.00e-05 | 1.12e-01 | 0.1131 |
| 93643 | TJAP1 | P10T-E | Human | Esophagus | ESCC | 4.82e-18 | 2.40e-01 | 0.116 |
| 93643 | TJAP1 | P11T-E | Human | Esophagus | ESCC | 5.56e-07 | 3.77e-01 | 0.1426 |
| 93643 | TJAP1 | P12T-E | Human | Esophagus | ESCC | 1.68e-21 | 3.53e-01 | 0.1122 |
| 93643 | TJAP1 | P15T-E | Human | Esophagus | ESCC | 4.53e-17 | 2.23e-01 | 0.1149 |
| 93643 | TJAP1 | P16T-E | Human | Esophagus | ESCC | 2.16e-13 | 2.36e-01 | 0.1153 |
| 93643 | TJAP1 | P17T-E | Human | Esophagus | ESCC | 1.51e-07 | 2.64e-01 | 0.1278 |
| 93643 | TJAP1 | P19T-E | Human | Esophagus | ESCC | 7.08e-03 | 2.63e-01 | 0.1662 |
| 93643 | TJAP1 | P20T-E | Human | Esophagus | ESCC | 5.12e-06 | 1.08e-01 | 0.1124 |
| Page: 1 2 3 4 5 |
| Tissue | Expression Dynamics | Abbreviation |
| Esophagus | 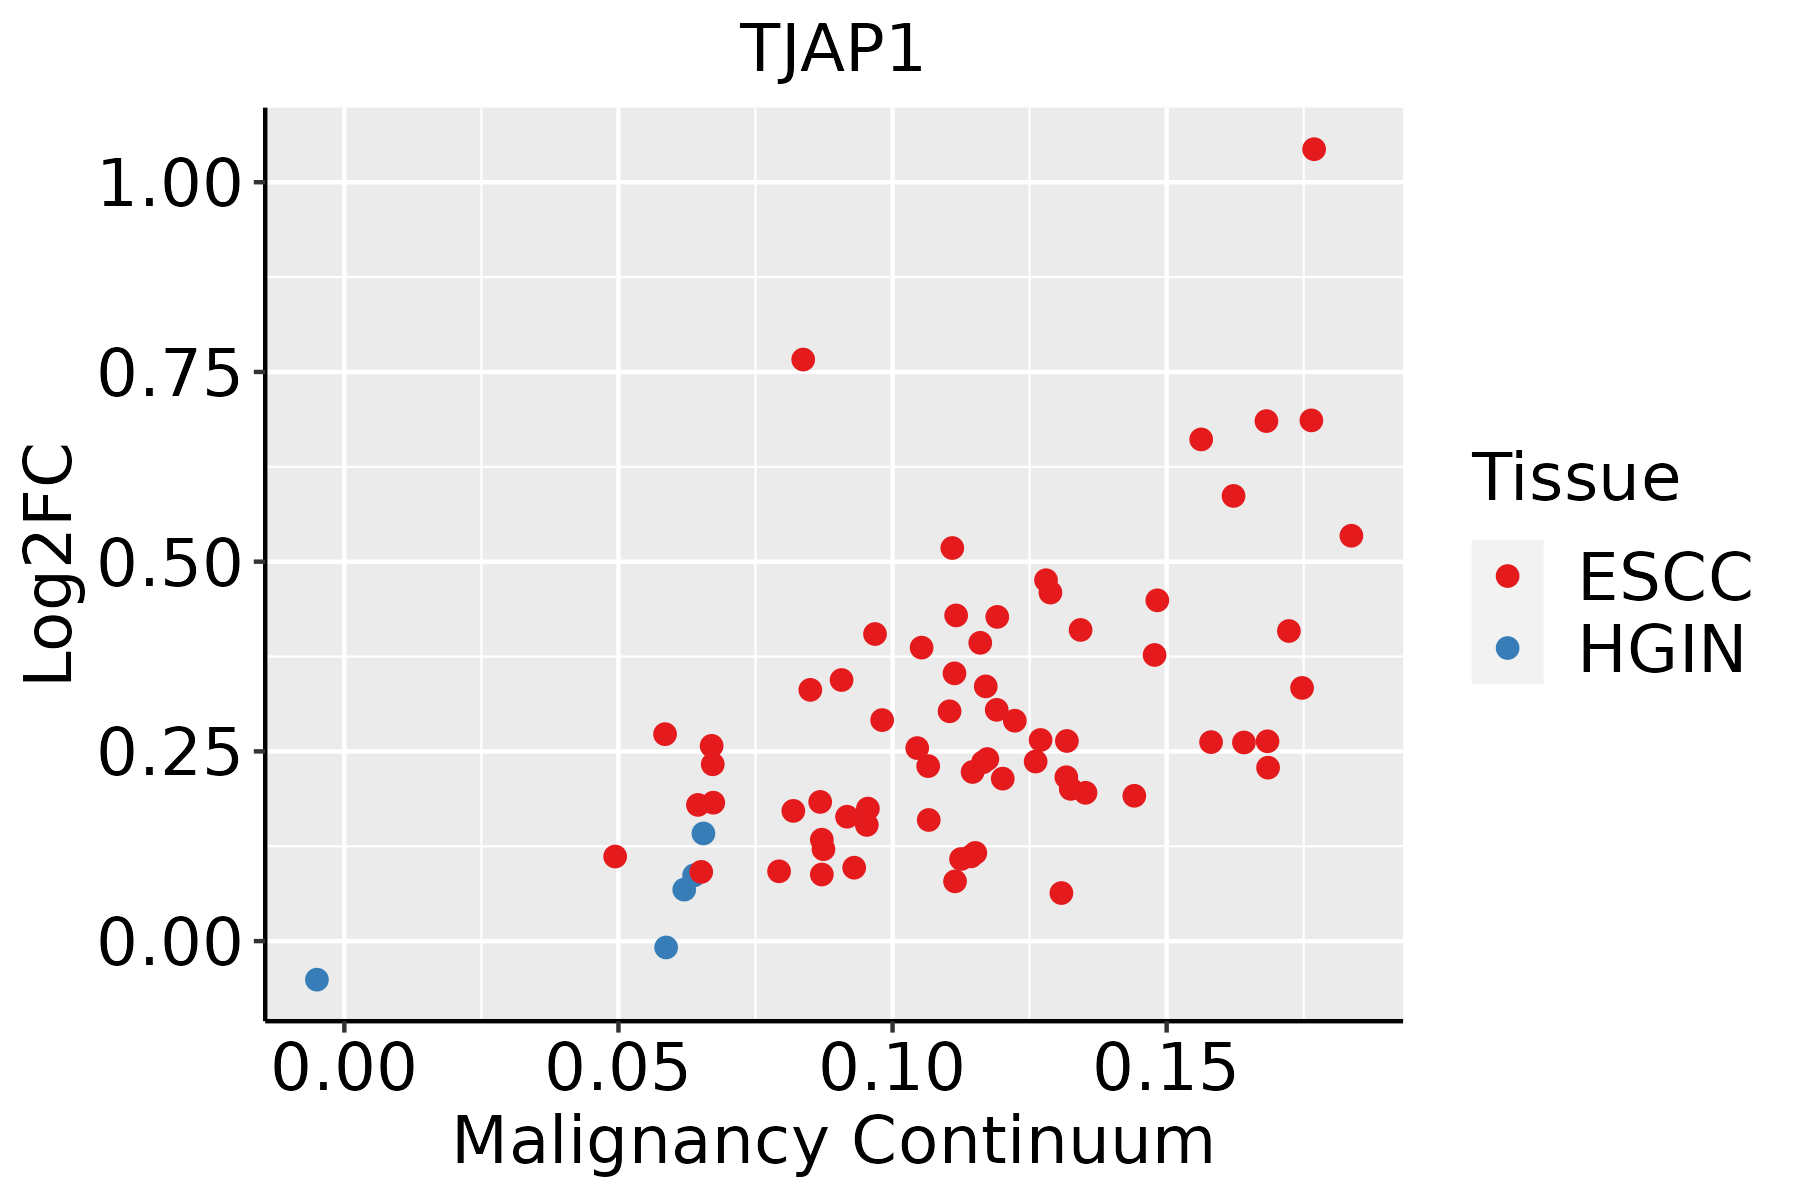 | ESCC: Esophageal squamous cell carcinoma |
| HGIN: High-grade intraepithelial neoplasias | ||
| LGIN: Low-grade intraepithelial neoplasias | ||
| Liver | 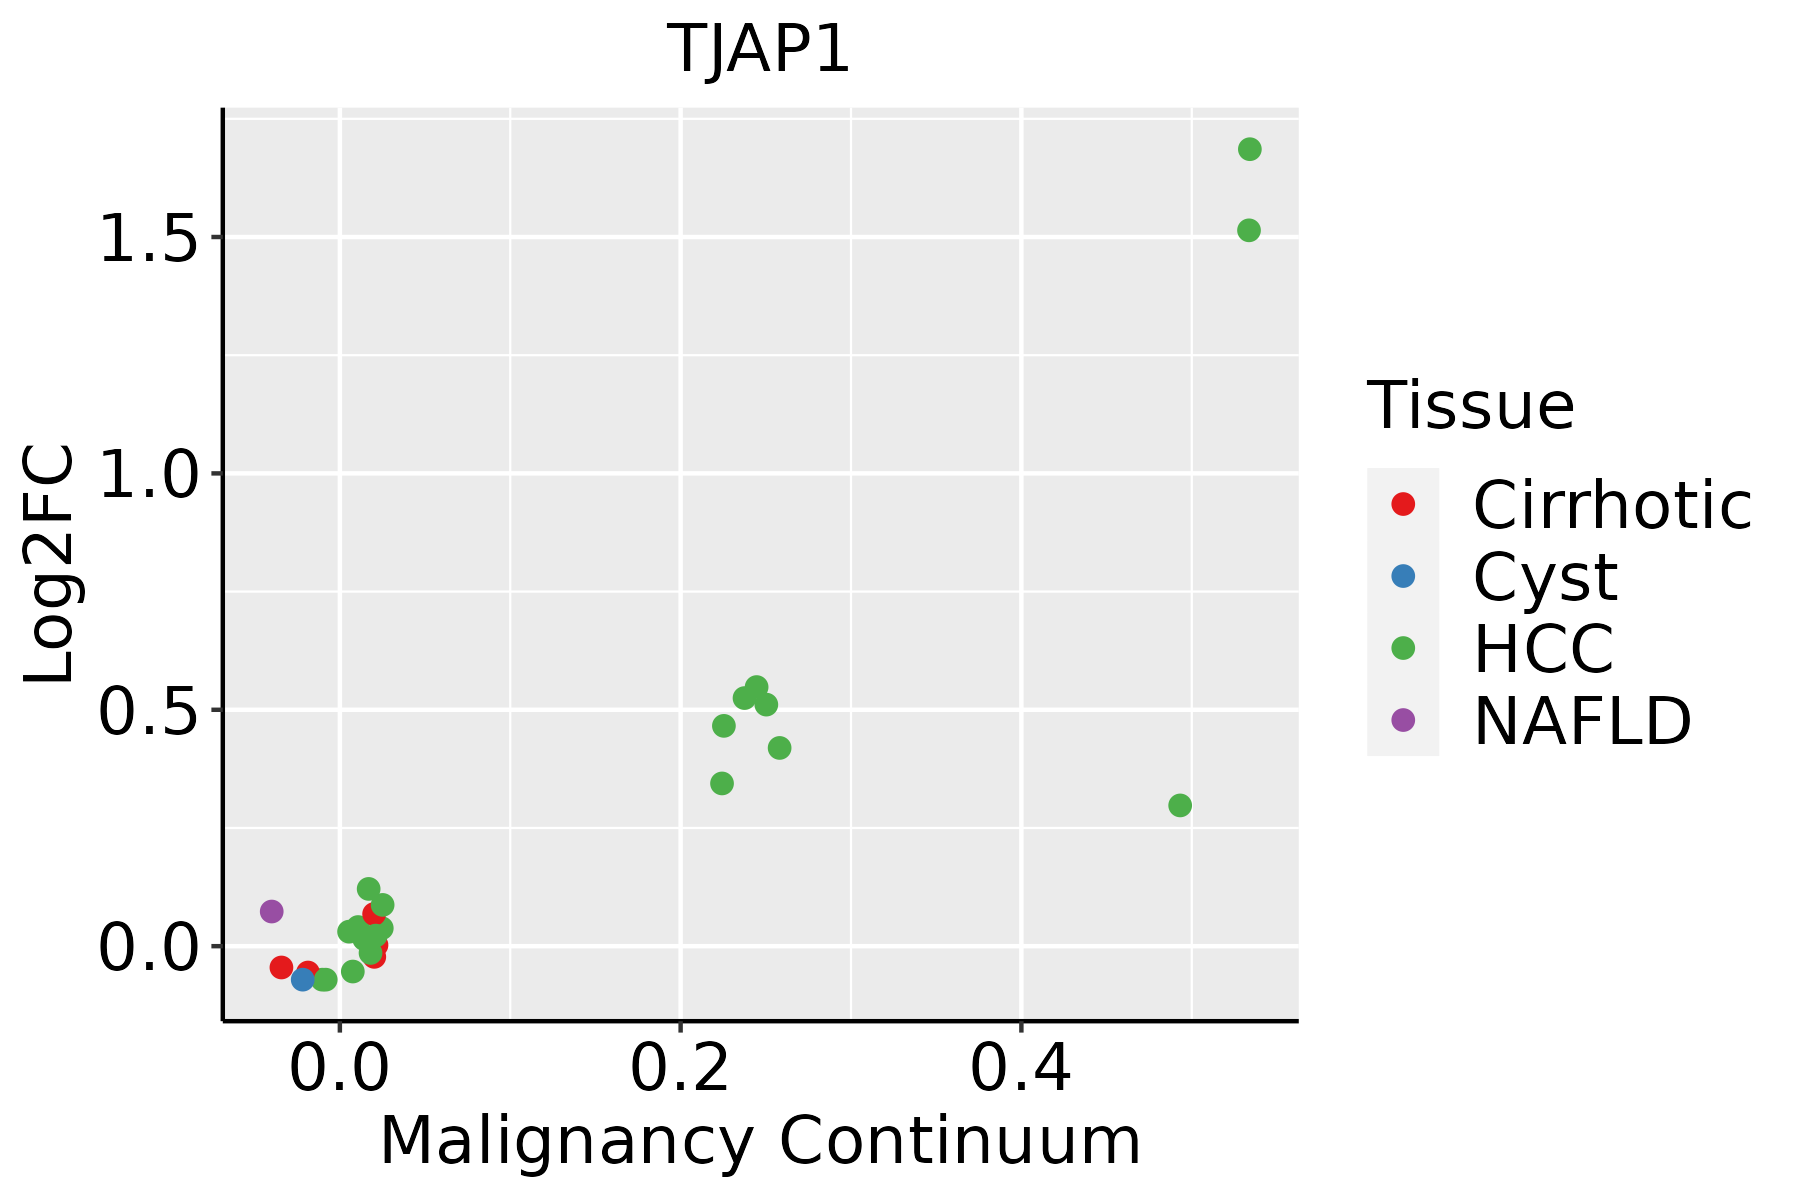 | HCC: Hepatocellular carcinoma |
| NAFLD: Non-alcoholic fatty liver disease | ||
| Oral Cavity | 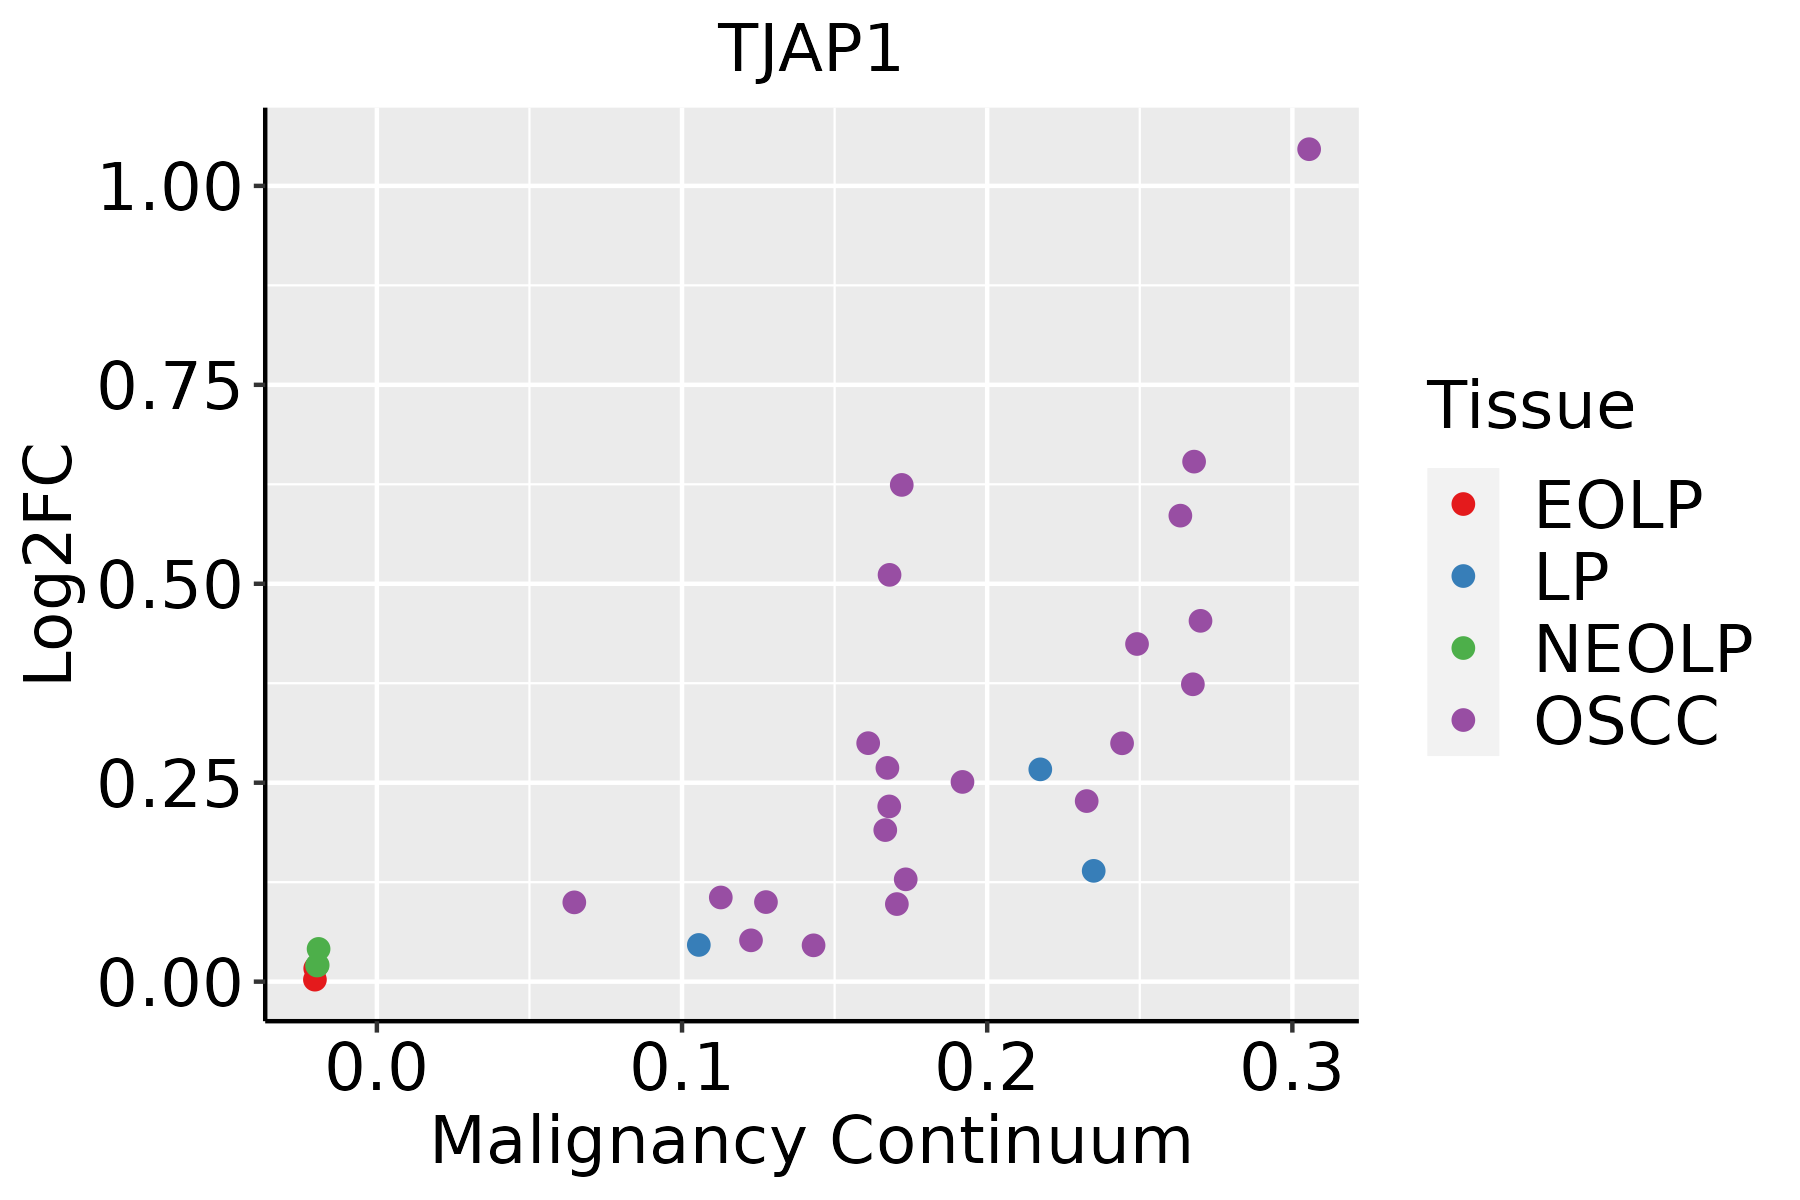 | EOLP: Erosive Oral lichen planus |
| LP: leukoplakia | ||
| NEOLP: Non-erosive oral lichen planus | ||
| OSCC: Oral squamous cell carcinoma |
| ∗log2FC in expression of this searched gene in stem-like cells from each diseased tissue sample relative to stem-like cells in normal samples in each tissue plotted against the malignancy continuum. Samples are colored based on if they are from different disease stage. |
Top |
Malignant transformation related pathway analysis |
| Find out the enriched GO biological processes and KEGG pathways involved in transition from healthy to precancer to cancer |
| Tissue | Disease Stage | Enriched GO biological Processes |
| Colorectum | AD |  |
| Colorectum | SER |  |
| Colorectum | MSS |  |
| Colorectum | MSI-H |  |
| Colorectum | FAP |  |
| ∗Top 15 enriched GO BP terms are showed in the bar plot of each disease state in each tissue. Each row represents a significant GO biological process which is colored according to the -log10(p.adjust). |
| Page: 1 2 3 4 5 6 7 8 9 |
| GO ID | Tissue | Disease Stage | Description | Gene Ratio | Bg Ratio | pvalue | p.adjust | Count |
| GO:00070308 | Esophagus | ESCC | Golgi organization | 101/8552 | 157/18723 | 1.78e-06 | 2.10e-05 | 101 |
| GO:00070302 | Liver | HCC | Golgi organization | 99/7958 | 157/18723 | 1.54e-07 | 2.85e-06 | 99 |
| GO:00070307 | Oral cavity | OSCC | Golgi organization | 92/7305 | 157/18723 | 4.96e-07 | 7.27e-06 | 92 |
| Page: 1 |
| Pathway ID | Tissue | Disease Stage | Description | Gene Ratio | Bg Ratio | pvalue | p.adjust | qvalue | Count |
| hsa04530211 | Esophagus | ESCC | Tight junction | 105/4205 | 169/8465 | 6.73e-04 | 2.23e-03 | 1.14e-03 | 105 |
| hsa04530310 | Esophagus | ESCC | Tight junction | 105/4205 | 169/8465 | 6.73e-04 | 2.23e-03 | 1.14e-03 | 105 |
| hsa0453042 | Liver | HCC | Tight junction | 110/4020 | 169/8465 | 2.45e-06 | 2.28e-05 | 1.27e-05 | 110 |
| hsa0453052 | Liver | HCC | Tight junction | 110/4020 | 169/8465 | 2.45e-06 | 2.28e-05 | 1.27e-05 | 110 |
| hsa0453030 | Oral cavity | OSCC | Tight junction | 102/3704 | 169/8465 | 8.68e-06 | 3.93e-05 | 2.00e-05 | 102 |
| hsa04530114 | Oral cavity | OSCC | Tight junction | 102/3704 | 169/8465 | 8.68e-06 | 3.93e-05 | 2.00e-05 | 102 |
| Page: 1 |
Top |
Cell-cell communication analysis |
| Identification of potential cell-cell interactions between two cell types and their ligand-receptor pairs for different disease states |
| Ligand | Receptor | LRpair | Pathway | Tissue | Disease Stage |
| Page: 1 |
Top |
Single-cell gene regulatory network inference analysis |
| Find out the significant the regulons (TFs) and the target genes of each regulon across cell types for different disease states |
| TF | Cell Type | Tissue | Disease Stage | Target Gene | RSS | Regulon Activity |
| ∗The dot plots of a searched regulon are shown for all cell subpopulations in each disease state of each tissue based on the regulon specific score inferred using pySCENIC and by calculating the average expression. |
| Page: 1 |
Top |
Somatic mutation of malignant transformation related genes |
| Annotation of somatic variants for genes involved in malignant transformation |
| Hugo Symbol | Variant Class | Variant Classification | dbSNP RS | HGVSc | HGVSp | HGVSp Short | SWISSPROT | BIOTYPE | SIFT | PolyPhen | Tumor Sample Barcode | Tissue | Histology | Sex | Age | Stage | Therapy Types | Drugs | Outcome |
| TJAP1 | SNV | Missense_Mutation | c.715N>T | p.Pro239Ser | p.P239S | Q5JTD0 | protein_coding | deleterious(0.01) | possibly_damaging(0.87) | TCGA-AN-A0AK-01 | Breast | breast invasive carcinoma | Female | >=65 | I/II | Unknown | Unknown | SD | |
| TJAP1 | SNV | Missense_Mutation | novel | c.1132A>C | p.Thr378Pro | p.T378P | Q5JTD0 | protein_coding | deleterious(0) | benign(0.122) | TCGA-D8-A1JK-01 | Breast | breast invasive carcinoma | Female | >=65 | I/II | Unknown | Unknown | SD |
| TJAP1 | SNV | Missense_Mutation | c.1424N>A | p.Pro475His | p.P475H | Q5JTD0 | protein_coding | tolerated(0.1) | benign(0.391) | TCGA-D8-A1XK-01 | Breast | breast invasive carcinoma | Female | <65 | I/II | Chemotherapy | doxorubicine+cyclophosphamide | SD | |
| TJAP1 | SNV | Missense_Mutation | rs771385108 | c.65G>A | p.Arg22His | p.R22H | Q5JTD0 | protein_coding | deleterious(0.03) | benign(0.232) | TCGA-2W-A8YY-01 | Cervix | cervical & endocervical cancer | Female | <65 | I/II | Chemotherapy | cisplatin | CR |
| TJAP1 | SNV | Missense_Mutation | novel | c.1069G>A | p.Ala357Thr | p.A357T | Q5JTD0 | protein_coding | deleterious(0) | probably_damaging(0.998) | TCGA-2W-A8YY-01 | Cervix | cervical & endocervical cancer | Female | <65 | I/II | Chemotherapy | cisplatin | CR |
| TJAP1 | SNV | Missense_Mutation | novel | c.1268N>A | p.Pro423Gln | p.P423Q | Q5JTD0 | protein_coding | deleterious(0.03) | probably_damaging(0.984) | TCGA-MA-AA42-01 | Cervix | cervical & endocervical cancer | Female | >=65 | I/II | Unknown | Unknown | SD |
| TJAP1 | SNV | Missense_Mutation | c.761N>A | p.Arg254His | p.R254H | Q5JTD0 | protein_coding | tolerated(0.21) | benign(0.001) | TCGA-A6-2686-01 | Colorectum | colon adenocarcinoma | Female | >=65 | I/II | Unknown | Unknown | SD | |
| TJAP1 | SNV | Missense_Mutation | c.817N>A | p.Asp273Asn | p.D273N | Q5JTD0 | protein_coding | tolerated(0.19) | benign(0.011) | TCGA-AU-6004-01 | Colorectum | colon adenocarcinoma | Female | >=65 | I/II | Unknown | Unknown | SD | |
| TJAP1 | SNV | Missense_Mutation | c.287N>A | p.Arg96His | p.R96H | Q5JTD0 | protein_coding | deleterious(0.03) | benign(0.286) | TCGA-CM-4743-01 | Colorectum | colon adenocarcinoma | Male | >=65 | I/II | Chemotherapy | capecitabine | SD | |
| TJAP1 | SNV | Missense_Mutation | c.19G>C | p.Ala7Pro | p.A7P | Q5JTD0 | protein_coding | deleterious(0) | benign(0.401) | TCGA-AF-2693-01 | Colorectum | rectum adenocarcinoma | Male | >=65 | I/II | Unknown | Unknown | SD |
| Page: 1 2 3 4 5 |
Top |
Related drugs of malignant transformation related genes |
| Identification of chemicals and drugs interact with genes involved in malignant transfromation |
| (DGIdb 4.0) |
| Entrez ID | Symbol | Category | Interaction Types | Drug Claim Name | Drug Name | PMIDs |
| Page: 1 |

Copyright 2023-Present -The University of Texas Health Science Center at Houston |