Schematic overview of the cellular and molecular mechanisms involved in the cancer progression, including the proposed cellular and molecular mechanisms in cancer cells trajectory. AT1: alveolar type 1 cells; AT2: alveolar type 2 cells; AAH: atypical adenomatous hyperplasia; AIS: adenocarcinoma in situ; MIA: minimally invasive adenocarcinoma; IA: invasive adenocarcinoma; EMT: epithelial-mesenchymal transition

Home

Download

Statistics

Help

Contact

Center for Computational Systems Medicine
leaf

Gene summary

leaf

Malignant transformation analysis

leaf

Malignant transformation related pathway analysis

leaf

Cell-cell communication analysis

leaf

Single-cell gene regulatory network inference analysis

leaf

Somatic mutation of malignant transformation related genes

leaf

Related drugs of malignant transformation related genes

Gene: TIPARP

Gene summary for TIPARP

check button Gene summary.

Gene informationSpeciesHuman
Gene symbol

TIPARP

Gene ID

25976

Gene nameTCDD inducible poly(ADP-ribose) polymerase
Gene AliasARTD14
Cytomap3q25.31
Gene Typeprotein-coding
GO ID

GO:0000003

UniProtAcc

Q7Z3E1


Top

Malignant transformation analysis

check button Identification of the aberrant gene expression in precancerous and cancerous lesions by comparing the gene expression of stem-like cells in diseased tissues with normal stem cells
check button Malignant transformation involving gene list.
Entrez IDSymbolReplicatesSpeciesOrganTissueAdj P-valueLog2FCMalignancy
25976TIPARPAEH-subject1HumanEndometriumAEH2.50e-124.05e-01-0.3059
25976TIPARPAEH-subject4HumanEndometriumAEH8.77e-074.21e-01-0.2657
25976TIPARPAEH-subject5HumanEndometriumAEH2.86e-095.17e-01-0.2953
25976TIPARPEEC-subject1HumanEndometriumEEC3.17e-022.98e-01-0.2682
25976TIPARPEEC-subject3HumanEndometriumEEC2.68e-022.60e-01-0.2525
25976TIPARPEEC-subject4HumanEndometriumEEC1.70e-104.90e-01-0.2571
25976TIPARPEEC-subject5HumanEndometriumEEC2.93e-145.15e-01-0.249
25976TIPARPGSM6177620_NYU_UCEC1_lib3_lib3HumanEndometriumEEC2.87e-02-1.60e-01-0.1883
25976TIPARPGSM6177622_NYU_UCEC3_lib1_lib1HumanEndometriumEEC2.70e-05-4.43e-02-0.1917
25976TIPARPGSM6177622_NYU_UCEC3_lib2_lib2HumanEndometriumEEC1.15e-02-1.07e-01-0.1916
25976TIPARPLZE4THumanEsophagusESCC7.49e-074.14e-010.0811
25976TIPARPLZE7THumanEsophagusESCC3.47e-025.57e-010.0667
25976TIPARPLZE8THumanEsophagusESCC2.96e-065.76e-010.067
25976TIPARPLZE20THumanEsophagusESCC9.55e-054.67e-020.0662
25976TIPARPLZE22D1HumanEsophagusHGIN2.72e-03-2.89e-010.0595
25976TIPARPLZE24THumanEsophagusESCC6.24e-032.79e-010.0596
25976TIPARPLZE21THumanEsophagusESCC6.10e-059.75e-010.0655
25976TIPARPP1T-EHumanEsophagusESCC6.51e-061.44e+000.0875
25976TIPARPP2T-EHumanEsophagusESCC2.66e-301.22e+000.1177
25976TIPARPP4T-EHumanEsophagusESCC2.04e-102.44e-010.1323
Page: 1 2 3 4 5 6 7 8 

check button Transcriptomic changes along malignancy continuum.
TissueExpression DynamicsAbbreviation
EndometriumThe image shows the transcriptomic changes along malignancy continuum.log2FC in expression of this searched gene in stem-like cells from each diseased tissue sample relative to stem-like cells in normal samples in each tissue plotted against the malignancy continuum. Samples are colored based on if they are from different disease stage.
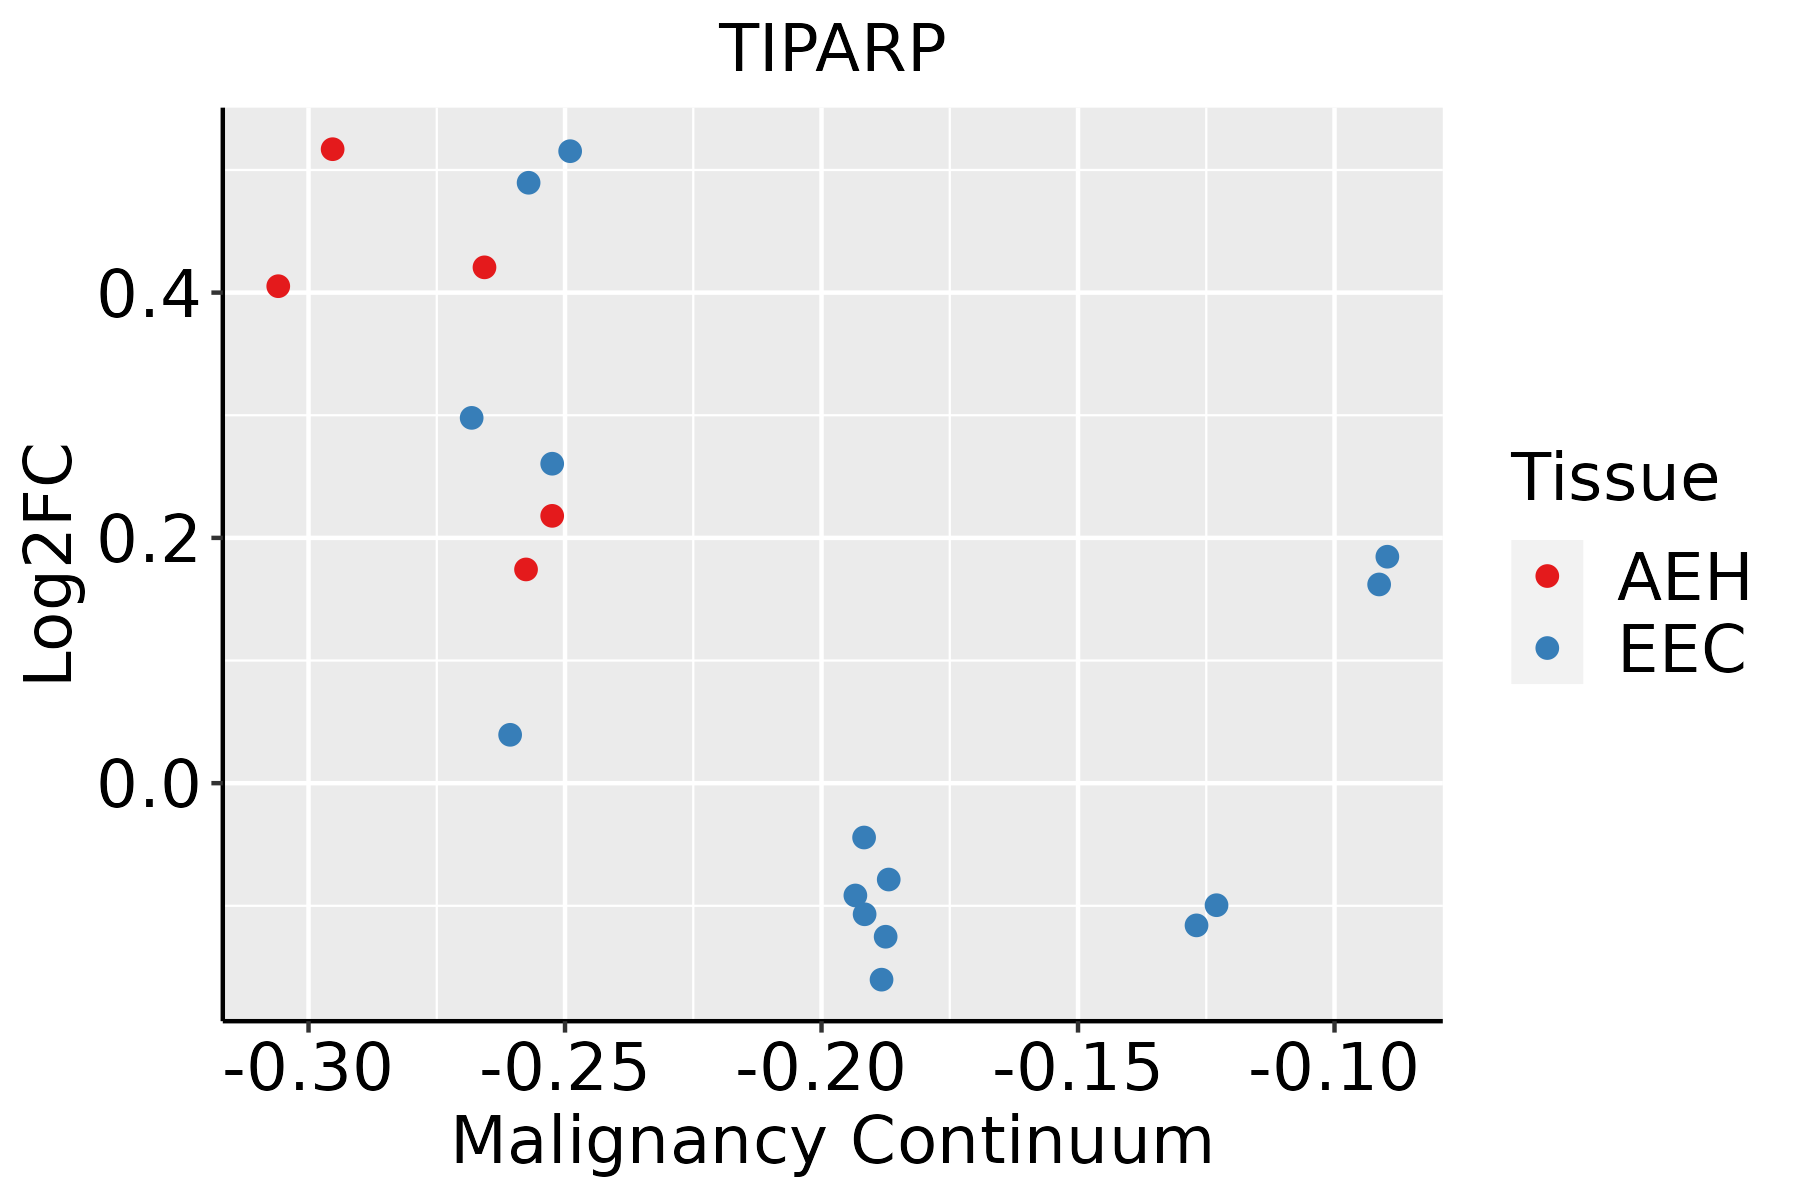
AEH: Atypical endometrial hyperplasia
EEC: Endometrioid Cancer
EsophagusThe image shows the transcriptomic changes along malignancy continuum.log2FC in expression of this searched gene in stem-like cells from each diseased tissue sample relative to stem-like cells in normal samples in each tissue plotted against the malignancy continuum. Samples are colored based on if they are from different disease stage.ESCC: Esophageal squamous cell carcinoma
HGIN: High-grade intraepithelial neoplasias
LGIN: Low-grade intraepithelial neoplasias
LiverThe image shows the transcriptomic changes along malignancy continuum.log2FC in expression of this searched gene in stem-like cells from each diseased tissue sample relative to stem-like cells in normal samples in each tissue plotted against the malignancy continuum. Samples are colored based on if they are from different disease stage.
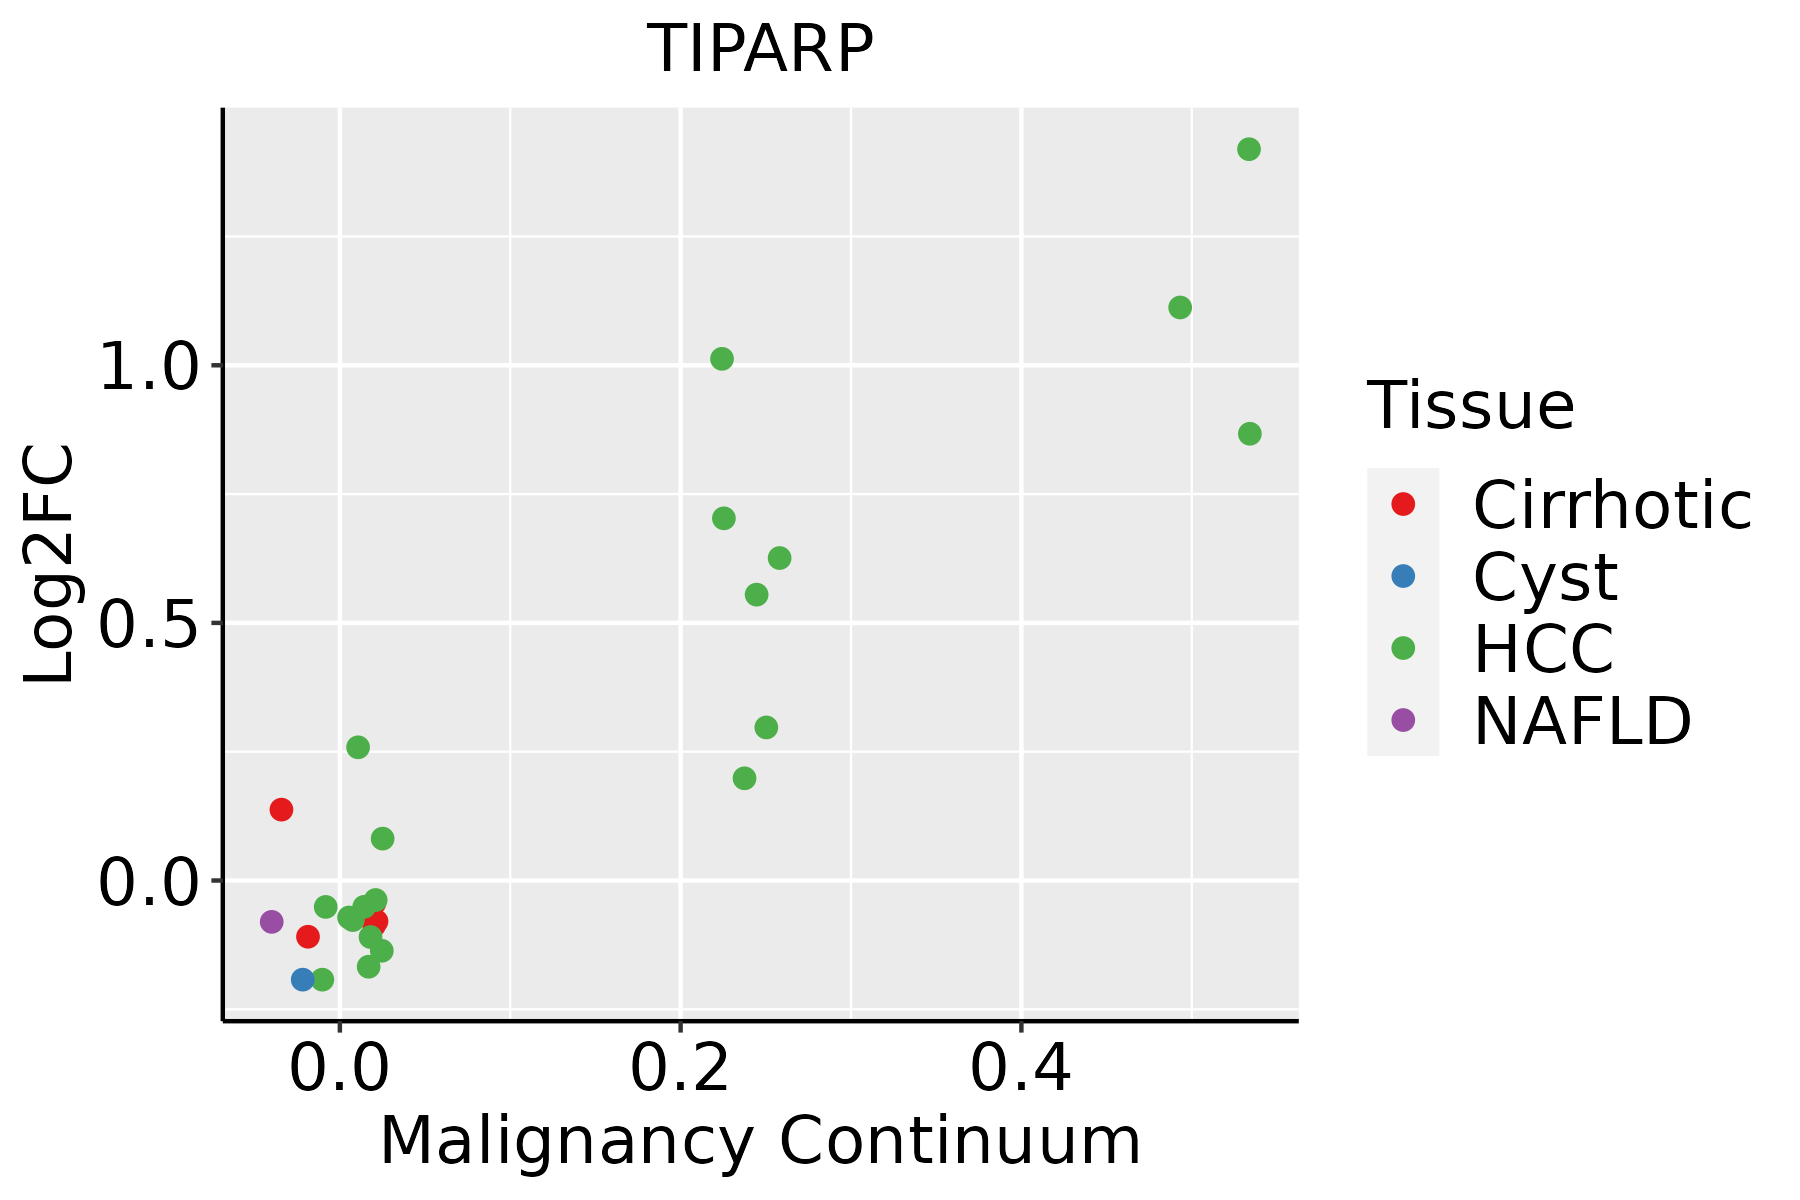
HCC: Hepatocellular carcinoma
NAFLD: Non-alcoholic fatty liver disease
LungThe image shows the transcriptomic changes along malignancy continuum.log2FC in expression of this searched gene in stem-like cells from each diseased tissue sample relative to stem-like cells in normal samples in each tissue plotted against the malignancy continuum. Samples are colored based on if they are from different disease stage.AAH: Atypical adenomatous hyperplasia
AIS: Adenocarcinoma in situ
IAC: Invasive lung adenocarcinoma
MIA: Minimally invasive adenocarcinoma
Oral CavityThe image shows the transcriptomic changes along malignancy continuum.log2FC in expression of this searched gene in stem-like cells from each diseased tissue sample relative to stem-like cells in normal samples in each tissue plotted against the malignancy continuum. Samples are colored based on if they are from different disease stage.EOLP: Erosive Oral lichen planus
LP: leukoplakia
NEOLP: Non-erosive oral lichen planus
OSCC: Oral squamous cell carcinoma
ProstateThe image shows the transcriptomic changes along malignancy continuum.log2FC in expression of this searched gene in stem-like cells from each diseased tissue sample relative to stem-like cells in normal samples in each tissue plotted against the malignancy continuum. Samples are colored based on if they are from different disease stage.
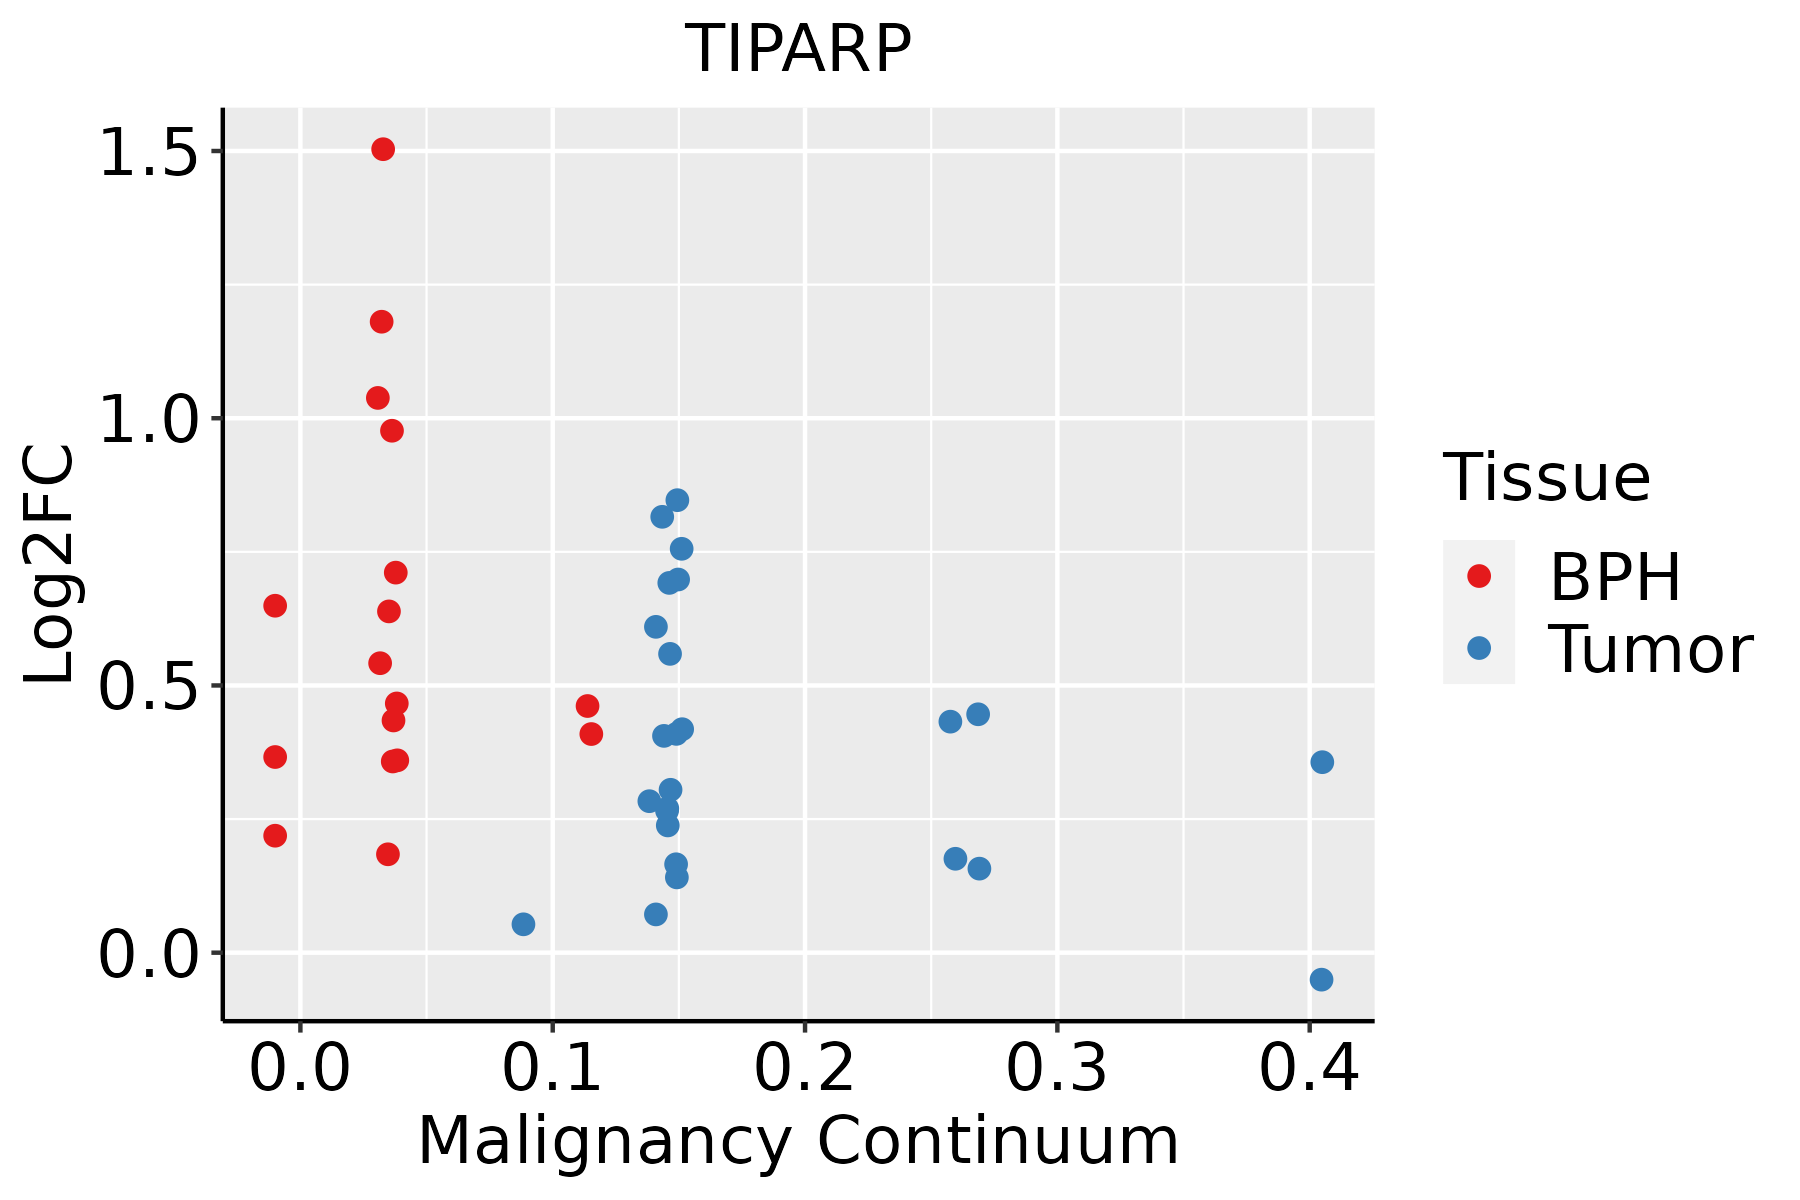
BPH: Benign Prostatic Hyperplasia
SkinThe image shows the transcriptomic changes along malignancy continuum.log2FC in expression of this searched gene in stem-like cells from each diseased tissue sample relative to stem-like cells in normal samples in each tissue plotted against the malignancy continuum. Samples are colored based on if they are from different disease stage.
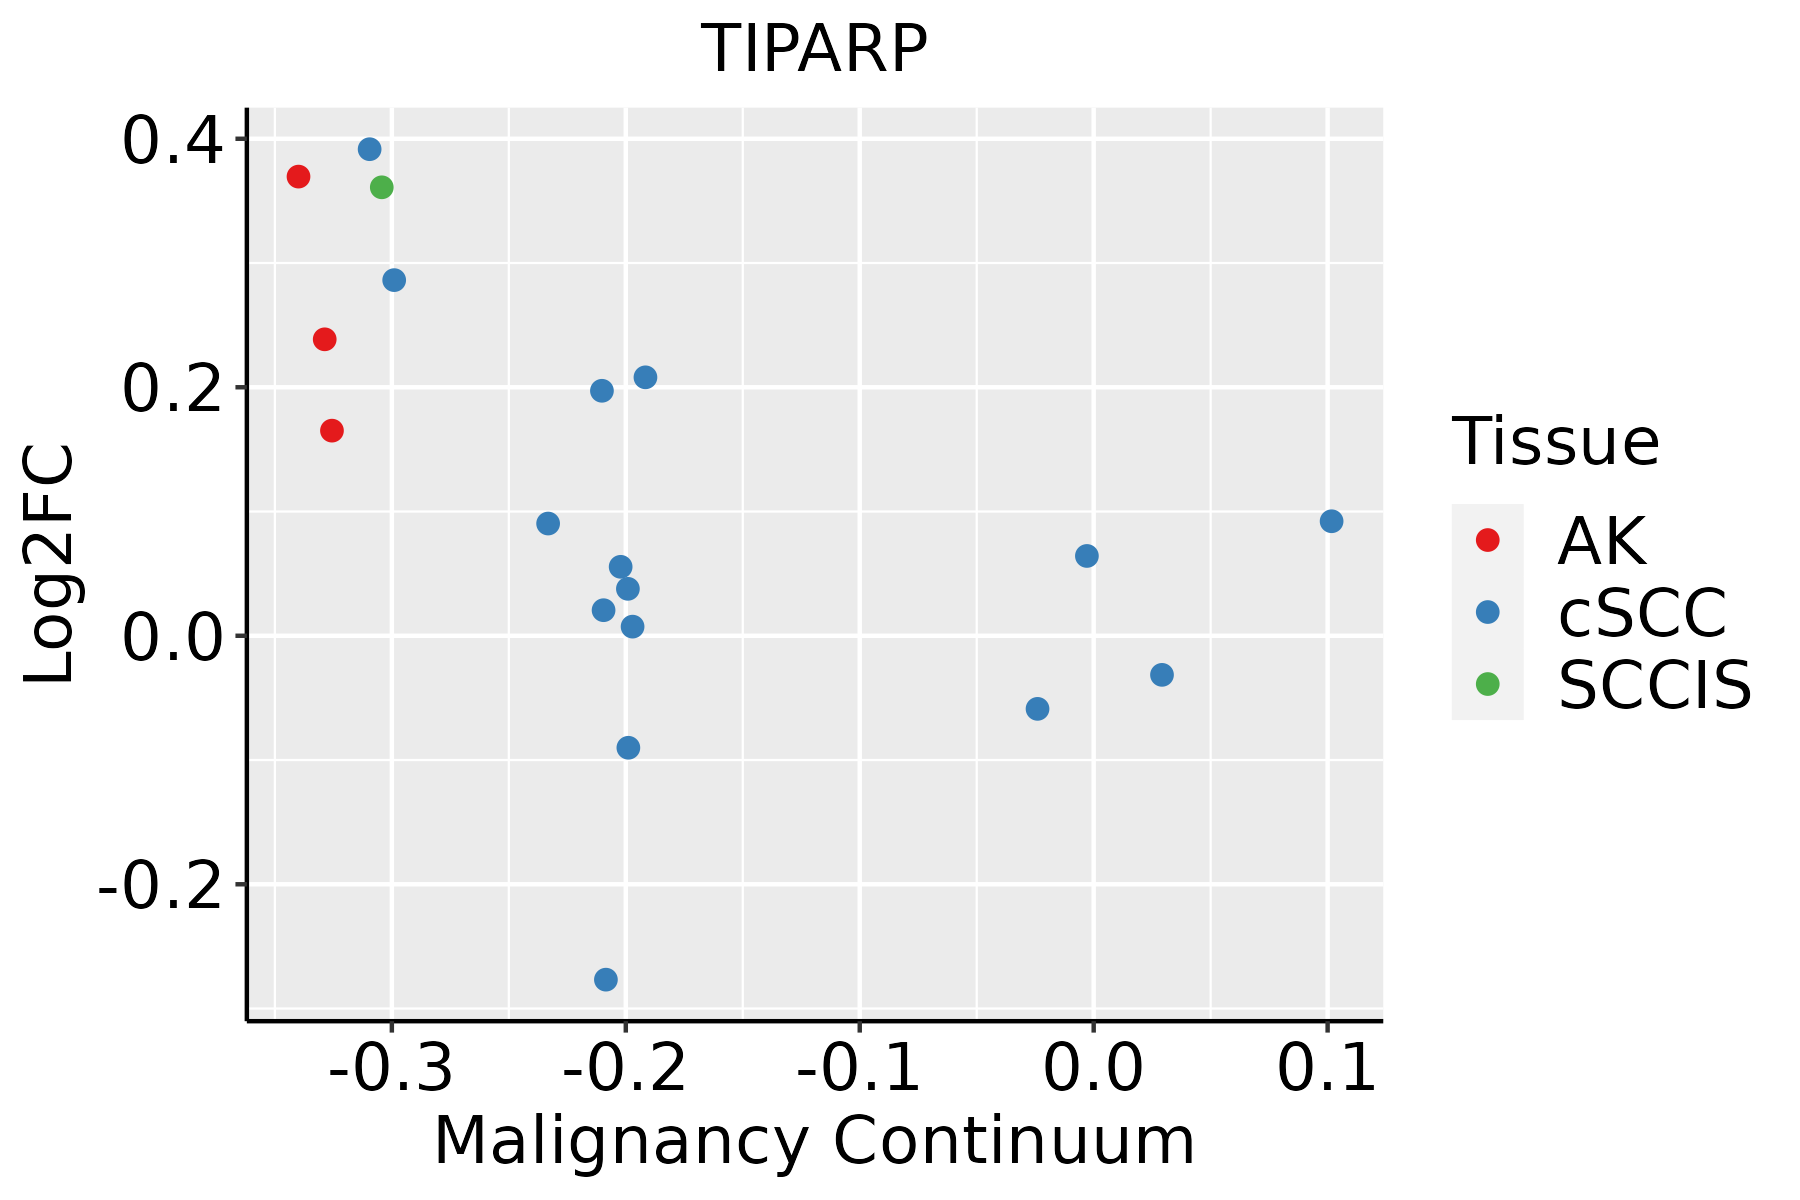
AK: Actinic keratosis
cSCC: Cutaneous squamous cell carcinoma
SCCIS:squamous cell carcinoma in situ
ThyroidThe image shows the transcriptomic changes along malignancy continuum.log2FC in expression of this searched gene in stem-like cells from each diseased tissue sample relative to stem-like cells in normal samples in each tissue plotted against the malignancy continuum. Samples are colored based on if they are from different disease stage.
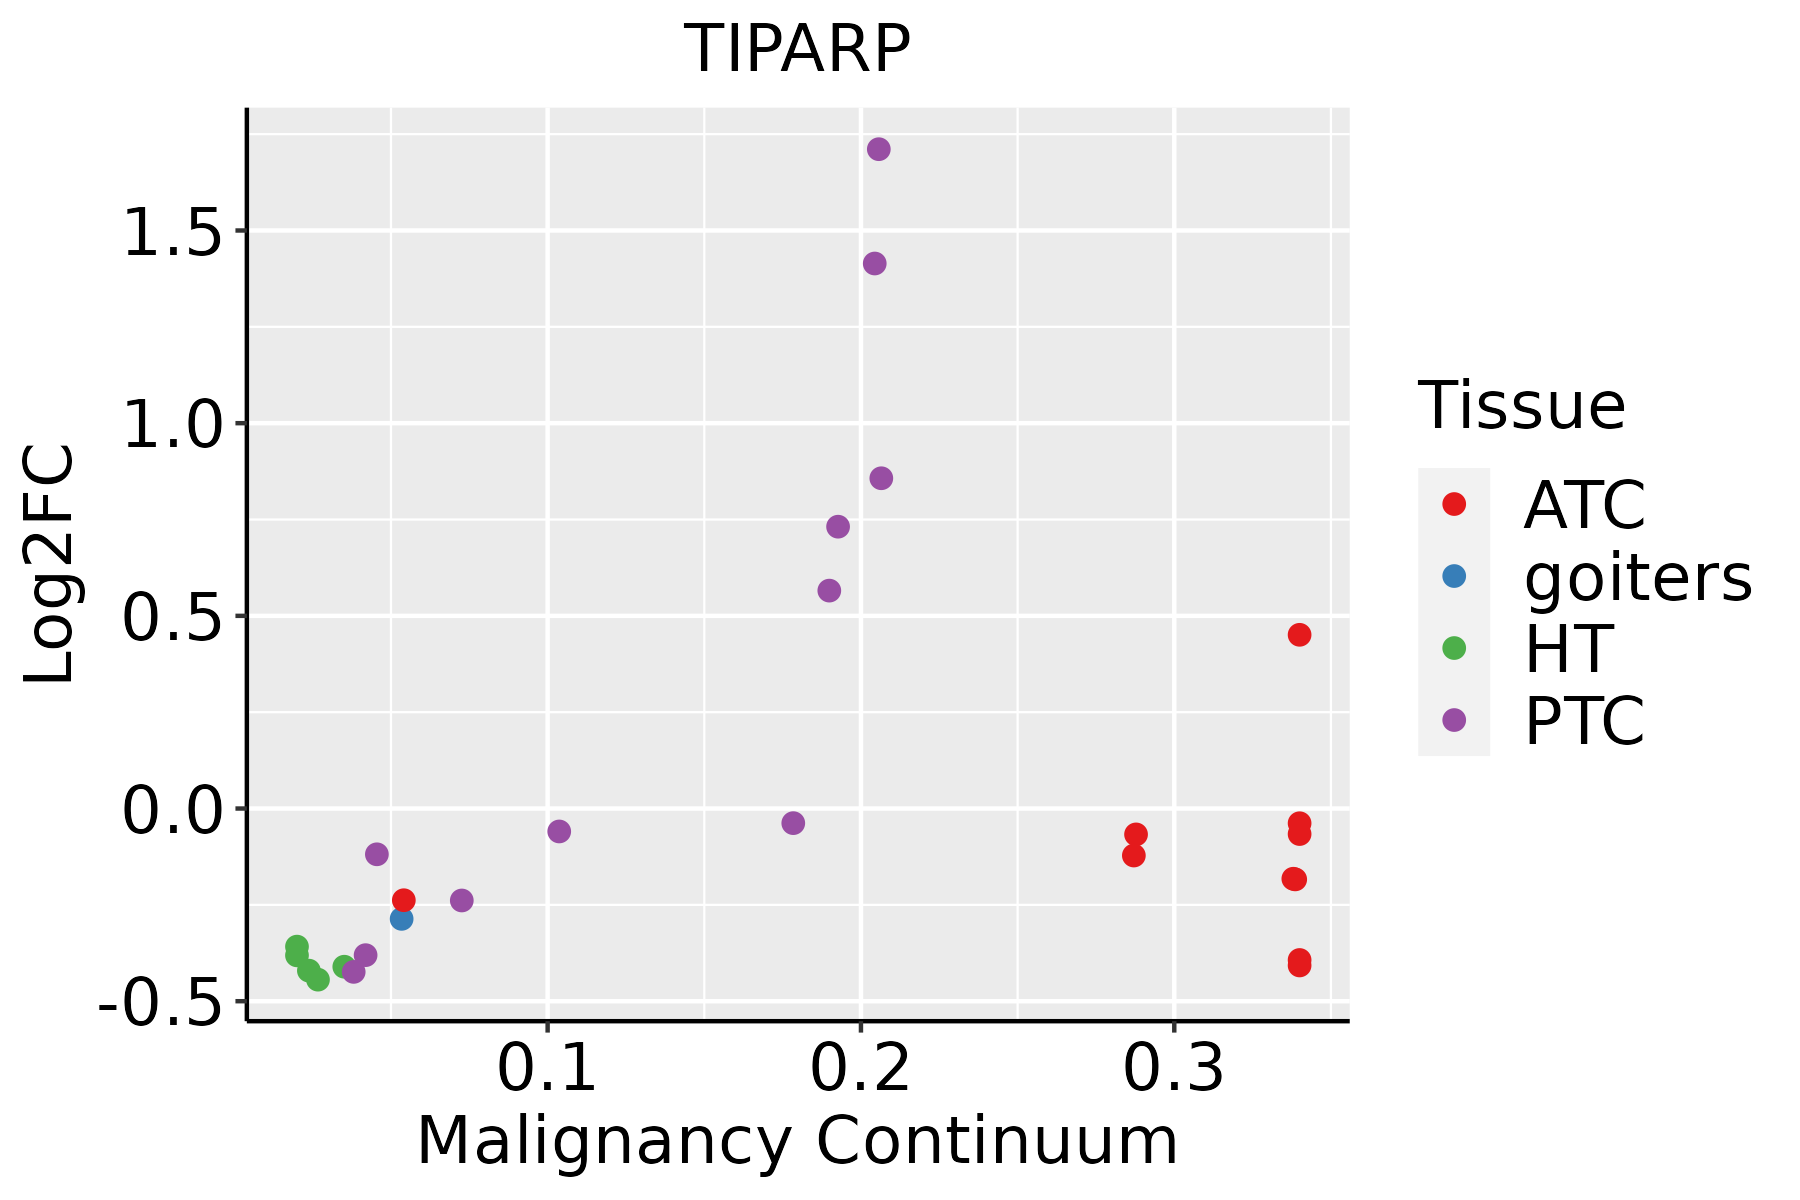
ATC: Anaplastic thyroid cancer
HT: Hashimoto's thyroiditis
PTC: Papillary thyroid cancer
∗log2FC in expression of this searched gene in stem-like cells from each diseased tissue sample relative to stem-like cells in normal samples in each tissue plotted against the malignancy continuum. Samples are colored based on if they are from different disease stage.

Top

Malignant transformation related pathway analysis

check buttonFind out the enriched GO biological processes and KEGG pathways involved in transition from healthy to precancer to cancer
check button Figure of enriched GO biological processes.
TissueDisease StageEnriched GO biological Processes
ColorectumADGO analysis - Figure of enriched GO biological processes: Top 15 enriched GO BP terms are showed in the bar plot of each disease state in each tissue. Each row represents a significant GO biological process which is colored according to the -log10(p.adjust).
ColorectumSERGO analysis - Figure of enriched GO biological processes: Top 15 enriched GO BP terms are showed in the bar plot of each disease state in each tissue. Each row represents a significant GO biological process which is colored according to the -log10(p.adjust).
ColorectumMSSGO analysis - Figure of enriched GO biological processes: Top 15 enriched GO BP terms are showed in the bar plot of each disease state in each tissue. Each row represents a significant GO biological process which is colored according to the -log10(p.adjust).
ColorectumMSI-HGO analysis - Figure of enriched GO biological processes: Top 15 enriched GO BP terms are showed in the bar plot of each disease state in each tissue. Each row represents a significant GO biological process which is colored according to the -log10(p.adjust).
ColorectumFAPGO analysis - Figure of enriched GO biological processes: Top 15 enriched GO BP terms are showed in the bar plot of each disease state in each tissue. Each row represents a significant GO biological process which is colored according to the -log10(p.adjust).
∗Top 15 enriched GO BP terms are showed in the bar plot of each disease state in each tissue. Each row represents a significant GO biological process which is colored according to the -log10(p.adjust).
Page: 1 2 3 4 5 6 7 8 9 

check button Enriched GO biological processes.
GO IDTissueDisease StageDescriptionGene RatioBg Ratiopvaluep.adjustCount
GO:004217616EndometriumAEHregulation of protein catabolic process100/2100391/187239.58e-163.59e-13100
GO:000989616EndometriumAEHpositive regulation of catabolic process104/2100492/187239.38e-111.10e-08104
GO:00614589EndometriumAEHreproductive system development88/2100427/187239.50e-096.41e-0788
GO:00486089EndometriumAEHreproductive structure development87/2100424/187231.43e-089.12e-0787
GO:004573216EndometriumAEHpositive regulation of protein catabolic process56/2100231/187231.60e-089.99e-0756
GO:00605376EndometriumAEHmuscle tissue development83/2100403/187232.57e-081.50e-0683
GO:00016556EndometriumAEHurogenital system development67/2100338/187232.30e-066.76e-0567
GO:00720015EndometriumAEHrenal system development61/2100302/187233.43e-069.24e-0561
GO:00018224EndometriumAEHkidney development57/2100293/187232.25e-054.35e-0457
GO:00465452EndometriumAEHdevelopment of primary female sexual characteristics24/2100100/187232.27e-042.75e-0324
GO:00085852EndometriumAEHfemale gonad development23/210095/187232.65e-043.09e-0323
GO:00466602EndometriumAEHfemale sex differentiation25/2100114/187237.30e-046.99e-0325
GO:00075482EndometriumAEHsex differentiation46/2100276/187233.91e-032.64e-0246
GO:00451372EndometriumAEHdevelopment of primary sexual characteristics39/2100227/187234.45e-032.92e-0239
GO:00084062EndometriumAEHgonad development38/2100221/187234.87e-033.08e-0238
GO:004217617EndometriumEECregulation of protein catabolic process103/2168391/187233.54e-161.52e-13103
GO:000989617EndometriumEECpositive regulation of catabolic process108/2168492/187232.55e-113.64e-09108
GO:004573217EndometriumEECpositive regulation of protein catabolic process59/2168231/187232.69e-092.01e-0759
GO:006145815EndometriumEECreproductive system development91/2168427/187234.54e-093.13e-0791
GO:004860814EndometriumEECreproductive structure development90/2168424/187236.77e-094.41e-0790
Page: 1 2 3 4 5 6 7 8 9 10 11 12 13 

check button Enriched KEGG pathways.
Pathway IDTissueDisease StageDescriptionGene RatioBg Ratiopvaluep.adjustqvalueCount
Page: 1 

Top

Cell-cell communication analysis

check buttonIdentification of potential cell-cell interactions between two cell types and their ligand-receptor pairs for different disease states
LigandReceptorLRpairPathwayTissueDisease Stage
Page: 1 

Top

Single-cell gene regulatory network inference analysis

check buttonFind out the significant the regulons (TFs) and the target genes of each regulon across cell types for different disease states
TFCell TypeTissueDisease StageTarget GeneRSSRegulon Activity
∗The dot plots of a searched regulon are shown for all cell subpopulations in each disease state of each tissue based on the regulon specific score inferred using pySCENIC and by calculating the average expression.
Page: 1 

Top

Somatic mutation of malignant transformation related genes

check buttonAnnotation of somatic variants for genes involved in malignant transformation
Hugo SymbolVariant ClassVariant ClassificationdbSNP RSHGVScHGVSpHGVSp ShortSWISSPROTBIOTYPESIFTPolyPhenTumor Sample BarcodeTissueHistologySexAgeStageTherapy TypesDrugsOutcome
TIPARPSNVMissense_Mutationc.443N>Tp.Ser148Ilep.S148IQ7Z3E1protein_codingtolerated_low_confidence(0.09)benign(0.058)TCGA-B6-A0IB-01Breastbreast invasive carcinomaFemale<65III/IVUnknownUnknownPD
TIPARPSNVMissense_Mutationc.1731N>Cp.Lys577Asnp.K577NQ7Z3E1protein_codingtolerated(0.07)possibly_damaging(0.874)TCGA-BH-A18P-01Breastbreast invasive carcinomaFemale<65I/IIUnknownUnknownPD
TIPARPSNVMissense_Mutationc.244G>Ap.Glu82Lysp.E82KQ7Z3E1protein_codingtolerated_low_confidence(0.71)benign(0.015)TCGA-EW-A1OV-01Breastbreast invasive carcinomaFemale<65I/IIChemotherapyepirubicinSD
TIPARPinsertionFrame_Shift_Insnovelc.559_560insGACTTTATTGGGCACCTAGGATp.Ile188LeufsTer24p.I188Lfs*24Q7Z3E1protein_codingTCGA-B6-A0IB-01Breastbreast invasive carcinomaFemale<65III/IVUnknownUnknownPD
TIPARPinsertionFrame_Shift_Insnovelc.1587_1588insAp.Leu530IlefsTer19p.L530Ifs*19Q7Z3E1protein_codingTCGA-BH-A0HF-01Breastbreast invasive carcinomaFemale>=65I/IIHormone TherapyarimidexSD
TIPARPinsertionIn_Frame_Insnovelc.1588_1589insCAGCACATTTGGAAGAAAACAp.Leu530delinsSerAlaHisLeuGluGluAsnIlep.L530delinsSAHLEENIQ7Z3E1protein_codingTCGA-BH-A0HF-01Breastbreast invasive carcinomaFemale>=65I/IIHormone TherapyarimidexSD
TIPARPdeletionFrame_Shift_Delnovelc.260delNp.Glu87AspfsTer3p.E87Dfs*3Q7Z3E1protein_codingTCGA-D8-A27V-01Breastbreast invasive carcinomaFemale<65I/IIHormone TherapytamoxiphenSD
TIPARPSNVMissense_Mutationrs745377501c.1097G>Ap.Arg366Glnp.R366QQ7Z3E1protein_codingtolerated(0.18)benign(0.044)TCGA-2W-A8YY-01Cervixcervical & endocervical cancerFemale<65I/IIChemotherapycisplatinCR
TIPARPSNVMissense_Mutationrs767797746c.1165N>Gp.Ile389Valp.I389VQ7Z3E1protein_codingtolerated(0.36)benign(0.003)TCGA-C5-A3HE-01Cervixcervical & endocervical cancerFemale<65I/IIUnknownUnknownPD
TIPARPSNVMissense_Mutationnovelc.1778N>Tp.Thr593Metp.T593MQ7Z3E1protein_codingtolerated(0.06)probably_damaging(0.986)TCGA-MA-AA42-01Cervixcervical & endocervical cancerFemale>=65I/IIUnknownUnknownSD
Page: 1 2 3 4 5 6 7 

Top

Related drugs of malignant transformation related genes

check buttonIdentification of chemicals and drugs interact with genes involved in malignant transfromation
(DGIdb 4.0)
Entrez IDSymbolCategoryInteraction TypesDrug Claim NameDrug NamePMIDs
Page: 1