
|
|||||
|
 | |
| |
| |
| |
| |
| |
|
Gene: TINCR |
Gene summary for TINCR |
| Gene information | Species | Human | Gene symbol | TINCR | Gene ID | 257000 |
| Gene name | TINCR ubiquitin domain containing | |
| Gene Alias | LINC00036 | |
| Cytomap | 19p13.3 | |
| Gene Type | ncRNA | GO ID | NA | UniProtAcc | NA |
Top |
Malignant transformation analysis |
| Identification of the aberrant gene expression in precancerous and cancerous lesions by comparing the gene expression of stem-like cells in diseased tissues with normal stem cells |
| Entrez ID | Symbol | Replicates | Species | Organ | Tissue | Adj P-value | Log2FC | Malignancy |
| 257000 | TINCR | GSM4909281 | Human | Breast | IDC | 2.96e-02 | 1.93e-01 | 0.21 |
| 257000 | TINCR | GSM4909282 | Human | Breast | IDC | 2.85e-07 | 3.02e-01 | -0.0288 |
| 257000 | TINCR | GSM4909317 | Human | Breast | IDC | 6.53e-27 | 5.82e-01 | 0.1355 |
| 257000 | TINCR | GSM4909318 | Human | Breast | IDC | 2.84e-06 | 5.89e-01 | 0.2031 |
| 257000 | TINCR | LZE2T | Human | Esophagus | ESCC | 4.12e-03 | 3.35e-01 | 0.082 |
| 257000 | TINCR | LZE4T | Human | Esophagus | ESCC | 2.57e-10 | 3.62e-01 | 0.0811 |
| 257000 | TINCR | LZE5T | Human | Esophagus | ESCC | 3.12e-05 | 3.88e-01 | 0.0514 |
| 257000 | TINCR | LZE24T | Human | Esophagus | ESCC | 6.23e-16 | 4.91e-01 | 0.0596 |
| 257000 | TINCR | LZE21T | Human | Esophagus | ESCC | 6.66e-08 | 4.22e-01 | 0.0655 |
| 257000 | TINCR | P1T-E | Human | Esophagus | ESCC | 1.22e-04 | 3.21e-01 | 0.0875 |
| 257000 | TINCR | P4T-E | Human | Esophagus | ESCC | 1.54e-14 | 3.99e-01 | 0.1323 |
| 257000 | TINCR | P5T-E | Human | Esophagus | ESCC | 8.40e-04 | 8.63e-02 | 0.1327 |
| 257000 | TINCR | P8T-E | Human | Esophagus | ESCC | 4.41e-07 | 1.52e-01 | 0.0889 |
| 257000 | TINCR | P9T-E | Human | Esophagus | ESCC | 5.31e-05 | 2.45e-01 | 0.1131 |
| 257000 | TINCR | P10T-E | Human | Esophagus | ESCC | 1.19e-17 | 3.82e-01 | 0.116 |
| 257000 | TINCR | P11T-E | Human | Esophagus | ESCC | 3.09e-05 | 3.35e-01 | 0.1426 |
| 257000 | TINCR | P12T-E | Human | Esophagus | ESCC | 3.86e-69 | 1.45e+00 | 0.1122 |
| 257000 | TINCR | P15T-E | Human | Esophagus | ESCC | 6.75e-17 | 4.12e-01 | 0.1149 |
| 257000 | TINCR | P20T-E | Human | Esophagus | ESCC | 1.09e-14 | 4.00e-01 | 0.1124 |
| 257000 | TINCR | P21T-E | Human | Esophagus | ESCC | 4.10e-21 | 4.62e-01 | 0.1617 |
| Page: 1 2 3 4 |
| Tissue | Expression Dynamics | Abbreviation |
| Breast | 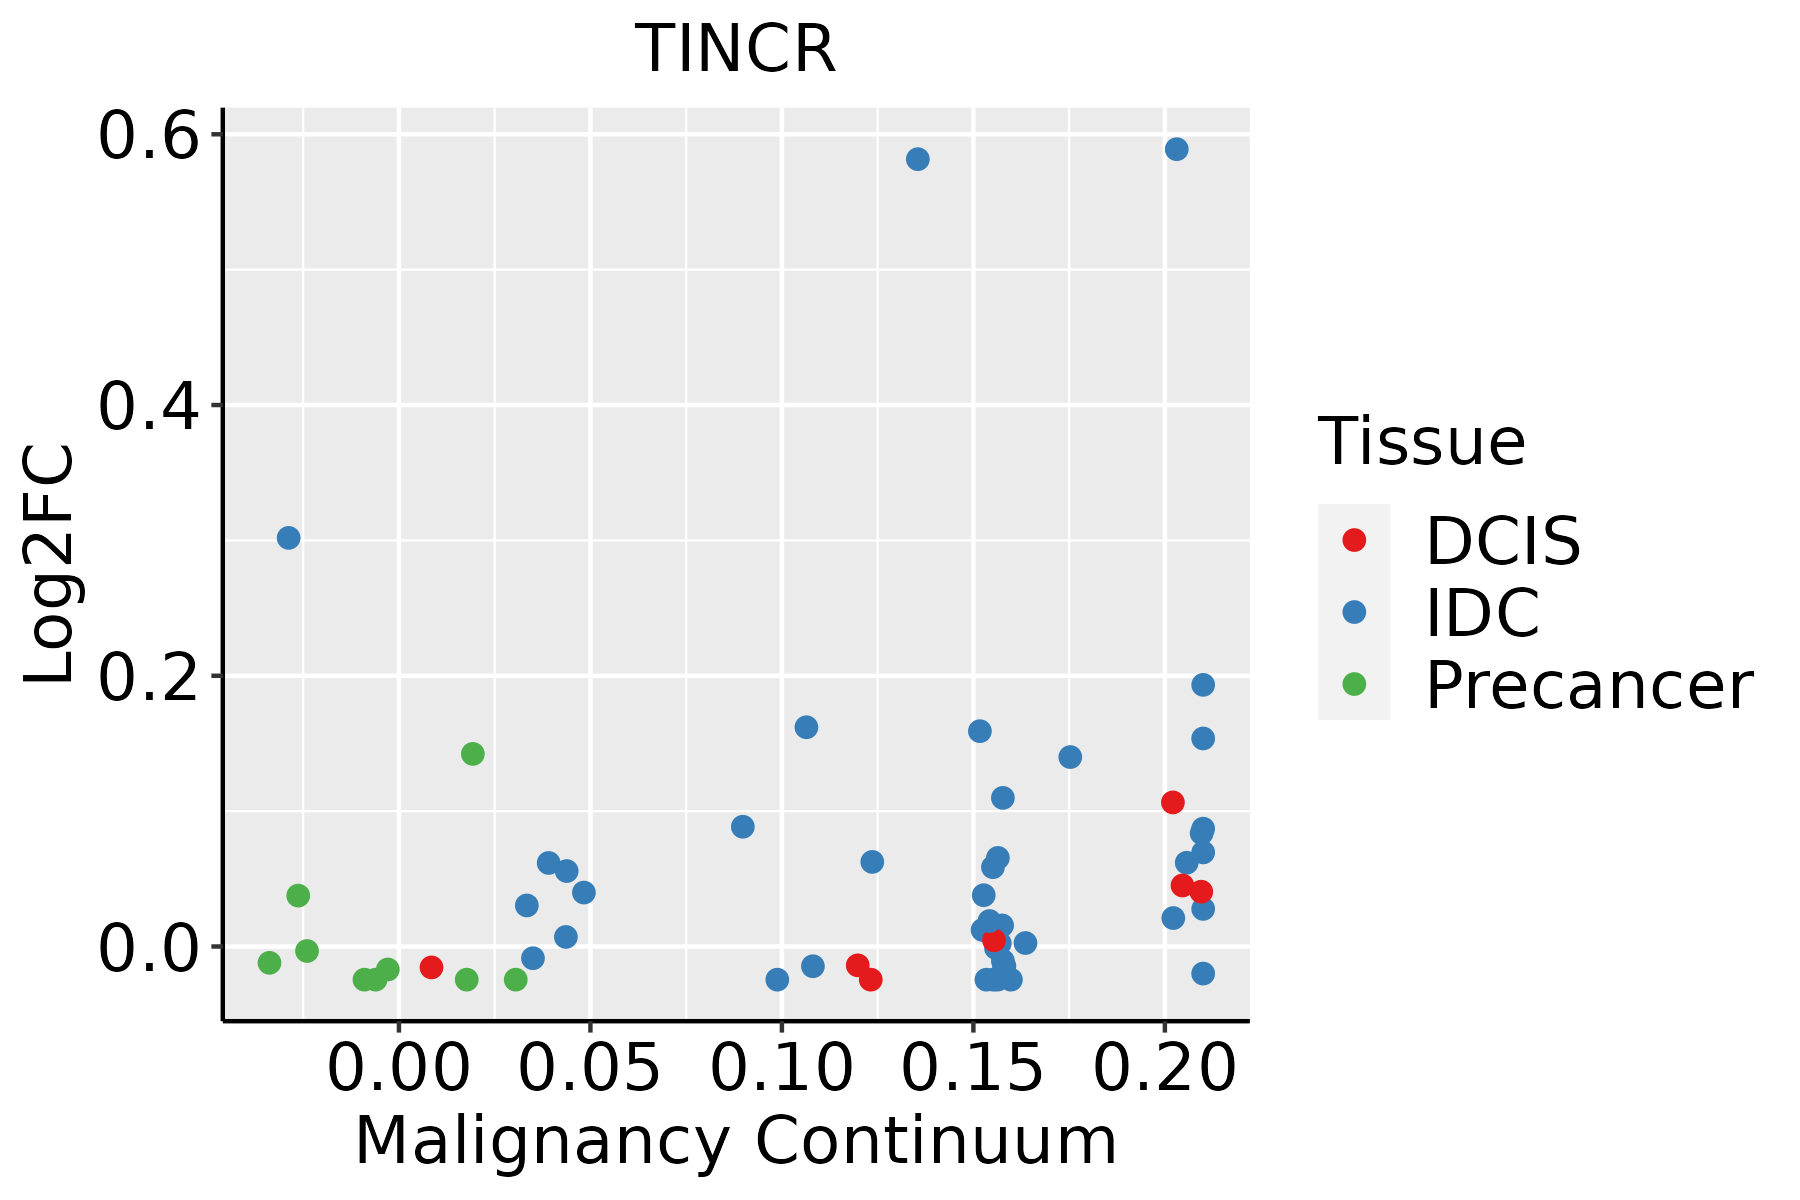 | IDC: Invasive ductal carcinoma |
| DCIS: Ductal carcinoma in situ | ||
| Precancer(BRCA1-mut): Precancerous lesion from BRCA1 mutation carriers | ||
| Esophagus |  | ESCC: Esophageal squamous cell carcinoma |
| HGIN: High-grade intraepithelial neoplasias | ||
| LGIN: Low-grade intraepithelial neoplasias | ||
| Liver | 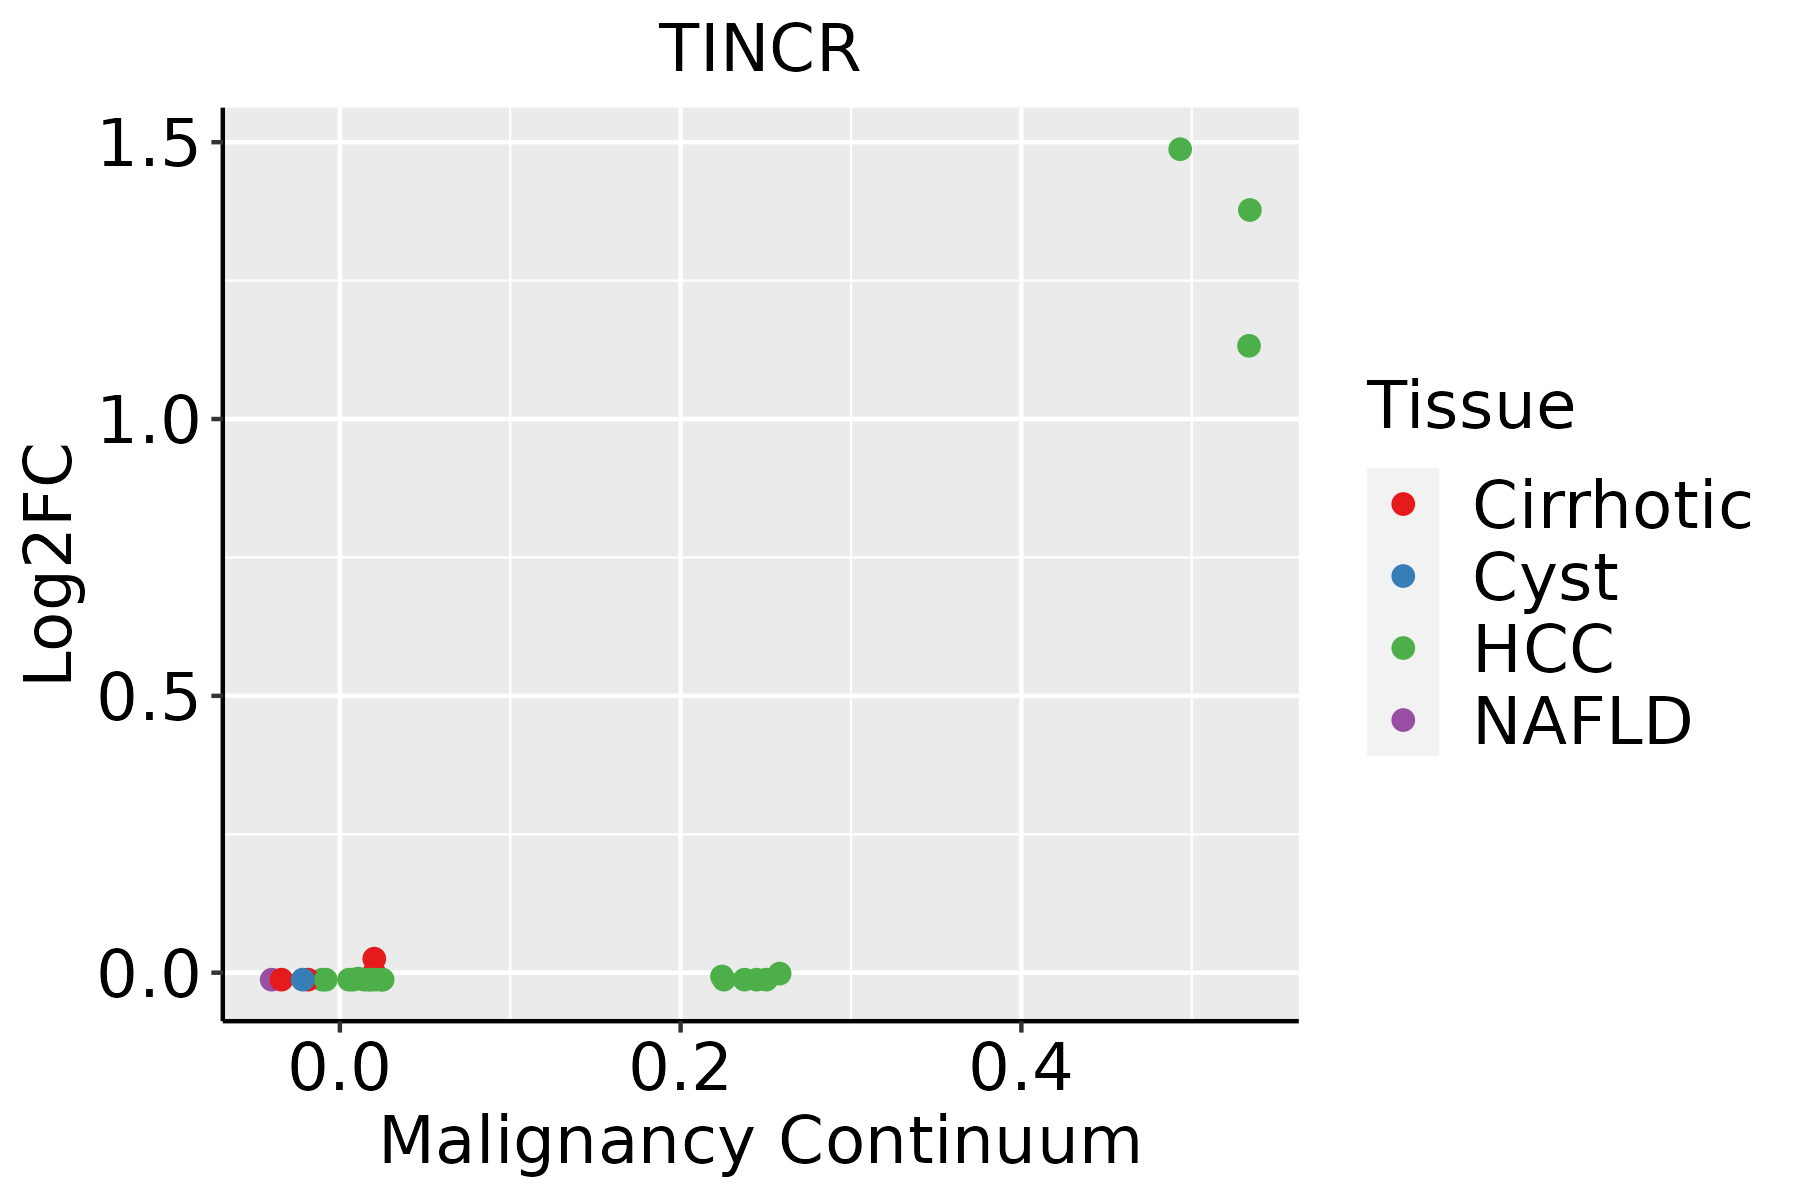 | HCC: Hepatocellular carcinoma |
| NAFLD: Non-alcoholic fatty liver disease | ||
| Oral Cavity | 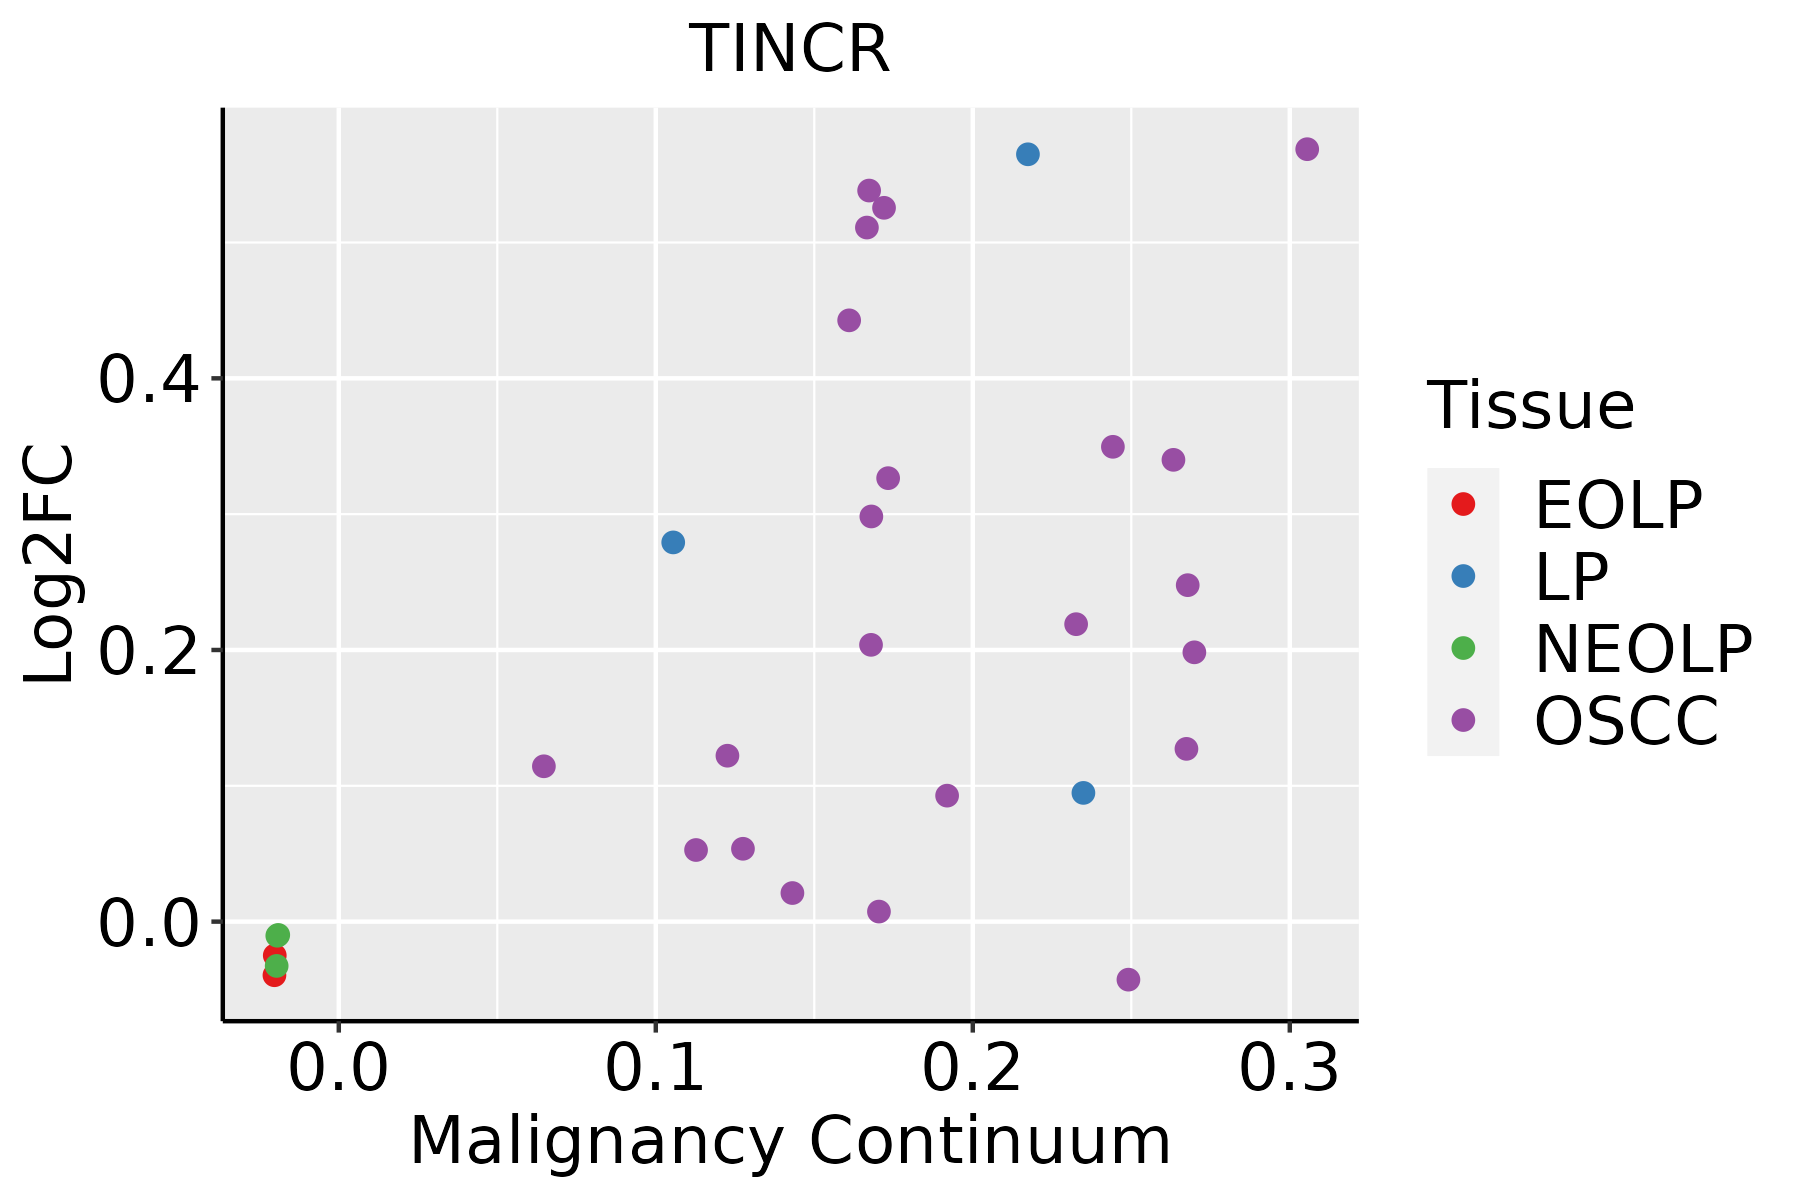 | EOLP: Erosive Oral lichen planus |
| LP: leukoplakia | ||
| NEOLP: Non-erosive oral lichen planus | ||
| OSCC: Oral squamous cell carcinoma | ||
| Skin | 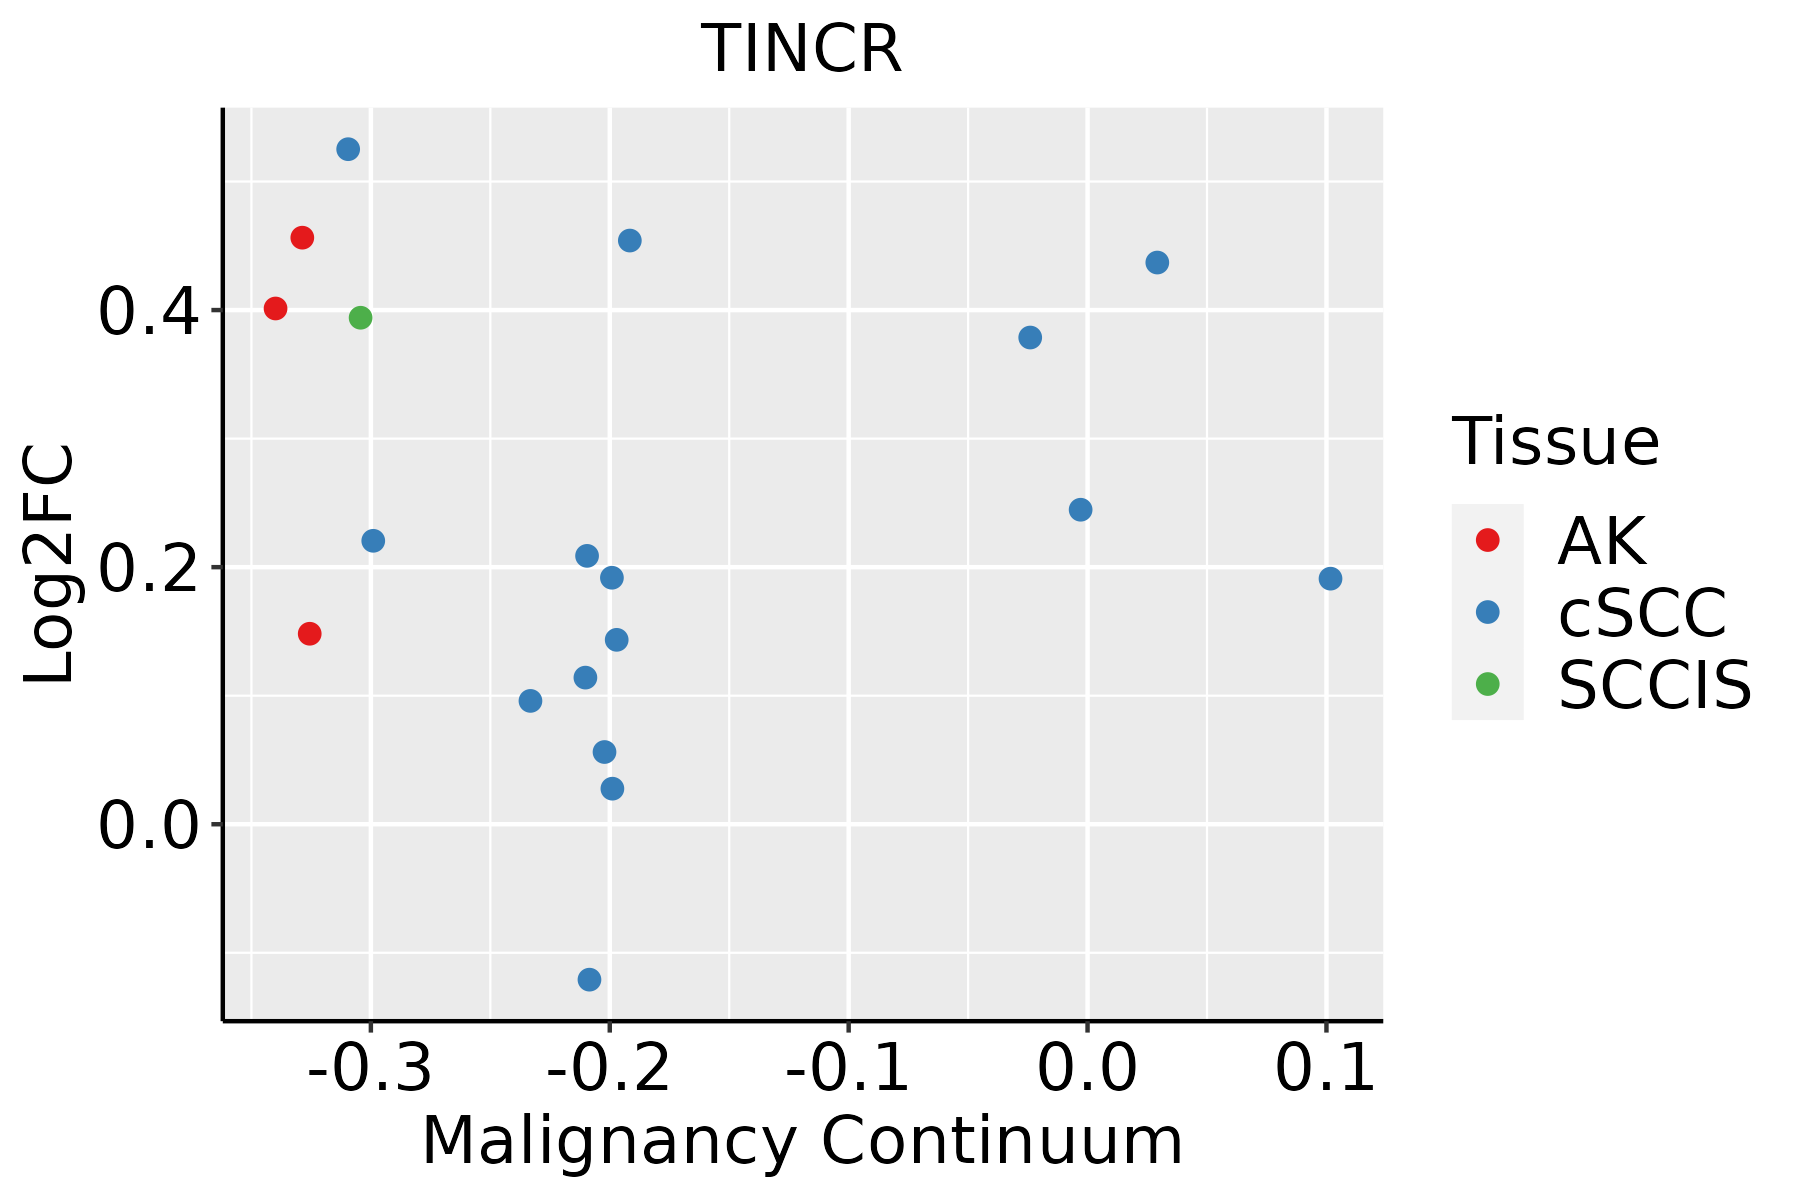 | AK: Actinic keratosis |
| cSCC: Cutaneous squamous cell carcinoma | ||
| SCCIS:squamous cell carcinoma in situ |
| ∗log2FC in expression of this searched gene in stem-like cells from each diseased tissue sample relative to stem-like cells in normal samples in each tissue plotted against the malignancy continuum. Samples are colored based on if they are from different disease stage. |
Top |
Malignant transformation related pathway analysis |
| Find out the enriched GO biological processes and KEGG pathways involved in transition from healthy to precancer to cancer |
| Tissue | Disease Stage | Enriched GO biological Processes |
| Colorectum | AD |  |
| Colorectum | SER |  |
| Colorectum | MSS |  |
| Colorectum | MSI-H |  |
| Colorectum | FAP |  |
| ∗Top 15 enriched GO BP terms are showed in the bar plot of each disease state in each tissue. Each row represents a significant GO biological process which is colored according to the -log10(p.adjust). |
| Page: 1 2 3 4 5 6 7 8 9 |
| GO ID | Tissue | Disease Stage | Description | Gene Ratio | Bg Ratio | pvalue | p.adjust | Count |
| Page: 1 |
| Pathway ID | Tissue | Disease Stage | Description | Gene Ratio | Bg Ratio | pvalue | p.adjust | qvalue | Count |
| Page: 1 |
Top |
Cell-cell communication analysis |
| Identification of potential cell-cell interactions between two cell types and their ligand-receptor pairs for different disease states |
| Ligand | Receptor | LRpair | Pathway | Tissue | Disease Stage |
| Page: 1 |
Top |
Single-cell gene regulatory network inference analysis |
| Find out the significant the regulons (TFs) and the target genes of each regulon across cell types for different disease states |
| TF | Cell Type | Tissue | Disease Stage | Target Gene | RSS | Regulon Activity |
| ∗The dot plots of a searched regulon are shown for all cell subpopulations in each disease state of each tissue based on the regulon specific score inferred using pySCENIC and by calculating the average expression. |
| Page: 1 |
Top |
Somatic mutation of malignant transformation related genes |
| Annotation of somatic variants for genes involved in malignant transformation |
| Hugo Symbol | Variant Class | Variant Classification | dbSNP RS | HGVSc | HGVSp | HGVSp Short | SWISSPROT | BIOTYPE | SIFT | PolyPhen | Tumor Sample Barcode | Tissue | Histology | Sex | Age | Stage | Therapy Types | Drugs | Outcome |
| Page: 1 |
Top |
Related drugs of malignant transformation related genes |
| Identification of chemicals and drugs interact with genes involved in malignant transfromation |
| (DGIdb 4.0) |
| Entrez ID | Symbol | Category | Interaction Types | Drug Claim Name | Drug Name | PMIDs |
| Page: 1 |

Copyright 2023-Present -The University of Texas Health Science Center at Houston |