
|
|||||
|
 | |
| |
| |
| |
| |
| |
|
Gene: TINAGL1 |
Gene summary for TINAGL1 |
| Gene information | Species | Human | Gene symbol | TINAGL1 | Gene ID | 64129 |
| Gene name | tubulointerstitial nephritis antigen like 1 | |
| Gene Alias | ARG1 | |
| Cytomap | 1p35.2 | |
| Gene Type | protein-coding | GO ID | GO:0006810 | UniProtAcc | Q9GZM7 |
Top |
Malignant transformation analysis |
| Identification of the aberrant gene expression in precancerous and cancerous lesions by comparing the gene expression of stem-like cells in diseased tissues with normal stem cells |
| Entrez ID | Symbol | Replicates | Species | Organ | Tissue | Adj P-value | Log2FC | Malignancy |
| 64129 | TINAGL1 | CA_HPV_1 | Human | Cervix | CC | 4.36e-05 | -2.14e-01 | 0.0264 |
| 64129 | TINAGL1 | N_HPV_1 | Human | Cervix | N_HPV | 1.28e-04 | -2.10e-01 | 0.0079 |
| 64129 | TINAGL1 | Tumor | Human | Cervix | CC | 5.07e-07 | 3.16e-01 | 0.1241 |
| 64129 | TINAGL1 | sample1 | Human | Cervix | CC | 4.28e-04 | 3.02e-01 | 0.0959 |
| 64129 | TINAGL1 | sample3 | Human | Cervix | CC | 8.01e-16 | 5.04e-01 | 0.1387 |
| 64129 | TINAGL1 | H2 | Human | Cervix | HSIL_HPV | 1.70e-02 | 2.69e-01 | 0.0632 |
| 64129 | TINAGL1 | T1 | Human | Cervix | CC | 1.04e-07 | 3.66e-01 | 0.0918 |
| 64129 | TINAGL1 | T3 | Human | Cervix | CC | 2.67e-16 | 5.09e-01 | 0.1389 |
| 64129 | TINAGL1 | HTA11_3410_2000001011 | Human | Colorectum | AD | 2.40e-03 | 1.71e-01 | 0.0155 |
| 64129 | TINAGL1 | HTA11_2487_2000001011 | Human | Colorectum | SER | 3.24e-04 | 3.90e-01 | -0.1808 |
| 64129 | TINAGL1 | HTA11_1938_2000001011 | Human | Colorectum | AD | 6.14e-08 | 5.28e-01 | -0.0811 |
| 64129 | TINAGL1 | HTA11_78_2000001011 | Human | Colorectum | AD | 2.18e-02 | 3.56e-01 | -0.1088 |
| 64129 | TINAGL1 | HTA11_347_2000001011 | Human | Colorectum | AD | 6.83e-04 | 3.29e-01 | -0.1954 |
| 64129 | TINAGL1 | HTA11_411_2000001011 | Human | Colorectum | SER | 2.42e-06 | 1.59e+00 | -0.2602 |
| 64129 | TINAGL1 | HTA11_696_2000001011 | Human | Colorectum | AD | 8.71e-04 | 2.07e-01 | -0.1464 |
| 64129 | TINAGL1 | HTA11_1391_2000001011 | Human | Colorectum | AD | 3.72e-06 | 5.00e-01 | -0.059 |
| 64129 | TINAGL1 | HTA11_866_3004761011 | Human | Colorectum | AD | 4.44e-05 | 2.58e-01 | 0.096 |
| 64129 | TINAGL1 | HTA11_7696_3000711011 | Human | Colorectum | AD | 4.29e-07 | 2.76e-01 | 0.0674 |
| 64129 | TINAGL1 | HTA11_99999970781_79442 | Human | Colorectum | MSS | 1.08e-08 | 3.20e-01 | 0.294 |
| 64129 | TINAGL1 | HTA11_99999971662_82457 | Human | Colorectum | MSS | 1.99e-15 | 5.67e-01 | 0.3859 |
| Page: 1 2 3 4 5 6 |
| Tissue | Expression Dynamics | Abbreviation |
| Cervix |  | CC: Cervix cancer |
| HSIL_HPV: HPV-infected high-grade squamous intraepithelial lesions | ||
| N_HPV: HPV-infected normal cervix | ||
| Colorectum (GSE201348) |  | FAP: Familial adenomatous polyposis |
| CRC: Colorectal cancer | ||
| Colorectum (HTA11) |  | AD: Adenomas |
| SER: Sessile serrated lesions | ||
| MSI-H: Microsatellite-high colorectal cancer | ||
| MSS: Microsatellite stable colorectal cancer | ||
| Esophagus |  | ESCC: Esophageal squamous cell carcinoma |
| HGIN: High-grade intraepithelial neoplasias | ||
| LGIN: Low-grade intraepithelial neoplasias | ||
| Liver | 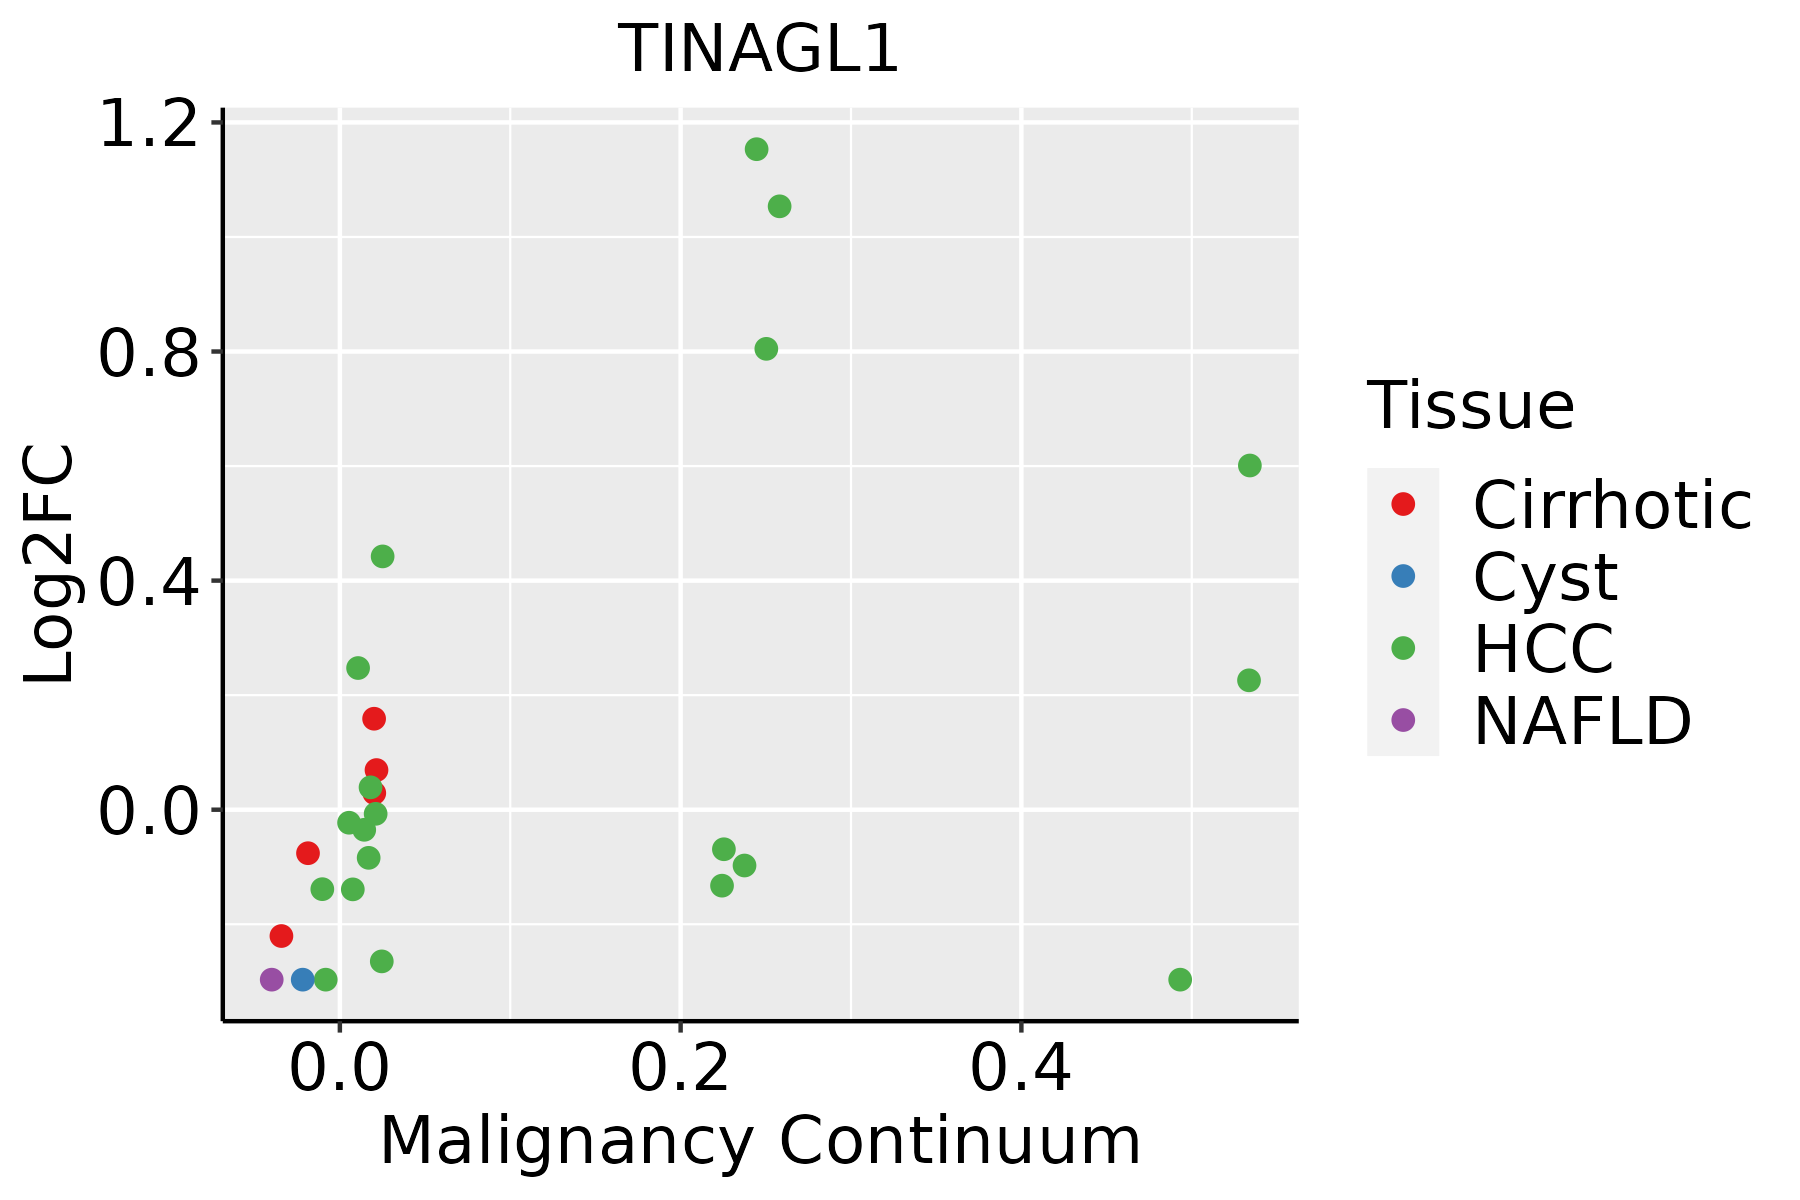 | HCC: Hepatocellular carcinoma |
| NAFLD: Non-alcoholic fatty liver disease | ||
| Oral Cavity | 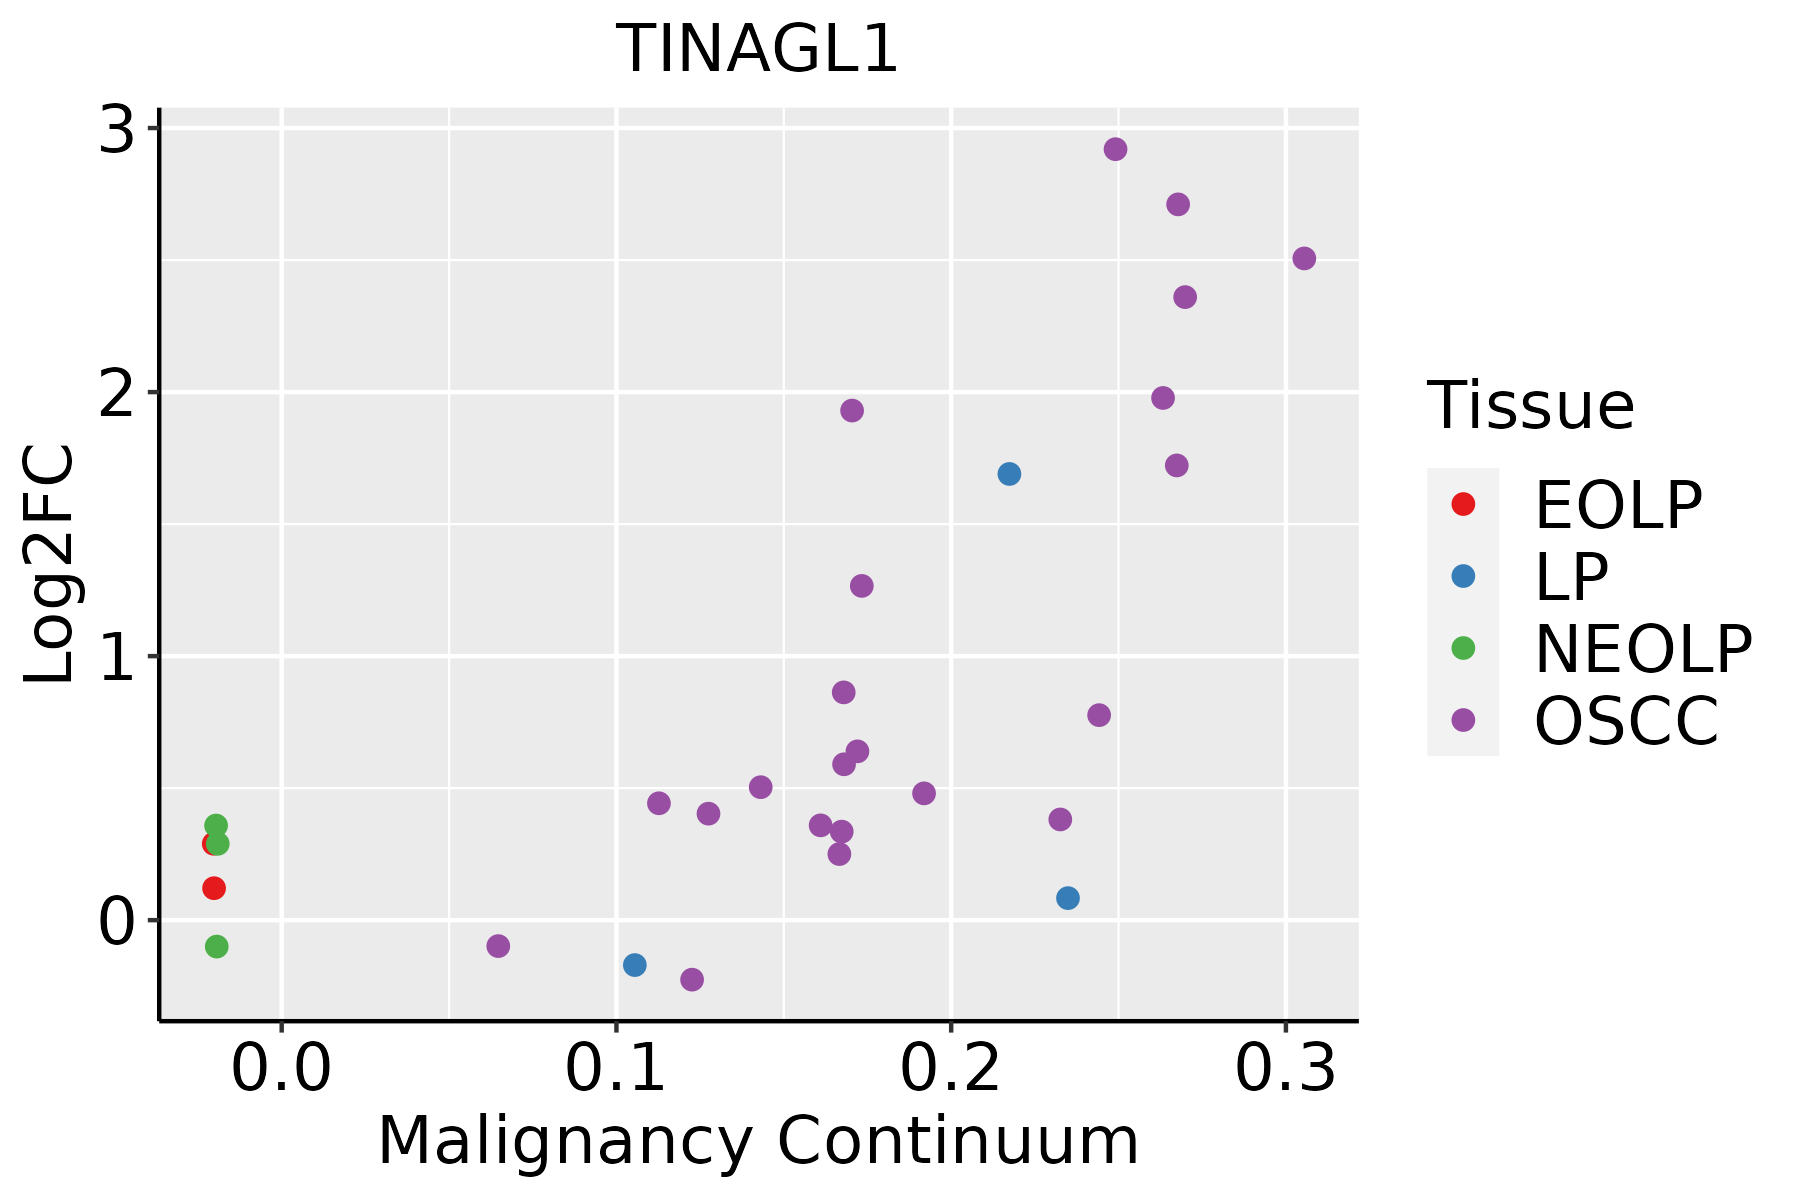 | EOLP: Erosive Oral lichen planus |
| LP: leukoplakia | ||
| NEOLP: Non-erosive oral lichen planus | ||
| OSCC: Oral squamous cell carcinoma | ||
| Prostate | 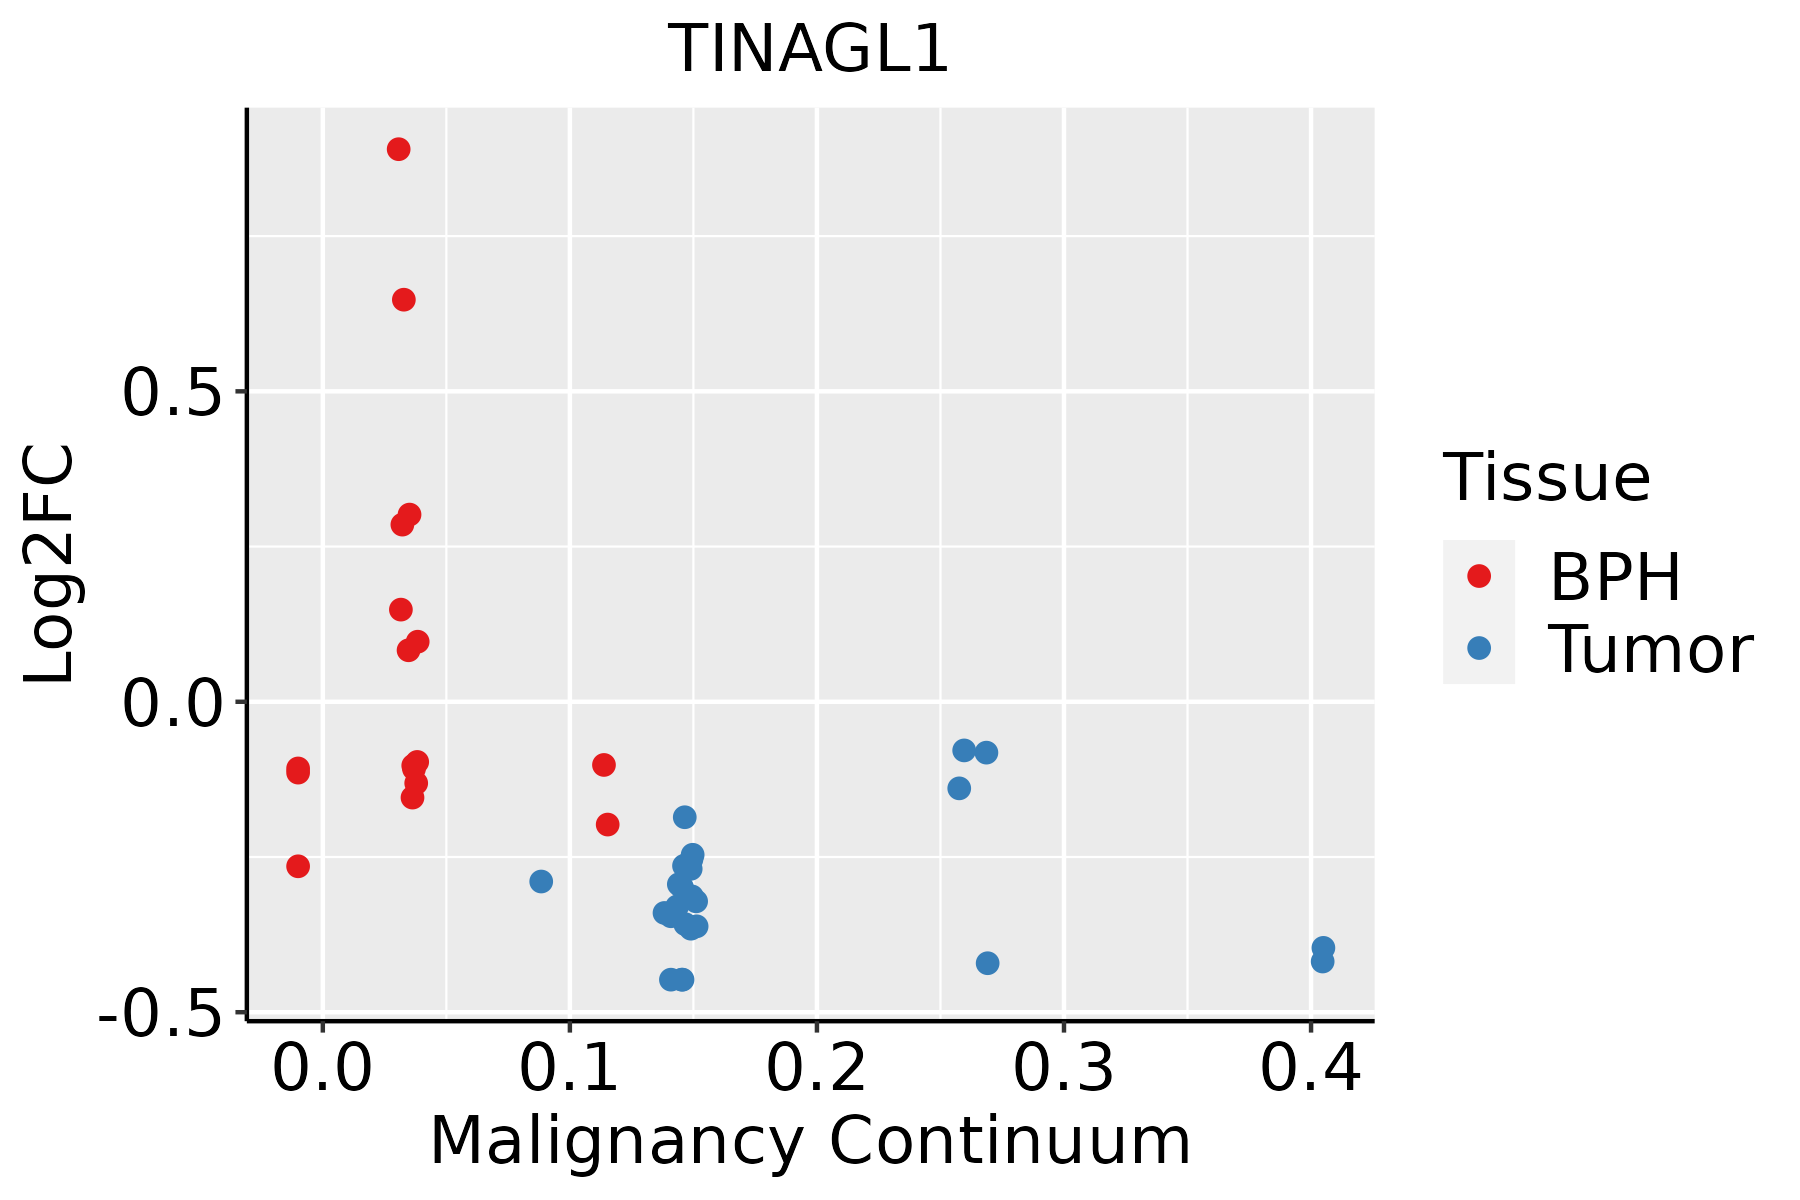 | BPH: Benign Prostatic Hyperplasia |
| Thyroid | 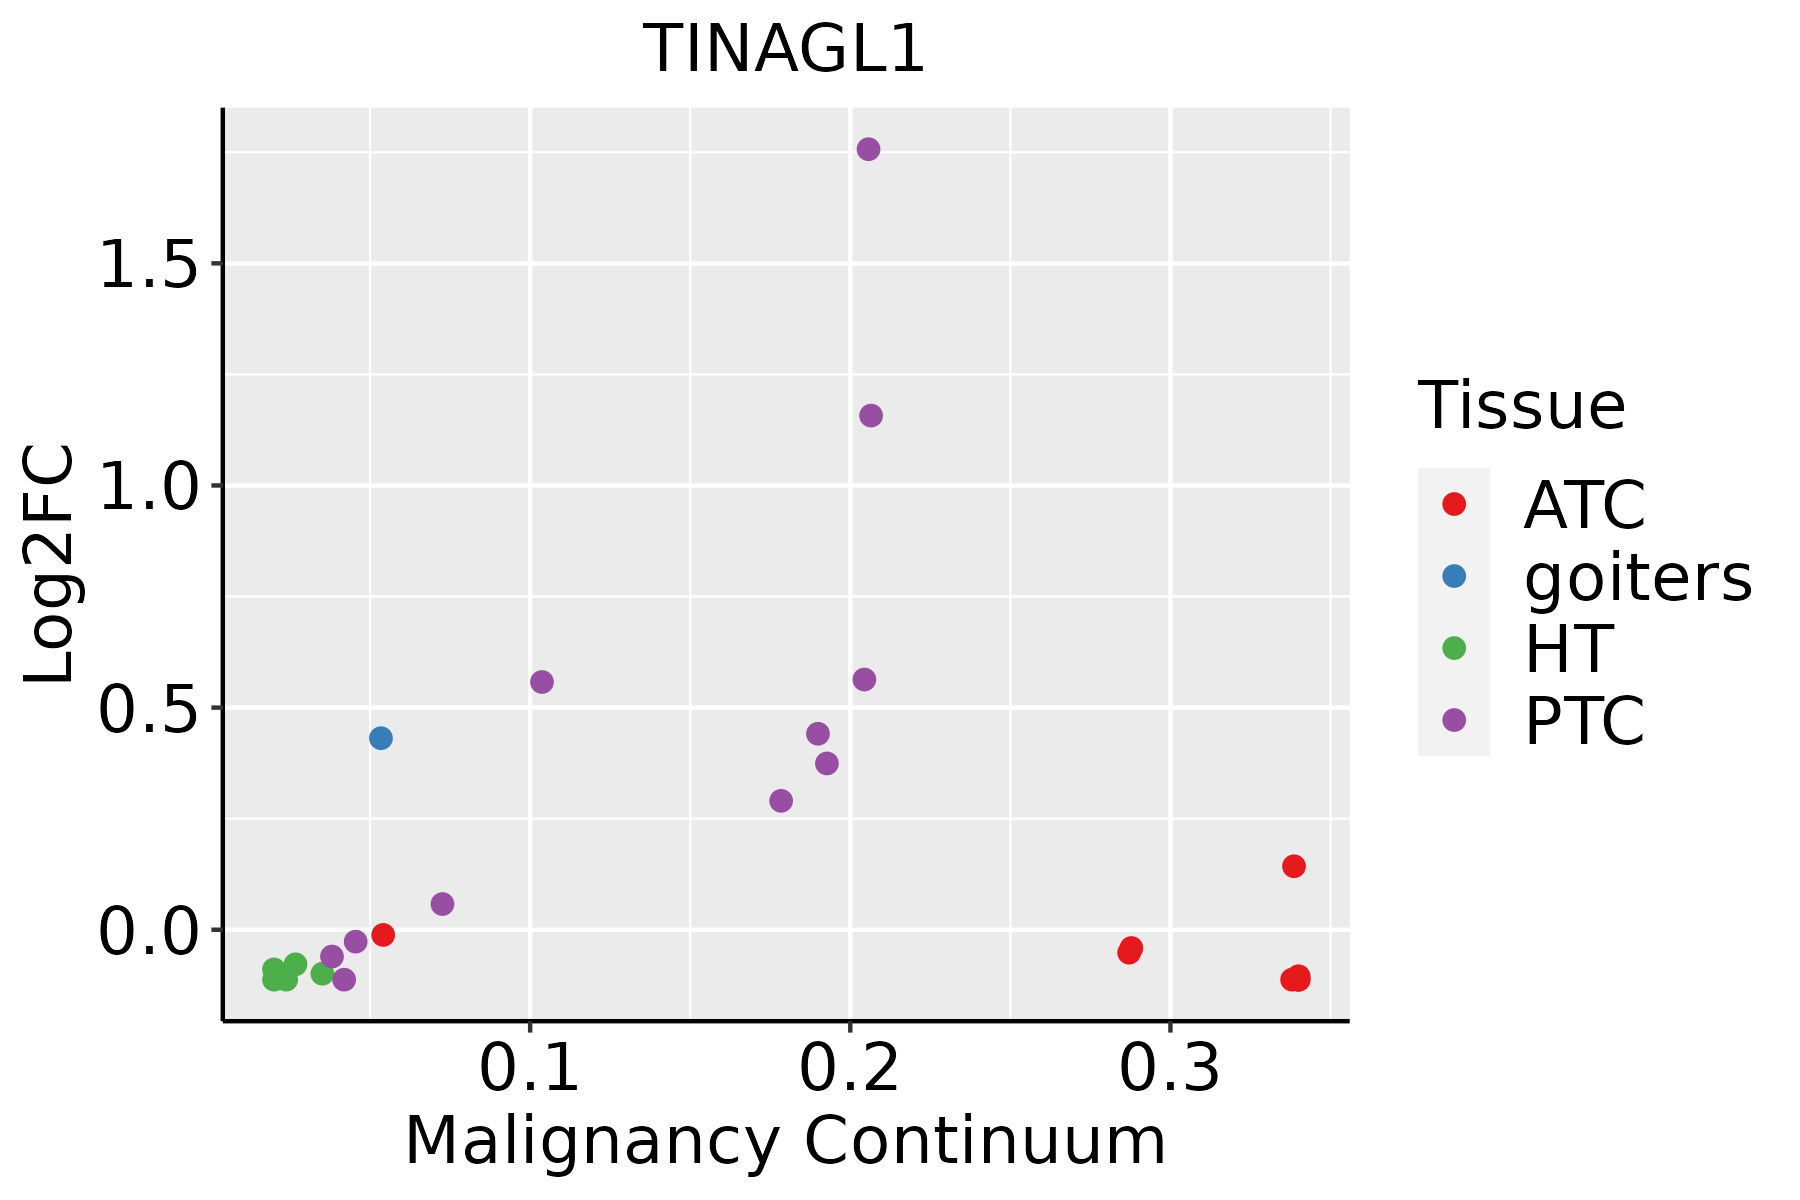 | ATC: Anaplastic thyroid cancer |
| HT: Hashimoto's thyroiditis | ||
| PTC: Papillary thyroid cancer |
| ∗log2FC in expression of this searched gene in stem-like cells from each diseased tissue sample relative to stem-like cells in normal samples in each tissue plotted against the malignancy continuum. Samples are colored based on if they are from different disease stage. |
Top |
Malignant transformation related pathway analysis |
| Find out the enriched GO biological processes and KEGG pathways involved in transition from healthy to precancer to cancer |
| Tissue | Disease Stage | Enriched GO biological Processes |
| Colorectum | AD |  |
| Colorectum | SER |  |
| Colorectum | MSS |  |
| Colorectum | MSI-H |  |
| Colorectum | FAP |  |
| ∗Top 15 enriched GO BP terms are showed in the bar plot of each disease state in each tissue. Each row represents a significant GO biological process which is colored according to the -log10(p.adjust). |
| Page: 1 2 3 4 5 6 7 8 9 |
| GO ID | Tissue | Disease Stage | Description | Gene Ratio | Bg Ratio | pvalue | p.adjust | Count |
| GO:00161977 | Cervix | CC | endosomal transport | 48/2311 | 230/18723 | 1.65e-04 | 1.97e-03 | 48 |
| GO:0016197 | Colorectum | AD | endosomal transport | 90/3918 | 230/18723 | 1.88e-10 | 1.73e-08 | 90 |
| GO:00161971 | Colorectum | SER | endosomal transport | 61/2897 | 230/18723 | 1.03e-05 | 3.35e-04 | 61 |
| GO:00161972 | Colorectum | MSS | endosomal transport | 79/3467 | 230/18723 | 7.04e-09 | 4.39e-07 | 79 |
| GO:00161973 | Colorectum | FAP | endosomal transport | 56/2622 | 230/18723 | 1.79e-05 | 4.53e-04 | 56 |
| GO:001619715 | Esophagus | ESCC | endosomal transport | 168/8552 | 230/18723 | 2.28e-17 | 1.93e-15 | 168 |
| GO:001619711 | Liver | Cirrhotic | endosomal transport | 93/4634 | 230/18723 | 1.01e-07 | 2.93e-06 | 93 |
| GO:001619721 | Liver | HCC | endosomal transport | 154/7958 | 230/18723 | 4.74e-14 | 2.95e-12 | 154 |
| GO:00161979 | Oral cavity | OSCC | endosomal transport | 141/7305 | 230/18723 | 5.40e-12 | 2.06e-10 | 141 |
| GO:001619714 | Oral cavity | LP | endosomal transport | 98/4623 | 230/18723 | 1.65e-09 | 7.50e-08 | 98 |
| GO:001619731 | Oral cavity | NEOLP | endosomal transport | 41/2005 | 230/18723 | 7.41e-04 | 6.05e-03 | 41 |
| GO:00161978 | Prostate | BPH | endosomal transport | 62/3107 | 230/18723 | 4.54e-05 | 4.77e-04 | 62 |
| GO:001619713 | Prostate | Tumor | endosomal transport | 62/3246 | 230/18723 | 1.65e-04 | 1.47e-03 | 62 |
| GO:001619718 | Thyroid | PTC | endosomal transport | 128/5968 | 230/18723 | 6.26e-14 | 3.52e-12 | 128 |
| Page: 1 |
| Pathway ID | Tissue | Disease Stage | Description | Gene Ratio | Bg Ratio | pvalue | p.adjust | qvalue | Count |
| Page: 1 |
Top |
Cell-cell communication analysis |
| Identification of potential cell-cell interactions between two cell types and their ligand-receptor pairs for different disease states |
| Ligand | Receptor | LRpair | Pathway | Tissue | Disease Stage |
| Page: 1 |
Top |
Single-cell gene regulatory network inference analysis |
| Find out the significant the regulons (TFs) and the target genes of each regulon across cell types for different disease states |
| TF | Cell Type | Tissue | Disease Stage | Target Gene | RSS | Regulon Activity |
| ∗The dot plots of a searched regulon are shown for all cell subpopulations in each disease state of each tissue based on the regulon specific score inferred using pySCENIC and by calculating the average expression. |
| Page: 1 |
Top |
Somatic mutation of malignant transformation related genes |
| Annotation of somatic variants for genes involved in malignant transformation |
| Hugo Symbol | Variant Class | Variant Classification | dbSNP RS | HGVSc | HGVSp | HGVSp Short | SWISSPROT | BIOTYPE | SIFT | PolyPhen | Tumor Sample Barcode | Tissue | Histology | Sex | Age | Stage | Therapy Types | Drugs | Outcome |
| TINAGL1 | SNV | Missense_Mutation | novel | c.446C>T | p.Ala149Val | p.A149V | Q9GZM7 | protein_coding | tolerated(0.52) | possibly_damaging(0.613) | TCGA-AN-A046-01 | Breast | breast invasive carcinoma | Female | >=65 | I/II | Unknown | Unknown | SD |
| TINAGL1 | SNV | Missense_Mutation | novel | c.1209N>C | p.Lys403Asn | p.K403N | Q9GZM7 | protein_coding | deleterious(0) | probably_damaging(0.918) | TCGA-B6-A0RG-01 | Breast | breast invasive carcinoma | Female | <65 | I/II | Unknown | Unknown | SD |
| TINAGL1 | SNV | Missense_Mutation | c.1318N>A | p.Val440Met | p.V440M | Q9GZM7 | protein_coding | deleterious(0.01) | benign(0.354) | TCGA-AD-6895-01 | Colorectum | colon adenocarcinoma | Male | >=65 | III/IV | Unknown | Unknown | SD | |
| TINAGL1 | SNV | Missense_Mutation | c.1253T>C | p.Leu418Pro | p.L418P | Q9GZM7 | protein_coding | tolerated(0.26) | benign(0.377) | TCGA-CK-4951-01 | Colorectum | colon adenocarcinoma | Female | >=65 | I/II | Unknown | Unknown | PD | |
| TINAGL1 | SNV | Missense_Mutation | c.820C>T | p.Arg274Cys | p.R274C | Q9GZM7 | protein_coding | tolerated(0.08) | possibly_damaging(0.896) | TCGA-CM-4746-01 | Colorectum | colon adenocarcinoma | Male | <65 | I/II | Unknown | Unknown | SD | |
| TINAGL1 | SNV | Missense_Mutation | c.842T>C | p.Phe281Ser | p.F281S | Q9GZM7 | protein_coding | deleterious(0) | probably_damaging(0.92) | TCGA-CM-6164-01 | Colorectum | colon adenocarcinoma | Female | <65 | I/II | Unknown | Unknown | SD | |
| TINAGL1 | SNV | Missense_Mutation | c.917N>T | p.Ala306Val | p.A306V | Q9GZM7 | protein_coding | tolerated(0.3) | benign(0.003) | TCGA-D5-6928-01 | Colorectum | colon adenocarcinoma | Male | >=65 | I/II | Unknown | Unknown | SD | |
| TINAGL1 | SNV | Missense_Mutation | c.172N>G | p.Arg58Gly | p.R58G | Q9GZM7 | protein_coding | deleterious(0) | probably_damaging(0.995) | TCGA-DC-6157-01 | Colorectum | rectum adenocarcinoma | Male | <65 | I/II | Unknown | Unknown | SD | |
| TINAGL1 | SNV | Missense_Mutation | novel | c.1145N>T | p.Ser382Ile | p.S382I | Q9GZM7 | protein_coding | deleterious(0) | possibly_damaging(0.69) | TCGA-A5-A0G1-01 | Endometrium | uterine corpus endometrioid carcinoma | Female | >=65 | I/II | Unknown | Unknown | SD |
| TINAGL1 | SNV | Missense_Mutation | novel | c.722N>A | p.Arg241His | p.R241H | Q9GZM7 | protein_coding | deleterious(0) | probably_damaging(0.999) | TCGA-A5-A0G2-01 | Endometrium | uterine corpus endometrioid carcinoma | Female | <65 | III/IV | Unknown | Unknown | SD |
| Page: 1 2 3 4 |
Top |
Related drugs of malignant transformation related genes |
| Identification of chemicals and drugs interact with genes involved in malignant transfromation |
| (DGIdb 4.0) |
| Entrez ID | Symbol | Category | Interaction Types | Drug Claim Name | Drug Name | PMIDs |
| Page: 1 |

Copyright 2023-Present -The University of Texas Health Science Center at Houston |