
|
|||||
|
 | |
| |
| |
| |
| |
| |
|
Gene: TINAG |
Gene summary for TINAG |
| Gene information | Species | Human | Gene symbol | TINAG | Gene ID | 27283 |
| Gene name | tubulointerstitial nephritis antigen | |
| Gene Alias | TIN-AG | |
| Cytomap | 6p12.1 | |
| Gene Type | protein-coding | GO ID | GO:0006508 | UniProtAcc | Q6NSC1 |
Top |
Malignant transformation analysis |
| Identification of the aberrant gene expression in precancerous and cancerous lesions by comparing the gene expression of stem-like cells in diseased tissues with normal stem cells |
| Entrez ID | Symbol | Replicates | Species | Organ | Tissue | Adj P-value | Log2FC | Malignancy |
| 27283 | TINAG | HCC1_Meng | Human | Liver | HCC | 2.46e-76 | 3.99e-01 | 0.0246 |
| 27283 | TINAG | HCC2_Meng | Human | Liver | HCC | 3.18e-15 | 1.24e-01 | 0.0107 |
| 27283 | TINAG | HCC2 | Human | Liver | HCC | 1.21e-05 | 1.70e+00 | 0.5341 |
| 27283 | TINAG | S027 | Human | Liver | HCC | 2.14e-11 | 7.47e-01 | 0.2446 |
| 27283 | TINAG | S028 | Human | Liver | HCC | 7.67e-39 | 1.14e+00 | 0.2503 |
| 27283 | TINAG | S029 | Human | Liver | HCC | 3.37e-28 | 1.29e+00 | 0.2581 |
| Page: 1 |
| Tissue | Expression Dynamics | Abbreviation |
| Liver | 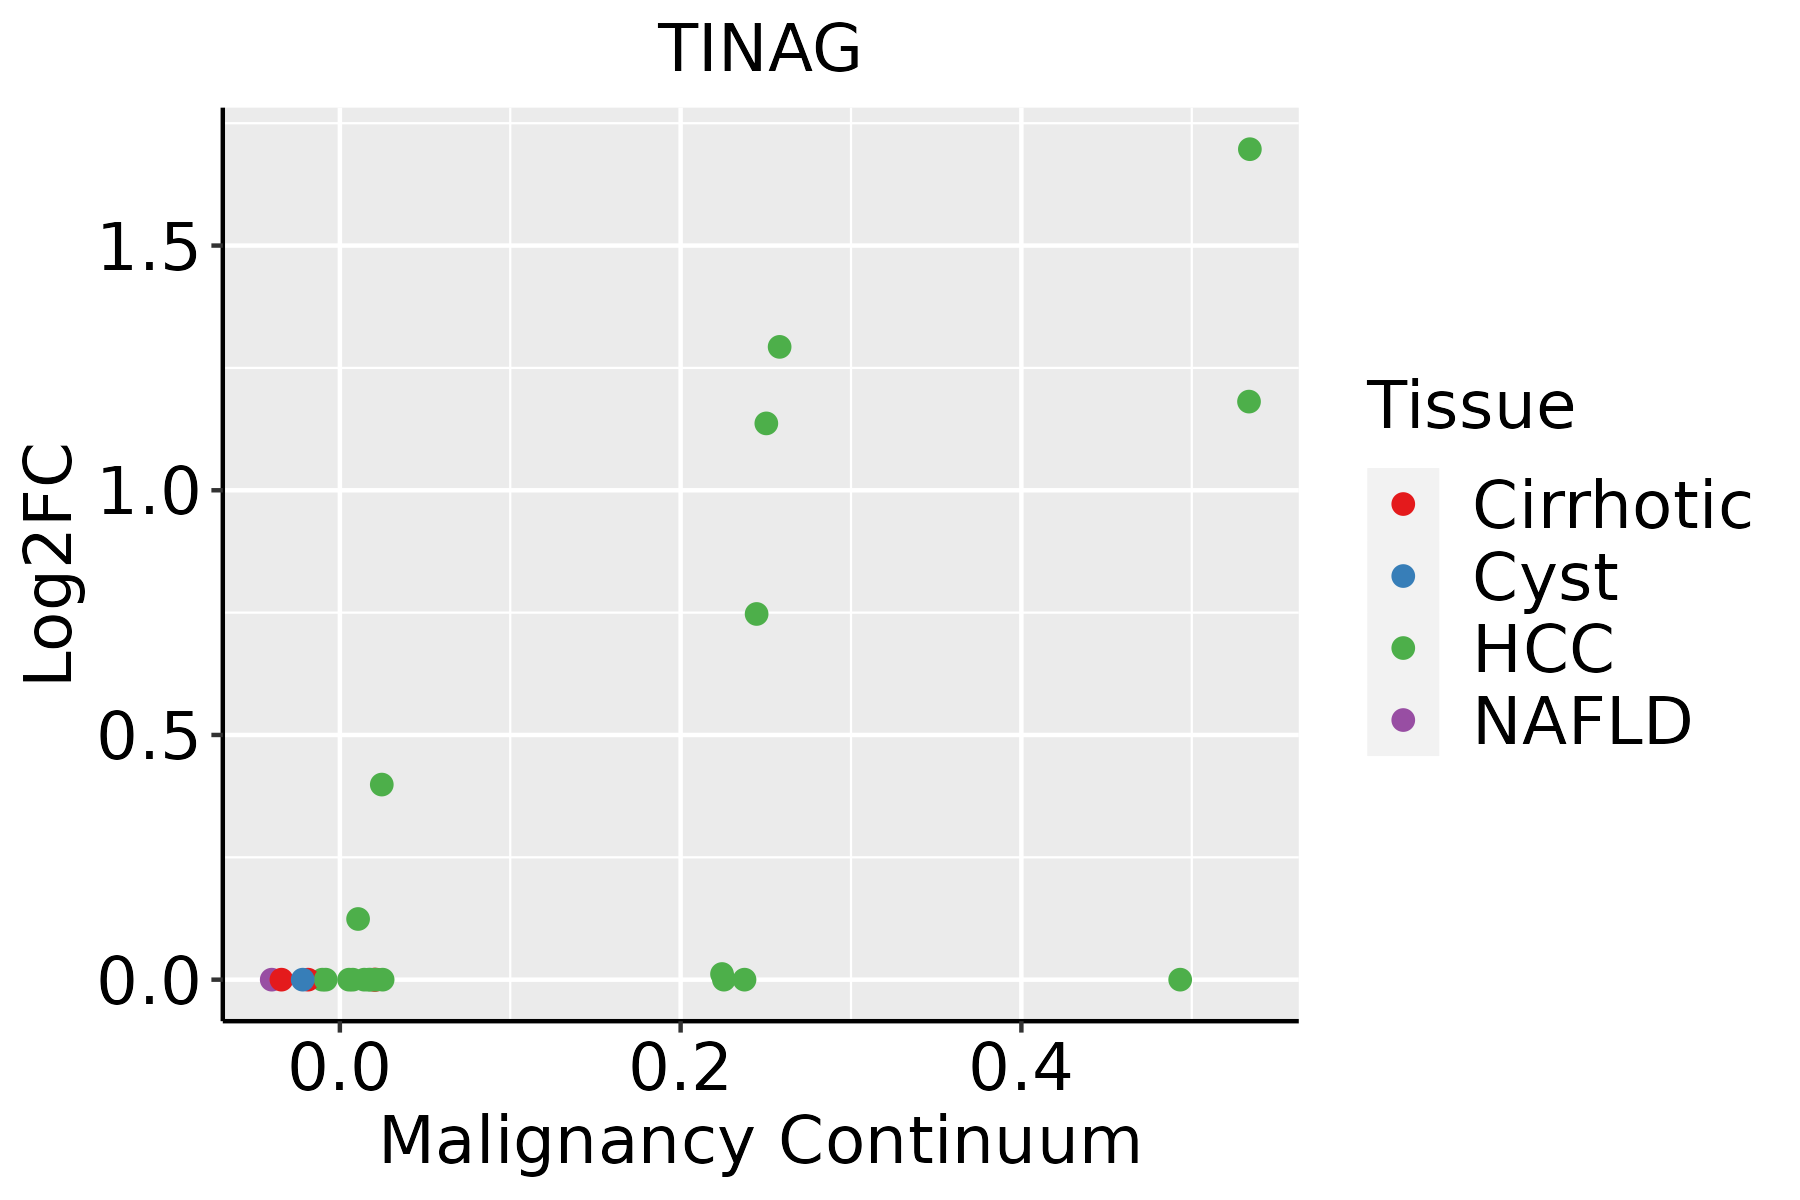 | HCC: Hepatocellular carcinoma |
| NAFLD: Non-alcoholic fatty liver disease |
| ∗log2FC in expression of this searched gene in stem-like cells from each diseased tissue sample relative to stem-like cells in normal samples in each tissue plotted against the malignancy continuum. Samples are colored based on if they are from different disease stage. |
Top |
Malignant transformation related pathway analysis |
| Find out the enriched GO biological processes and KEGG pathways involved in transition from healthy to precancer to cancer |
| Tissue | Disease Stage | Enriched GO biological Processes |
| Colorectum | AD |  |
| Colorectum | SER |  |
| Colorectum | MSS |  |
| Colorectum | MSI-H |  |
| Colorectum | FAP |  |
| ∗Top 15 enriched GO BP terms are showed in the bar plot of each disease state in each tissue. Each row represents a significant GO biological process which is colored according to the -log10(p.adjust). |
| Page: 1 2 3 4 5 6 7 8 9 |
| GO ID | Tissue | Disease Stage | Description | Gene Ratio | Bg Ratio | pvalue | p.adjust | Count |
| GO:00161977 | Cervix | CC | endosomal transport | 48/2311 | 230/18723 | 1.65e-04 | 1.97e-03 | 48 |
| GO:0016197 | Colorectum | AD | endosomal transport | 90/3918 | 230/18723 | 1.88e-10 | 1.73e-08 | 90 |
| GO:00161971 | Colorectum | SER | endosomal transport | 61/2897 | 230/18723 | 1.03e-05 | 3.35e-04 | 61 |
| GO:00161972 | Colorectum | MSS | endosomal transport | 79/3467 | 230/18723 | 7.04e-09 | 4.39e-07 | 79 |
| GO:00161973 | Colorectum | FAP | endosomal transport | 56/2622 | 230/18723 | 1.79e-05 | 4.53e-04 | 56 |
| GO:001619715 | Esophagus | ESCC | endosomal transport | 168/8552 | 230/18723 | 2.28e-17 | 1.93e-15 | 168 |
| GO:001619711 | Liver | Cirrhotic | endosomal transport | 93/4634 | 230/18723 | 1.01e-07 | 2.93e-06 | 93 |
| GO:001619721 | Liver | HCC | endosomal transport | 154/7958 | 230/18723 | 4.74e-14 | 2.95e-12 | 154 |
| GO:00161979 | Oral cavity | OSCC | endosomal transport | 141/7305 | 230/18723 | 5.40e-12 | 2.06e-10 | 141 |
| GO:001619714 | Oral cavity | LP | endosomal transport | 98/4623 | 230/18723 | 1.65e-09 | 7.50e-08 | 98 |
| GO:001619731 | Oral cavity | NEOLP | endosomal transport | 41/2005 | 230/18723 | 7.41e-04 | 6.05e-03 | 41 |
| GO:00161978 | Prostate | BPH | endosomal transport | 62/3107 | 230/18723 | 4.54e-05 | 4.77e-04 | 62 |
| GO:001619713 | Prostate | Tumor | endosomal transport | 62/3246 | 230/18723 | 1.65e-04 | 1.47e-03 | 62 |
| GO:001619718 | Thyroid | PTC | endosomal transport | 128/5968 | 230/18723 | 6.26e-14 | 3.52e-12 | 128 |
| Page: 1 |
| Pathway ID | Tissue | Disease Stage | Description | Gene Ratio | Bg Ratio | pvalue | p.adjust | qvalue | Count |
| Page: 1 |
Top |
Cell-cell communication analysis |
| Identification of potential cell-cell interactions between two cell types and their ligand-receptor pairs for different disease states |
| Ligand | Receptor | LRpair | Pathway | Tissue | Disease Stage |
| Page: 1 |
Top |
Single-cell gene regulatory network inference analysis |
| Find out the significant the regulons (TFs) and the target genes of each regulon across cell types for different disease states |
| TF | Cell Type | Tissue | Disease Stage | Target Gene | RSS | Regulon Activity |
| ∗The dot plots of a searched regulon are shown for all cell subpopulations in each disease state of each tissue based on the regulon specific score inferred using pySCENIC and by calculating the average expression. |
| Page: 1 |
Top |
Somatic mutation of malignant transformation related genes |
| Annotation of somatic variants for genes involved in malignant transformation |
| Hugo Symbol | Variant Class | Variant Classification | dbSNP RS | HGVSc | HGVSp | HGVSp Short | SWISSPROT | BIOTYPE | SIFT | PolyPhen | Tumor Sample Barcode | Tissue | Histology | Sex | Age | Stage | Therapy Types | Drugs | Outcome |
| TINAG | SNV | Missense_Mutation | c.553G>C | p.Glu185Gln | p.E185Q | Q9UJW2 | protein_coding | deleterious(0.02) | probably_damaging(0.921) | TCGA-A2-A0SY-01 | Breast | breast invasive carcinoma | Female | <65 | III/IV | Hormone Therapy | arimidex | SD | |
| TINAG | SNV | Missense_Mutation | c.83N>G | p.Glu28Gly | p.E28G | Q9UJW2 | protein_coding | tolerated_low_confidence(0.19) | benign(0) | TCGA-A8-A095-01 | Breast | breast invasive carcinoma | Female | <65 | I/II | Chemotherapy | 5-fluorouracil | CR | |
| TINAG | SNV | Missense_Mutation | c.530N>A | p.Ser177Asn | p.S177N | Q9UJW2 | protein_coding | deleterious(0) | possibly_damaging(0.895) | TCGA-AC-A2BM-01 | Breast | breast invasive carcinoma | Female | <65 | I/II | Unknown | Unknown | SD | |
| TINAG | SNV | Missense_Mutation | c.890G>T | p.Arg297Ile | p.R297I | Q9UJW2 | protein_coding | deleterious(0) | possibly_damaging(0.617) | TCGA-AN-A046-01 | Breast | breast invasive carcinoma | Female | >=65 | I/II | Unknown | Unknown | SD | |
| TINAG | SNV | Missense_Mutation | c.994C>T | p.Arg332Trp | p.R332W | Q9UJW2 | protein_coding | deleterious(0) | probably_damaging(0.999) | TCGA-AQ-A0Y5-01 | Breast | breast invasive carcinoma | Female | >=65 | III/IV | Chemotherapy | cytoxan | SD | |
| TINAG | SNV | Missense_Mutation | c.431N>A | p.Gly144Glu | p.G144E | Q9UJW2 | protein_coding | tolerated(0.55) | benign(0.005) | TCGA-BH-A0HF-01 | Breast | breast invasive carcinoma | Female | >=65 | I/II | Hormone Therapy | arimidex | SD | |
| TINAG | SNV | Missense_Mutation | c.994N>T | p.Arg332Trp | p.R332W | Q9UJW2 | protein_coding | deleterious(0) | probably_damaging(0.999) | TCGA-D8-A143-01 | Breast | breast invasive carcinoma | Female | <65 | I/II | Chemotherapy | doxorubicin | SD | |
| TINAG | SNV | Missense_Mutation | novel | c.1426C>G | p.Pro476Ala | p.P476A | Q9UJW2 | protein_coding | deleterious_low_confidence(0) | benign(0.005) | TCGA-EW-A3U0-01 | Breast | breast invasive carcinoma | Female | <65 | III/IV | Chemotherapy | cisplatin | CR |
| TINAG | deletion | Frame_Shift_Del | novel | c.938delN | p.Asn314MetfsTer29 | p.N314Mfs*29 | Q9UJW2 | protein_coding | TCGA-EW-A2FV-01 | Breast | breast invasive carcinoma | Female | <65 | III/IV | Chemotherapy | docetaxel | SD | ||
| TINAG | SNV | Missense_Mutation | rs115438249 | c.571C>T | p.Arg191Cys | p.R191C | Q9UJW2 | protein_coding | deleterious(0) | probably_damaging(0.92) | TCGA-BI-A0VR-01 | Cervix | cervical & endocervical cancer | Female | <65 | III/IV | Unknown | Unknown | SD |
| Page: 1 2 3 4 5 6 7 8 9 |
Top |
Related drugs of malignant transformation related genes |
| Identification of chemicals and drugs interact with genes involved in malignant transfromation |
| (DGIdb 4.0) |
| Entrez ID | Symbol | Category | Interaction Types | Drug Claim Name | Drug Name | PMIDs |
| Page: 1 |

Copyright 2023-Present -The University of Texas Health Science Center at Houston |